


Stunting (linear growth retardation) among children is a serious public health problem in low-income countries, which, together with ill health and poverty, is associated with poor motor, cognitive and social development in at least 200 million children worldwide(Reference Grantham-McGregor, Cheung and Cueto1). Stunting, which primarily affects children in their second year of life(Reference Berkman, Lescano and Gilman2–Reference Maleta, Virtanen and Espo4), is a result of chronic inadequate intake of energy and nutrients, as well as frequent infections(Reference Grantham-McGregor, Cheung and Cueto1).
Since the 1980s, the prevalence of stunting has been steadily declining in some parts of the developing world such as Asia, Latin America and the Caribbean(5). Africa and the sub-Saharan region, however, registered only modest improvements during that period, raising questions about the effectiveness of public health programmes that aim to reduce chronic undernutrition in these regions.
In Malawi, stunting affects one in two children under the age of 5 years; this has been the case for many years. National demographic and health surveys conducted in 1992, 2000 and 2004 estimated that stunting was prevalent in 50·3 %, 51·2 % and 49·2 %, respectively, of children below the age of 5 years who lived in rural areas(6–8), where 84 % of the Malawian population lives(Reference Walker, Wachs and Gardner9).
Severe stunting (<−3sd scores) during the first 2 years of life has been found to be associated with cognitive deficits at the age of 9 years(Reference Berkman, Lescano and Gilman2). Consequently, stunted children tend to have poor school enrolment, retention and progress, as well as low literacy, numeracy and general knowledge(Reference Grantham-McGregor, Cheung and Cueto1, Reference Walker, Wachs and Gardner9). Later in life, such disadvantages may increase vulnerability to poverty, thereby sustaining an inter-generational cycle of social and economic deprivation. Women who have short stature (<150 cm) have an increased risk of perinatal mortality in Malawi(Reference McDermott, Steketee and Wirima10), while a recent study has shown that in Tanzania, women who are <156 cm tall have a significant risk of delivering still births, low-birth-weight babies and intra-uterine growth-retarded children(Reference Watson-Jones, Weiss and Changalucha11). Therefore, programmes that aim to reduce stunting among children are desperately needed to reinforce efforts aimed at breaking the cycle of poverty in low-income countries, in addition to improving pregnancy outcomes and child survival.
In 1995, an integrated community-based micronutrient and health (MICAH) programme was launched by World Vision Canada, and subsequently implemented in five African countries (Ethiopia, Ghana, Malawi, Senegal and Tanzania), to improve the nutrition and health status of women and children through cost-effective and sustainable interventions(12). With support from World Vision Canada in collaboration with its partners, World Vision Malawi designed, implemented, monitored and evaluated an integrated programme to improve maternal and child nutrition and health in rural areas in Malawi from 1996 to 2005 (Table 1). The programme, which directly benefited 272 391 people(12), was supported by the Canadian International Development Agency and World Vision Canada’s private donors. Given both the high levels of stunting in Malawi, and the comprehensive nature of the MICAH programme, the present study was conducted to determine the impact of the MICAH programme on linear growth retardation among preschool Malawian children.
Table 1 Summary of the micronutrient and health (MICAH) programme objectives and interventions
Sources: references(12–Reference Cummings, Beyer and MacDonald14).
†Evaluation of Phase I of the programme identified these gaps, which were implemented in Phase II.
Materials and methods
Description of the MICAH programme to address anaemia and iodine deficiencies
The MICAH programme began in 1996 under the management of World Vision Malawi (WVM), implemented by eleven government and non-government (NGO) partners. The MICAH programme operated in nineteen project sites, within fourteen of Malawi's twenty-six districts and in all administrative regions of Malawi (North, Centre and South); the programme reached approximately 270 000 beneficiaries, with indirect benefits extending to 4·7 million. The nineteen MICAH project areas were identified as a result of expressed needs by communities and selection criteria (e.g. lower access to health services, highest levels of malnutrition) determined by line ministries and partner NGO staff. The programme operated largely in rural areas, where people are mainly subsistence farmers and fishermen, growing crops of maize and legumes, with very little access to animal-source foods. The comprehensive package to reduce anaemia and iodine deficiency included interventions to achieve three objectives: (i) improve Fe and iodine status; (ii) reduce the prevalence of disease contributing to anaemia; and (iii) build capacity to implement programmes to address micronutrients outlined in Table 1.
Description of the surveys and the data
From a large data set of three cross-sectional surveys conducted in 1996, 2000 and 2004, children’s anthropometric values were extracted for analysis (Fig. 1). Baseline data were collected in 1996, while data on programme evaluation were collected in 2000 (for Phase I: 1996–2000) and 2004 (for Phase II: 2000–2005, and the entire programme). Although programme evaluation took place in 2004, interventions continued until the programme ended in 2005.
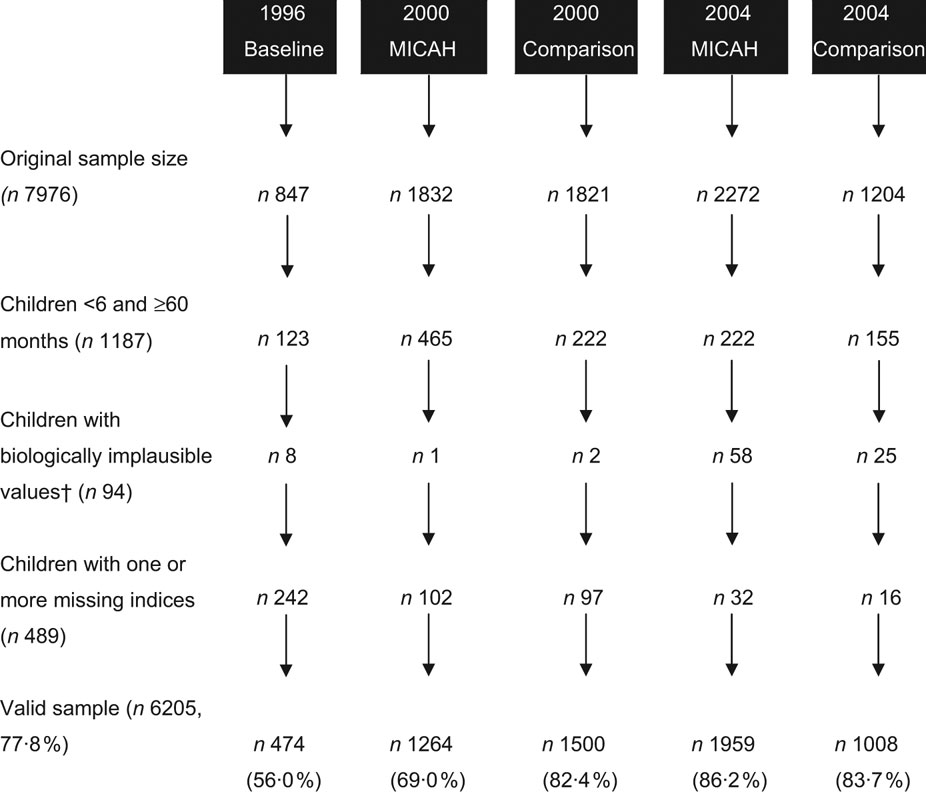
Fig. 1 Flow chart showing sample sizes, exclusion criteria and the number of records excluded at each stage. †Children’s records that had biologically implausible Z-scores were flagged based on the following criteria: height-for-age Z-scores (HAZ) <−6·0, >6·0; weight-for-height Z-scores (WHZ) <−4·0, >6·0; weight-for-age Z-scores (WAZ) <−6·0, >6·0. Records that fulfilled the following conditions were also flagged: HAZ > 3·09 and WHZ < −3·09, or HAZ < −3·09 and WHZ > 3·09(16)
Primarily, the data were collected in cross-sectional surveys using structured household questionnaires, which included anthropometric measurements. Because the interviews were conducted in two local languages (Chichewa and Chitumbuka), the questionnaires were translated into these languages by teams of enumerators during survey training, and then back-translated into English to ensure that the questions preserved the original English meanings(15).
MICAH areas constituted populations that participated in the programme throughout its course. On the other hand, ‘Comparison areas’ participated in the programme until late 1999 when the interventions were withdrawn following recommendations of a mid-term evaluation to focus the full complement of the interventions in fewer areas rather than single interventions in more areas (C MacDonald, personal communication, February 2007). Such areas became the Comparison areas during the 2000 and 2004 surveys.
Sampling
As part of preparations for the surveys, project officers and community leaders conducted community sensitisation meetings in all areas on the purpose of the surveys. From a list of clusters (villages that were randomly selected) and their population sizes in MICAH and Comparison areas, a probability proportional to population size sampling methodology was used to select participating clusters. Using household lists, a sampling interval was devised and used to systematically random-sample the actual households to participate in the survey. The primary respondent was the main care provider of children in the household who was informed about the purpose of the survey and the different modules that the interview would cover, including laboratory requirements that the respondent and eligible children were expected to participate in. There were no incentives given to those who participated in the surveys; however, women and children who were diagnosed with anaemia or parasitic infections received prompt treatment or referral to public health facilities.
All three surveys targeted households that had children aged 6–59·9 months. Household lists were prepared from randomly selected clusters. In 1996, census clusters were used as sampling frames, while in 2000 and 2004, villages were used as sampling frames. Given the random nature of sampling, the sampling frames were not identical across the three surveys, although a few were identical. As well, given the 4-year gap between any two surveys, it was not possible to measure the same children since eligibility was based on a specific age bracket.
Anthropometric measurements and indices
Weighing scales (Salter, Sussex, UK) and locally made length/height-measuring boards were used to take weight and length/height measurements for all eligible children using standard protocols(Reference Gibson17). Weight was recorded to the nearest 0·1 kg, and height/length to the nearest 0·1 cm. During each survey, several research teams were constituted, comprising laboratory technicians, anthropometrists and enumerators. Only those with experience and training in community work were selected for training. Given the nature of the surveys and the period between them, it was not possible to maintain the same data collectors (who were mostly university students), although the trainers and field supervisors remained largely the same. The data collectors were blinded to the children’s intervention status.
All anthropometrists were trained by nutritionists, and closely supervised throughout the surveys. Children’s birth dates were recorded from child health cards or health passport booklets that are commonly used in Malawi. Weight, height, sex and age variables were used to compute Z-scores based on the 1978 NCHS/WHO international references for the growth of children(18). The height-for-age Z-score (HAZ) index was created and used to measure stunting; HAZ < −2 denoted stunting, while HAZ < −3 denoted severe stunting(18).
Data analysis
The data were entered in Epi Info 6·04d (Centers for Disease Control and Prevention, Atlanta, GA, USA) in which the Z-scores were computed, and exported to the Statistical Package for the Social Sciences statistical software package version 14·0 (SPSS Inc., Chicago, IL, USA) for statistical analysis. The valid sample (n 6205) was examined for normality and homogeneity of variance, consistent with assumptions for univariate analysis of variance with HAZ as the dependent variable while status within the programme (i.e. MICAH, Comparison and Baseline) and region (North, Center and South) were fixed factors. The analysis was stratified at the regional level because: (i) the three regions are the administrative structures within which public health and other programmes are administered in Malawi, which the MICAH programme also modelled; and (ii) previous studies have shown regional disparities in the prevalence of undernutrition(8, Reference Kalimbira, Chilima and Mtimuni19). F statistics were computed to compare mean anthropometric values across the fixed factor levels, while partial eta-squared (η 2) was used to estimate the effect size. Proportional differences were examined using the Pearson χ 2 statistic. Because of heterogeneity of variance of the HAZ index across groups, multiple-comparison of means was done using Games–Howell post hoc tests. Since a probability proportional to population size methodology was employed during data collection, the data were weighted using cluster populations provided by the National Statistical Office in Zomba, Malawi. Mean and proportional differences were considered statistically significant at P ≤ 0·05. Risk reductions and OR were computed online using the University of British Columbia clinical significance calculator(20).
Ethical approval
The MICAH programme received ethical approval from the Ministry of Health in Malawi, whereas ethics approval to use the data set for further analysis was granted by the University of Guelph Research Ethics Board in Canada. At the community level, the surveys were conducted after verbal consent from traditional authorities in the participating clusters, and finally from the sampled household heads or interviewees.
Results
Demographic characteristics of the children and their households
A total of 6205 children were included in the analysis, and their demographic characteristics as well as those of their households are shown in Table 2. Generally, there were slightly more female than male children except for MICAH areas in 2004, which had significantly fewer female (48·4 %) than male children (P < 0·05). Children sampled in 1996 were slightly (∼2 months) but significantly younger (P < 0·05) than those sampled in 2004 MICAH areas. Children sampled at the baseline (1996) and those from 2000 Comparison areas were significantly shorter than children from other groups (P < 0·05) even after adjusting for age (31·1 months). In terms of weight, children who were sampled at the baseline and those from 2000 MICAH and Comparison areas were significantly lighter than those from 2004 MICAH and Comparison areas (P < 0·05). When adjusted for age, the mean weights in 2000 MICAH and Comparison areas became significantly different from the baseline. Adjusting either weight or height by gender of the children had no effect on the results.
Table 2 Characteristics of children from the micronutrient and health programme (MICAH) and Comparison areas
a,b,cValues within a row with unlike superscript letters were significantly different (P < 0·05).
†Overall χ 2 could not be calculated because of inadequate count in some cells.
‡When adjusted for age (31·1 months), the mean weights in 2000 MICAH and Comparison areas became significantly different from the baseline. The age-adjusted weights were as follows: 11·4 kg in 1996; 11·1 kg in 2000 MICAH areas; 11·0 kg in 2000 Comparison areas; 12·4 kg in 2004 MICAH areas; and 11·7 kg in 2004 Comparison areas.
Distribution of height-for-age Z-scores
One-way univariate analysis of variance showed a significant between-subjects effect F(5, 5998) = 2374·4, P < 0·001. The partial eta-squared was high (η 2 = 0·664), which means that about two-thirds of the univariate variance of HAZ was associated with status in the programme (i.e. Baseline, MICAH and Comparison).
Table 3 shows the mean HAZ of the children. At the baseline, the mean HAZ was −2·39 (95 % CI −2·52, −2·26), which significantly improved in each subsequent survey (P < 0·001) except in 2000 Comparison areas (P = 0·6). In MICAH areas, children’s HAZ showed significant improvements in Phase I (1996–2000) (P < 0·001) and Phase II (2000–2004) (P = 0·01). On the contrary, in Comparison areas, there was no significant improvement in HAZ in Phase I (P = 0·6), but a highly significant improvement in Phase II (P < 0·001). Adjusting the results for region of residence (North, Centre or South) and/or age of the children did not alter the results.
Table 3 Mean height-for-age Z-scores (95 % CI) of children from the micronutrient and health programme (MICAH) and Comparison areasFootnote †
† All results, including sample sizes were weighted. See Fig. 1 for crude sample sizes.
‡ Mean Z-scores were compared between MICAH and Comparison areas.
§ Mean Z-scores were compared between 2000 and the baseline.
|| Mean Z-scores were compared between 2004 and 2000 in the same group (MICAH or Comparison areas).
Figure 2 shows the baseline and end-of-programme distribution of HAZ in MICAH and Comparison areas relative to the international reference curve (WHO, 1995). The MICAH curve approached the reference Z-score distribution, whereas the Comparison curve lagged behind.
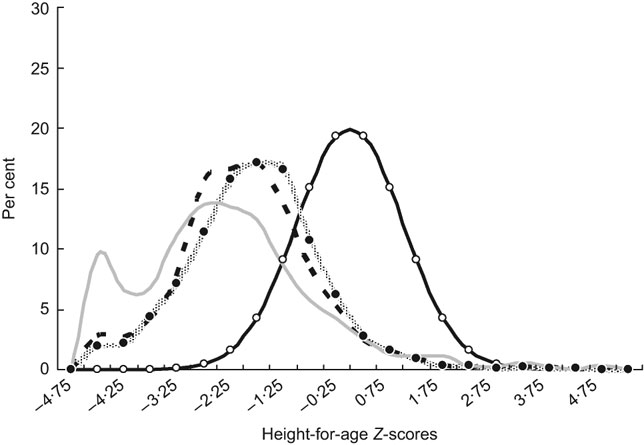
Fig. 2 Distribution of height-for-age Z-scores at baseline and in the micronutrient and health programme (MICAH) and Comparison areas in 2004 (![]() , reference population;
, reference population; ![]() , 2004 MICAH;
, 2004 MICAH; ![]() , 2004 Comparison; 1, 1996 baseline)
, 2004 Comparison; 1, 1996 baseline)
Prevalence of undernutrition
Sixty per cent of the children were stunted at the baseline (Fig. 3). In 2000, the prevalence of stunting declined in both areas, but it was significantly lower in MICAH than Comparison areas (χ 2 = 7·8, P = 0·005). Within the same group (MICAH or Comparison), the prevalence of stunting was significantly lower in each subsequent survey (P < 0·001) except for the difference between the baseline and 2000 Comparison areas (χ 2 = 2·6, df = 1, P = 0·1). The difference in 2004 was non-significant (χ 2 = 1·1, P = 0·3). In MICAH areas, the rate of decline was slightly higher between 1996 and 2000 (9·6 %) than between 2000 and 2004 (7·6 %). On the other hand, the prevalence of stunting among children in Comparison areas declined more between 2000 and 2004 (10·9 %) than between 1996 and 2000 (4·2 %). Overall, from 1996 to 2004, the prevalence of stunting decreased by 17·2 % and 15·1 % (P < 0·05) in MICAH and Comparison areas, respectively.
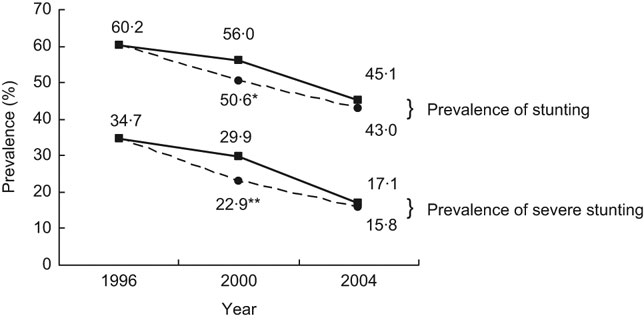
Fig. 3 Prevalence of stunting (height-for-age Z-score (HAZ) < −2) and severe stunting (HAZ < −3) among preschool children in the micronutrient and health programme (MICAH) (![]() ) and Comparison areas (
) and Comparison areas (![]() ) across the three surveys. *Significantly lower than Comparison areas in the same year (χ 2 = 7·8, df = 1, P = 0·005). **Significantly lower than Comparison areas in the same year (χ 2 = 6·4, df = 1, P = 0·01)
) across the three surveys. *Significantly lower than Comparison areas in the same year (χ 2 = 7·8, df = 1, P = 0·005). **Significantly lower than Comparison areas in the same year (χ 2 = 6·4, df = 1, P = 0·01)
Results on severe stunting (HAZ < −3) showed a very high prevalence in 1996 (34·7 %), which accounted for 57·6 % of all stunting (Fig. 3). Significant differences were observed between MICAH and Comparison areas in 2000 (χ 2 = 6·4, P = 0·01) but not in 2004 (χ 2 = 0·7, P = 0·4). Within the same group (MICAH or Comparison), the prevalence of severe stunting was significantly lower in each subsequent survey (P ≤ 0·05).
Regional trends in the prevalence of stunting
Malawi is divided into three administrative regions of the North, Centre and South; hence it was deemed necessary to understand regional trends in stunting. The results (Fig. 4) show that at baseline, the North had the lowest stunting rate, which was approximately 20 % lower than that of the Centre and the South. However, in MICAH areas, both the Centre and the South made remarkable progress, reaching prevalence of 46·1 % and 40·5 %, respectively, at the end of the programme. In Comparison areas, similar trends were observed; surprisingly however, the prevalence of stunting in children from Comparison areas in the South dramatically improved, surpassing that of the North, and becoming equivalent to that of MICAH children in the North.
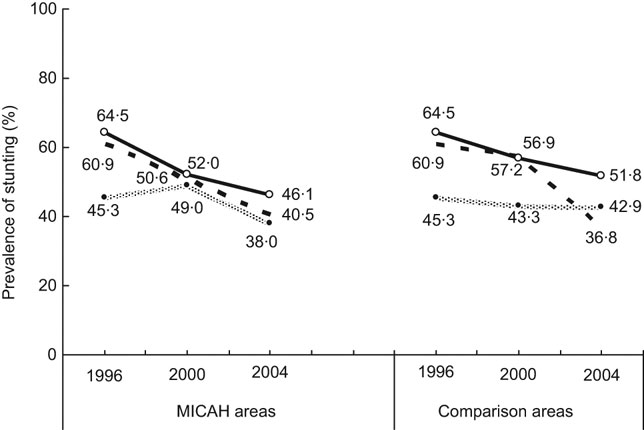
Fig. 4 Regional trends in the prevalence of stunting (height-for-age Z-score) in the micronutrient and health programme (MICAH) and Comparison areas (![]() , North;
, North; ![]() , Centre;
, Centre; ![]() , South)
, South)
Risk reductions in the prevalence of stunting
Risk reductions and OR of the prevalence of stunting in MICAH areas were estimated relative to Comparison areas. The results in Table 4 show that in Phase I, children in MICAH areas had a significant absolute risk reduction in stunting, while the risk reduction in Phase II was not significant. Overall, children from MICAH areas were less likely to be stunted than those from Comparison areas in Phase I (OR = 0·8, 95 % CI 0·7, 0·9) but not in Phase II (OR = 0·9; 95 % CI 0·8, 1·1).
Table 4 Absolute and relative risk reductions and odds ratios of the prevalence of stunting in the micronutrient and health programme (MICAH) areas in relation to Comparison areas
*P < 0·05.
†Non-significant.
Discussion
The aim of the present study was to assess the impact of an integrated, community-based micronutrient and health programme on linear growth retardation among children aged 6–59·9 months living in rural areas of Malawi. Overall, the prevalence of stunting decreased significantly from 60·2 % at the baseline, to 43 % in MICAH and 45·1 % in Comparison areas, with no significant difference between the two, although a significant difference was noted in 2000.
A number of interventions were implemented in the MICAH programme including: weekly iron supplementation in children under the age of 5 years; promotion and support of child immunisation; provision and support of protected water (boreholes) and latrines; improving infant and young child feeding practices, which included promotion of exclusive breast-feeding and appropriate complementary feeding; dietary diversification such as small-animal revolving fund and home/communal gardens; prevention, control and treatment of parasitic infections (malaria, hookworms and schistosomiasis); as well as increasing nutrition knowledge and practices related to micronutrients and health. Such an integrated approach is believed to have contributed to the positive effect that was observed.
At the start of the programme, 60·2 % of children were stunted, of whom more than half were severely stunted. By the end of Phase I of the programme, the prevalence of stunting had significantly reduced to 50·6 % in MICAH areas, representing about a 16 % decrease. More importantly, there was a 34 % reduction in the prevalence of severe stunting during the same period. Without attributing the reductions to specific interventions, the results suggest that, as a composite strategy, the MICAH programme was effective in curbing the high prevalence of stunting which has been high and stagnant in Malawi for many years particularly in rural areas(6–8). It is apparent that the reduction in the prevalence of severe stunting was a major factor in the overall decline of stunting in both MICAH and Comparison areas.
The prevalence of stunting and severe stunting declined further in MICAH Phase II; however, there was no significant difference between MICAH and Comparison areas by the end of the programme. This owes to the fact that there was a dramatic reduction in the prevalence of stunting in Comparison areas in Phase II relative to Phase I. The low rate of reduction in MICAH areas in Phase II, which was also evident through a decline in the relative risk reduction from 10 % in Phase I to 5 % in Phase II (Table 4), is surprising because theoretically, the MICAH areas were expected to continue showing significant improvements over Comparison areas due to the programme interventions. Closer examination of the regional trends showed that the increased improvements in Comparison areas could be attributed to a 36 % reduction in the prevalence of stunting in the Southern region in Phase II, relative to a 20 % reduction in MICAH areas. This is the only region where the reduction in stunting in Comparison areas surpassed (by 1·8 times) that of MICAH areas. Attempts to control univariate analyses for region of residence and age of the children did not alter the results, suggesting that there are factors that may have influenced the change. One would argue that the improvements observed in the present study are a result of secular trends occurring in Malawi. However, the national prevalence of stunting remained static for 12 years as evidence by demographic and health surveys in 1992 (49 %)(6), 2000 (49 %)(7) and 2004 (48 %)(8). Therefore, it is unlikely that the reductions observed in the present study are merely secular trends.
It is important to note that the Comparison areas were not ideal with which to compare the impact of the MICAH programme. As indicated earlier, MICAH interventions were initially implemented in all surveyed areas following the baseline survey. However, on recommendations of a mid-term evaluation in July 1999, interventions were withdrawn from some areas in order to focus the full complement of the programme in fewer areas rather than fewer interventions in more areas (C MacDonald, personal communication, February 2007). During programme evaluation, such areas were sampled as convenient Comparison areas. We believe that the progress observed in the Comparison areas is a result of ‘contamination’ from the programme interventions.
The Northern region had the lowest prevalence of stunting among the three regions, while the Centre had the highest prevalence. Interestingly, the largest effect of the programme was in regions of high prevalence (i.e. the Centre and the South), while the North registered a smaller overall effect. A recent study also showed that disparities in stunting exist in three major agro-ecological zones that are in the North, Centre and South of the country. In their study, Kalimbira and colleagues observed in a cross-sectional study (n 598), that rural areas in Mzuzu Agricultural Development Division (ADD), which is in the North, had the lowest prevalence (46·6 %) of stunting compared to Lilongwe ADD in the Centre (53·3 %) and Blantyre ADD in the South (61·3 %) (χ 2 = 8·71, P = 0·01)(Reference Kalimbira, Chilima and Mtimuni19). The 2004 Malawi demographic and health survey also showed disparities in stunting across the regions(8). The present results are consistent with the previous findings, and go even further to show that such disparities are likely to remain for many years even after exposing the populations to apparently effective interventions. However, the present results also demonstrate a reduction in the disparity in stunting between regions (i.e. a greater improvement in the South and Centre in MICAH areas), indicating that it is possible, with effective programming, to reduce the disparities.
It is difficult to provide concrete reasons why the North consistently registers lower stunting rates among the three regions. However, we suspect that the North has several socio-economic advantages over other regions because it has a relatively smaller population and population density, lower fertility levels and higher literacy levels, among other factors(21). These advantages may have a profound intergenerational effect on nutrition and health, thereby positively contributing to the (relatively) low prevalence of stunting in the North.
As noted by Shadish and colleagues, internal validity can be threatened by regression artefacts, in which experimental units with extreme pre-test scores are likely to register an apparently larger effect than those with moderate or smaller scores(Reference Shadish, Cook and Campbell22). In the present case, it should not be overly surprising that because MICAH targeted some of the most disadvantaged communities in Malawi, the effect of the programme was large, an outcome which may not be realised in moderately disadvantaged populations. On the other hand, this could also be considered as the strength of the programme, in that it managed to contribute to a reduction in stunting among some of the most disadvantaged children in the country, who can be difficult to effectively reach.
A previous study has shown that at the macro-level, factors beyond nutrition such as changes in immunisation coverage, access to safe water, female literacy, government expenditure, income distribution, value added to agricultural produce and the baseline rate of stunting predict a decrease in stunting(Reference Milman, Frongillo, de Onis and Hwang23). Others have shown that severe stunting is associated with preterm birth (<37 gestational weeks), maternal short stature (<160 cm), maternal failure to gain >200 g/week during pregnancy, inappropriate complementary feeding practices, frequent illnesses such as diarrhoea, home delivery and paternal illiteracy(Reference Espo, Kulmala and Maleta3), which may also have influenced the present results.
Main strengths and limitations of the study
The MICAH programme was large-scale, reaching heterogeneous rural population groups in varying ecological zones, long-term and effective in nature. We are not aware of any other Malawian study with all of these attributes together. However, as indicated earlier, the Comparison areas did not adequately represent a true picture of rural populations that did not participate in the MICAH programme. The relatively lower prevalence of stunting in Comparison areas found in the present study may have been influenced by the first few years during which such areas received programme interventions. The present results can only be interpreted up to the time that the MICAH programme was phasing out. Since funding of some programme interventions, personnel and resources to the communities ceased in 2005, it would be important to assess whether or not the gains made during the programme were maintained in subsequent years.
Conclusions
The Malawi MICAH programme was associated with a reduction in the prevalence of stunting in children under the age of 5 years who lived in selected rural areas between 1996 and 2000 (Phase I), but not between 2000 and 2004 (Phase II). Given the length of implementation, wide-scale coverage and positive impact on child growth in Phase I, the Malawi MICAH programme could be a potential model for combating linear growth retardation in rural areas, although the catch-up improvement in Comparison areas during Phase II cannot be adequately explained.
Acknowledgements
Sources of funding: The MICAH programme was a joint programme of World Vision Canada and its partners in Africa, with funding from the Canadian International Development Agency and World Vision Canada. The data used in this analysis were provided by World Vision Canada. We acknowledge the programme manager who led the implementation of the field programme: Ms Rose H Namarika. The contributions of many other individuals and institutions that supported the implementation and evaluation of the MICAH programme are also gratefully acknowledged, especially the participating members of the MICAH communities. The government partners were Ministries of Health and Population (MOHP), Agriculture and Irrigation (MOAI), and the Community Health Sciences Unit (CHSU). Non-governmental partners included AFRICARE, Ekwendeni Mission Hospital, Emmanuel International, Domasi Community Nutrition Project, International Eye Foundation, Mua Mission Hospital, St Gabriel's Mission Hospital and World Vision Malawi. Conflict of interest: We declare no conflict of interest. Author contributions: A.A.K. (principal investigator) wrote a proposal for further examination of the project data, drafted an agreement between the University of Guelph and World Vision Canada, applied for ethics approval, received data sets from World Vision Canada, cleaned and merged the data sets, analysed the data and drafted the manuscript. J.R.S. proposed further examination of the project data, co-drafted an agreement between the University of Guelph and World Vision Canada, co-applied for ethics approval, supervised data cleaning and merging, supervised data analysis and edited the draft manuscript. C.M. co-designed the MICAH programme, supervised data cleaning and merging, supervised data analysis and edited the draft manuscript. At the time of writing the manuscript, the lead author was pursuing doctoral studies in Applied Human Nutrition at the University of Guelph in Canada under the Canadian Commonwealth Scholarship Programme.


