


The prevalence of childhood obesity has increased substantially worldwide and has become a public health problem, particularly over the past two decades( Reference Lobstein and McPherson 1 ). Alarming levels of obesity have been observed among children, with the prevalence of overweight and obesity varying significantly between different ethnic groups, sexes and socio-economic categories( Reference Lobstein and McPherson 1 ). This complex phenotype results from the interaction of multiple genetic and environmental factors that influence BMI, with an estimated heritability ranging from 40 to 70 %( Reference Zaitlen, Kraft and Patterson 2 ).
Common obesity has polygenic inheritance, and genome-wide association studies (GWAS) and gene candidate studies have detected several associations between SNP and common diseases, including obesity( Reference Steinsbekk, Belsky and Guzey 3 ). These association studies identify genetic risk for obesity, which influence the development of obesity and accelerate the weight gain in infancy( Reference Steinsbekk, Belsky and Guzey 3 ). GWAS in populations of European descent identified more than ninety-seven genetic loci associated with obesity that belong to different pathways, such as insulin secretion, adipogenesis, energy metabolism and central nervous system (CNS)( Reference Locke, Kahali and Berndt 4 ). Using this approach, two new candidate genes related to obesity were identified: transmembrane protein 18 (TMEM18) and the fat mass and obesity-associated (FTO) gene, suggesting that they are responsible for the regulation of body weight, in part, through their actions in the CNS and adipose tissue( Reference Edward, Stephen and Lynn 5 ). Through a gene candidate approach, another gene was recently discovered: fibronectin type III domain containing 5 (FNDC5)( Reference Boström, Wu and Jedrychowski 6 ) responsible for encoding the irisin protein, which can modulate lipid metabolism in adipose tissue, suggesting a possible role in energy homoeostasis( Reference Ge, Sathiakumar and Lua 7 ).
Despite great improvements in the discovery of new obesity-related genes, little is known about susceptibility when the additive effects of these genetic variants are considered, which are important components of the genetic architecture of obesity. This study examined three genes that play a role in the regulation of energy homoeostasis. FTO and TMEM18 genes were replicated in previous studies with children and adolescents( Reference Steinsbekk, Belsky and Guzey 3 , Reference Zandoná, Sangalli and Campagnolo 8 ), and FNDC5 may provide new insights into biological factors that contribute to the development of obesity( Reference Ge, Sathiakumar and Lua 7 ). Therefore, the study aims to investigate whether the genetic risk score (GRS) based on previously associated obesity SNP rs9939609 (FTO), rs6548238 (TMEM18) and rs16835198 (FNDC5) could serve as a predictor for anthropometric characteristics in a sample of Brazilian children and adolescents.
Methods
Sample
This cross-sectional study comprised 1471 children and adolescents aged 6–17 years, 56 % of whom were female. The students were invited to participate in the study through informed consent signed by parents or guardians. The study protocol was approved by the Research Ethics Committee of the University of Santa Cruz do Sul (UNISC) under number 714 216/14 and the Federal University of Health Sciences of Porto Alegre under number 995 205/15. The participants were consecutively recruited between March 2014 and December 2015 among students from the public and municipal network of Santa Cruz do Sul, Rio Grande do Sul, Brazil. The sample was selected by convenience and was included in the study of healthy subjects, who did not have restrictions for blood collections. The population from Southern Brazil is ethnic mixed( Reference Santos 9 ); thus, the ethnicity determination was made according to Parra et al. ( Reference Parra, Amado and Lambertucci 10 ), based on an evaluation of the following phenotypic characteristics: skin colour in the medial part of the arm; colour and texture of hair; and the shape of the nose and lips. In this sense, 75 % of the subjects were determined as European descendants.
Anthropometric measures
Body weight and height (coupled stadiometer) were measured using a Welmy balance (Welmy: 15416). BMI was defined by the following formula: BMI=weight/height2 (kg/m2). BMI Z-score was classified by World Health Organization( 11 ) according to sex and age, considering low/normal weight (<1sd), overweight (>1sd) and obesity (>2sd). Waist circumference (WC) was determined using inelastic tape, with reference to the narrowest part of the trunk between the ribs and the iliac crest and hip at the level of the greater trochanter. A normal WC was classified as percentile ≤80 and obesity as percentile >80, according to previously established criteria( Reference Fernández, Redden and Pietrobelli 12 ). The Lange® compass (Beta Technology Incorporated) was used to measure body fat percentage (BF%), using measurements of triceps and subscapular skinfolds. Subsequently, the equation of slaughter was applied and the data were classified according to the criteria established by Lonman’s date, as mentioned by Heyward & Stolarczyk( Reference Heyward and Stolarczyk 13 ), into two BF% categories: (1) very low, low and excellent and (2) moderately high, high and very high.
Biochemical analyses
Blood samples were collected by venepuncture after a 12-h fast. Total cholesterol (TC), HDL-cholesterol, TAG and glucose were measured using Kovalent commercial kits (BioSys Ltda) with a Miura One equipment (ISE). LDL-cholesterol was calculated using the Friedewald equation( Reference Friedewald, Levy and Fredrickson 14 ).
Genotyping
EDTA-anticoagulated whole blood was used for DNA extraction by the salting out method( Reference Miller, Dykes and Polesky 15 ). DNA was then quantified using a NanoDrop 2000c spectrophotometer unit (Thermo Scientific). The genotyping of polymorphisms TMEM18 rs6548238, FTO rs9939609 and FNDC5 rs16835198 was performed using Taqman™ allelic discrimination assays (Applied Biosystems) in StepOne Plus® equipment, according to the manufacturer’s instructions. TaqMan™ assays C__29311887_10 (rs6548238), C__30090620_10 (rs9939609) and C__34204885_10 (rs16835198) and Master Mix PCR Universal were purchased from Applied Biosystems.
Statistical analysis
The Kolmogorov–Smirnov test was used to verify the normality of the observed variables. Values expressed as the mean and standard deviation were used to describe continuous variables. Allele frequencies were estimated by gene counting. The allelic and genotype distribution between groups and Hardy–Weinberg equilibrium were tested using the χ 2 test. A risk score approach was used to evaluate the combined effects of SNP on anthropometric characteristics. The unweighted GRS was constructed using a genotypic score based on the number of unfavourable alleles (those associated with higher levels of BMI Z-score and WC) that were carried by each subject for each of the three SNP( Reference Kathiresan, Melander and Anevski 16 ). Risk alleles were those previously associated with obesity or obesity-related phenotypes in the literature and according to the data of the present study. For SNP rs6548238, rs9939609 and rs16835198, the C, A and T alleles were considered risk alleles, respectively. Weighted GRS (wGRS) was generated by weighting each allele using the natural log of the published OR reported in UK Biobank GWAS results (https://sites.google.com/broadinstitute.org/ukbbgwasresults/). Multiple linear regression analyses were used to adjust anthropometrics variables for age, sex and ethnicity. Mean adjusted variables were compared among genotypes and GRS (GRS and wGRS) by ANOVA. Multiple logistic regression analysis was carried out to estimate the OR with 95 % CI in order to assess genetic risk factors (genotypes, GRS and wGRS) for obesity parameters, as well as to control for confounding factors. A P-value <0·05 was considered statistically significant. Statistical analyses were performed using SPSS 23.0 for Windows.
Justification of sample size
The number of students needed to have a representative sample of the city was calculated using the total number of students enrolled using data provided by the sixth Regional Educational Coordinator of Rio Grande do Sul and the Municipal Department of Education of Santa Cruz do Sul. For this purpose, size was calculated using the Nea Research Division( Reference Christensen 17 ) formula, suggesting that for 20 450 students enrolled the sample should consist of at least 392 students with a 5 % error. The analysed sample (1471 subjects) has a statistical power above 90 % to detect an OR of 1·5, with a significance level of 5 % with 95 % for SNP with a minor allele frequency of at least 15 %.
Results
Descriptive characteristics of the subjects of this study are presented in Table 1, which comprises 76·5 % of adolescents and 56·2 % of female subjects, with a mean age of 11·9 (sd 2·8) years. According to the anthropometric characteristics, 23·0 % were overweight, 18·0 % were obese, 21·7 % had high WC and 35·4 % had high BF% moderately, high and very high.
Table 1 Descriptive characteristics of the subjects (n 1471) (Mean values and standard deviations; numbers and percentages)

WC, waist circumference; BF%, body fat percentage.
* Age range: children 7–9 years, adolescents 10–17 years.
† BMI Z-score: low/normal weight <1sd, overweight >1sd, obesity >2sd.
‡ WC: normal percentile ≤80 and high percentile >80.
The genotypic proportions were in Hardy–Weinberg equilibrium for the three polymorphisms. Frequencies of the minor alleles were 37 % for rs9939609/A (FTO), 14 % for rs6548238/T (TMEM18) and 35 % for rs16835198/T (FNDC5). A comparison of the BMI Z-score, WC, BF% and metabolic parameters among genotypes is shown in Table 2. FTO rs9939609 was associated with higher BMI Z-score (P=0·005), WC (P=0·035) and TAG (P=0·007), whereas TMEM18 rs6548238 was associated with BMI Z-score (P=0·008), WC (P=0·009) and BF% (P=0·024). For the rs16835198 at FNDC5 gene, homozygotes TT presented a higher BMI Z-score (P=0·005) and WC (P=0·009).
Table 2 Association between each SNP of fat mass and obesity-associated (FTO), transmembrane protein 18 (TMEM18) and fibronectin type III domain containing 5 (FNDC5) genes with anthropometric characteristics and metabolic parameters* (Mean values and standard deviations)

WC, waist circumference (percentile); BF%, body fat percentage; TC, total cholesterol.
* ANOVA, adjusted by sex, age and ethnicity.
Table 3 shows the means of BMI Z-score, WC and BF% in relation to GRS groups. The means of BMI Z-score and WC were found to be higher as the number of risk alleles increased (P=0·015, P<0·001, respectively). Although a greater tendency of the means of BF% in relation to the GRS groups was observed, this association was not significant.
Table 3 Anthropometric characteristics according unweighted and weighted genetic risk score of the three SNP in fat mass and obesity-associated (FTO), transmembrane protein 18 (TMEM18) and fibronectin type III domain containing 5 (FNDC5) genes with anthropometric characteristics and metabolic parameters (Mean values and standard deviations)

WC, waist circumference; BF%, body fat percentage; GRS, genetic risk score; wGRS, weight genetic risk score.
* Association analysis adjusted by sex, age and ethnicity.
† GRS: no risk allele, 01 – one risk allele, 02 – two risk alleles, 03 – three risk alleles, 04 – four risk alleles, 05 – five risk alleles and 06 – six risk alleles.
‡ Weighted value: number of alleles risk multiplied by the natural log of the published OR.
Fig. 1(a) and (b) show the associations of WC categories (normal percentile ≤80 and high percentile >80) and BMI Z-score (low weight/normal: <1sd; overweight: >1sd; obesity: >2sd) with GRS. We observed that as the number of risk alleles increased, the percentage of individuals with altered WC (P=0·001) and with obesity (P=0·017) also increased. Among individuals with no risk alleles, none presented altered WC, whereas among those with six risk alleles, 44 % presented WC percentile >80 (Fig. 1(a)). Regarding BMI Z-score, 17 % of individuals without risk alleles presented BMI Z-score in the overweight range and none was obese. For those with six risk alleles, 24 % were overweight and 40 % were obese (Fig. 1(b)). Association effects of the GRS and wGRS were tested for obesity (BMI Z-score >2sd) and altered WC (percentile >80). The higher score of wGRS was associated with obesity (OR: 2·65, 95 % CI 1·40, 5·04, P=0·003) and with greater WC (OR: 2·91, 95 % CI 1·57, 5·40, P=0·001) (Table 4).
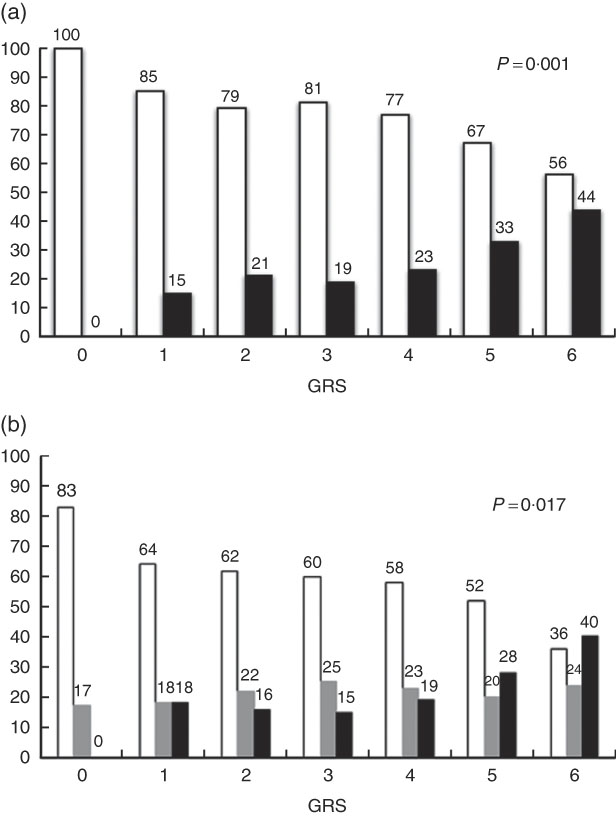
Fig. 1 (a) Association of categories of waist circumference (WC) with genetic risk score (GRS). ![]() , WC percentile <80;
, WC percentile <80; ![]() , WC percentile ≥80. (b) Association of BMI Z-score categories with GRS. Z-score: low/normal weight, <1sd (
, WC percentile ≥80. (b) Association of BMI Z-score categories with GRS. Z-score: low/normal weight, <1sd (![]() ); overweight, >1sd (
); overweight, >1sd (![]() ); obesity, >2sd (
); obesity, >2sd (![]() ). GRS: 0, no risk allele; 1, one risk allele; 2, two risk alleles; 3, three risk alleles; 4, four risk alleles; 5, five risk alleles; 6, six risk alleles.
). GRS: 0, no risk allele; 1, one risk allele; 2, two risk alleles; 3, three risk alleles; 4, four risk alleles; 5, five risk alleles; 6, six risk alleles.
Table 4 Multiple logistic regression for obesity (BMI Z-score >2sd) and for high waist circumference (WC percentile >80) according unweighted genetic risk score (GRS) and weighted genetic risk score (wGRS) of the three SNP in fat mass and obesity-associated (FTO), transmembrane protein 18 (TMEM18) and fibronectin type III domain containing 5 (FNDC5) genes* (Odds ratios and 95 % confidence intervals)

* OR adjusted for sex, age and ethnicity.
† GRS: 0–1 no risk allele or one risk allele, 02 – two risk alleles, 03 – three risk alleles, 04 – four risk alleles, 05 – five risk alleles, 06 – six risk alleles.
Discussion
The objective of this study was to investigate whether there is an additive effect of SNP rs9939609 (FTO), rs6548238 (TMEM18) and rs16835198 (FNDC5) on anthropometric characteristics in Brazilian children and adolescents. The comparison between the anthropometric variables evaluated among genotypes of each SNP replicated the significant associations that have already been observed in other studies on obesity, mainly WC and BMI. The main finding of this study is the cumulative risk effect for obesity and altered WC according to the GRS created to evaluate the combined effects of the three SNP. The BF% showed no association with the GRS; supposedly other genes are associated with this adiposity variable.
Our data show that the allelic frequencies found are similar to previous studies( Reference Zandoná, Sangalli and Campagnolo 8 , Reference Reuter, Burgos and Bernhard 18 , Reference Staiger, Böhm and Scheler 19 ). Minor allelic frequencies of rs9939609/A (FTO) and rs6548238/T (TMEM18) were 35 and 15 %, respectively, in other studies with Brazilian population( Reference Zandoná, Sangalli and Campagnolo 8 , Reference Reuter, Burgos and Bernhard 18 ). The rs16835198/T allele (FNDC5) has not yet been genotyped in Brazilian populations, but a study with European offspring shows a frequency of 35 % for the minor allele( Reference Staiger, Böhm and Scheler 19 ), confirming the same value found in our study.
Variants of the FTO and TMEM18 genes were initially associated with obesity in adults( Reference Frayling, Timpson and Weedon 20 , Reference Hotta, Nakamura and Nakamura 21 ); the FNDC5 gene variant appears to influence glycolipid metabolism in overweight/obese adult subjects( Reference Tang, Zhang and Jiang 22 ). In addition, researchers have recently investigated the effect of these variants on the risk of obesity as early as childhood and adolescence( Reference Steinsbekk, Belsky and Guzey 3 , Reference Zandoná, Sangalli and Campagnolo 8 ). Early obesity, particularly in children, is highly predictive of obesity in adulthood, especially when one (or both) of the parents is obese( Reference Whitaker, Wright and Pepe 23 ). This early obesity is one of the determinants of cardiometabolic risk in adulthood( Reference Estampador and Franks 24 ).
The FTO gene is involved in the stimulation of food intake and is highly expressed in the human hypothalamus, pituitary gland and adrenal glands, suggesting a potential role in the hypothalamic–pituitary–adrenal axis and implying the regulation of body weight. Several potentially functional SNP at the FTO locus are highly associated with the early onset of obesity and severe obesity in European populations( Reference Dina, Meyre and Gallina 25 ). The most studied SNP of this gene, rs9939609, was evaluated in this study and was consistently associated with higher values of BMI Z-score, WC and TAG (P<0·05) in children and adolescents. Other studies performed with this same age group and populations of European and Asian and Amerindian origin also show an association of this SNP rs9939609 with higher means of BMI Z-score, WC and TAG (P<0·05)( Reference Frayling, Timpson and Weedon 20 , Reference Liu, Mou and Cai 26 , Reference Freathy, Timpson and Lawlor 27 ).
The TMEM18 gene is expressed or known to act on the CNS, although it also exhibits peripheral functions related to adipose tissue( Reference Willer, Speliotes and Loos 28 ). To better understand the relation of this gene to obesity, this study examined the relationship between variant rs6548238 and anthropometric characteristics. We observed that C allele carriers presented higher BMI Z-score, WC and BF% values (P<0·05). Other studies involving children and adolescents have also shown an association of this variant with BMI Z-score, WC and BF% in populations of Mexican( Reference León-Mimila, Villamil-Ramírez and Villalobos-Comparán 29 ), European( Reference Almén, Jacobsson and Shaik 30 ) and New Zealand origin( Reference Krishnan, Thompson and Mitchell 31 ).
Since its discovery in 2012, the irisin protein encoded by the FNDC5 gene has attracted interest as a potential health mediator, promoting effects on physical exercise. It is considered to be a novel hormone-like myokine released by skeletal muscle during exercise to improve obesity and glucose dysfunction, stimulating the darkening of white adipose tissue( Reference Boström, Wu and Jedrychowski 6 ). Evidence indicates that irisin is expressed robustly, not only in skeletal muscle( Reference Boström, Wu and Jedrychowski 6 ) but also in various regions of brain tissue( Reference Dun, Lyu and Chen 32 ). To the best of our knowledge, there is only one study with adults and a population of Chinese origin that associated the rs16835198 SNP of the FNDC5 gene with glycolipid metabolism in overweight/obese subjects( Reference Tang, Zhang and Jiang 22 ). However, this study is the first to observe the relationship of this SNP with higher means of BMI Z-score and WC (P<0·005) in children and adolescents.
Although GWAS have identified a significant number of SNP associated with many complex human characteristics, the susceptibility loci identified to date may account for only a small fraction of the genetic risk( Reference Zhu, Tong and Zhu 33 ). Although several factors such as rare genetic variants, structural variations, epigenetic modifications and gene–environment interactions may contribute to ‘missing heritability’( Reference Eichler, Flint and Gibson 34 ), the additive effect of several SNP has been poorly explored and becomes an important component of multifactorial genetic diseases owing to the complexity of biological systems( Reference Cordell 35 ). In this sense, numerous studies have already evaluated the SNP studied in this research with obesity, but very few studies have evaluated the simultaneous effect of the presence of the risk alleles of each SNP.
Thus, it was observed in this study that the additive effect among the studied SNP was higher as the number of risk alleles of individuals with altered WC (P<0·001) and with obesity increased (P=0·015). In addition, our data showed that subjects with higher GRS are associated with higher risk of obesity and altered WC (Table 4). The association was significant both for unweighted GRS and wGRS. To date, only four studies on additive effects have shown an association of obesity and the rs9939609 SNP of the FTO gene, one study has shown an association with the variant rs6548238 of the TMEM18 gene and no study has uncovered an association with the variant rs16835198 of the FNDC5 gene.
A study with children and adolescents of European origin tested the combination of ACE (rs4646994), FTO (rs9939609), MC4R (rs17782313) and PPARG (rs1801282) SNP with obesity, showing influence of MC4R and PPARG with higher BMI( Reference Bordoni, Marchegiani and Piangerelli 36 ). Another study with an adult population of Indian origin evaluated fifty-five SNP in twenty-eight genes. However, the SNP FTO (rs9939609), iroquois homeobox 3 (IRX3) (rs3751723), transcription factor 7 like 2 (TCF7L2) (rs7903146) and TMEM18 (rs6548238) were observed to be the main SNP that contribute to the risk of obesity linked to BMI( Reference Srivastava, Mittal and Prakash 37 ). A study of Indian adults tested the additive effect of SNP FTO (rs8050136, rs1421085, rs9939609, rs17817449) and IRX3 (rs3751723) and observed the association of these genes with the risk for obesity( Reference Srivastava, Mittal and Prakash 38 ). Finally, a study of Chinese adults tested the additive effect among eleven variants of the FTO gene (among them rs9939609), TSPAN8 and TCF7L2, and they were associated with type 2 diabetes mellitus and obesity( Reference Zhu, Tong and Zhu 33 ).
Although FTO and TMEM18 SNP were associated with obesity in many studies( Reference Locke, Kahali and Berndt 4 , Reference Zandoná, Sangalli and Campagnolo 8 , Reference Frayling, Timpson and Weedon 20 , Reference Almén, Jacobsson and Shaik 30 , Reference Krishnan, Thompson and Mitchell 31 ), some researchers found no association of the rs6548238 (TMEM18)( Reference García-Solís, Reyes-Bastidas and Flores 39 ) and rs16835198 (FNDC5)( Reference Tanisawa, Taniguchi and Sun 40 ) variants with adiposity parameters. To the best of our knowledge, this is the first study to test the variant rs16835198 of the FNDC5 gene in obese children and adolescents and to analyse its cumulative effect with other SNP. It is also the first study to analyse the cumulative effect of these three SNP in a sample composed of Brazilian children and adolescents. However, there were some limitations. Of all Brazilian regions, European immigrants predominantly populate the southern region. According to Parra et al. ( Reference Parra, Amado and Lambertucci 10 ), in Brazil the colour determined by the physical evaluation is a weak predictor of genomic ancestry. This factor may limit this study, as the ancestry was self-declared and may not reflect the real ancestry of the research subjects. Sample size is representative of this population, although some studies use larger sample size in this type of study. Further, sufficient statistical power was allowed for our analyses, and these data can be incorporated into future meta-analyses.
In conclusion, three SNP analysed of the genes FTO, TMEM18 and FNDC5 were found to be associated with the susceptibility of developing greater BMI Z-score and WC in a sample composed of Brazilian children and adolescents. These findings are consistent with other studies that consistently associate these genes with obesity. Together with our results, these data corroborate the idea that the cumulative effect may be useful to understand the genetic component of obesity. The results of this study also suggest that this method may be an option for future studies, mainly in order to find the missing heritability.
Acknowledgements
The authors thank all volunteers who participated in this study, and the Biotechnology and Genetics Laboratory of UNISC. The authors also thank with great affection the collaborator Miria S. Burgos (in memory).
This research was supported by the Brazilian Agencies Foundation for Research Support of Rio Grande do Sul (FAPERGS), the National Counsel of Technological and Scientific Development (CNPq) and Coordination of Improvement of Higher Level Personnel (CAPES).
P. F. T. was involved in data collection, data analyses, data interpretation and manuscript writing. E. I. K., A. C. R. G. and L. B. contributed to data collection and genotyping. C. P. R. and A. R. M. V. contributed to study design, data interpretation and manuscript writing. J. D. R. L. and M. F. contributed to study design, data analyses, data interpretation and manuscript writing. All authors contributed to the revision of the manuscript and approved the final manuscript.
The authors declare that there are no conflicts of interest.


