


Evidence has shown that having high muscle strength from a young age is essential to preventing CVD at a later stage of life(Reference Agostinis-Sobrinho, García-Hermoso and Ramírez-Vélez1,Reference Peterson, Gordon and Smeding2) . Furthermore, longitudinal studies have suggested that poor muscle strength in adolescence persists into adulthood(Reference Trudeau, Shephard and Arsenault3) and is associated with CVD during adulthood(Reference Fraser, Schmidt and Huynh4,Reference Lindgren, Åberg and Schaufelberger5) . A cross-sectional study by Silva et al.(Reference Silva, Pelegrini and Chula de Castro6) showed that the prevalence of poor muscle strength among adolescent was as high as 47 %. What is more alarming was the declining trend observed over a 10-year period(Reference Cohen, Voss and Taylor7–Reference Silverman9). Thus, having a healthy lifestyle (good nutrition and physically active) plays a crucial role in promoting muscle strength(Reference Wolfe10) and ultimately cardiovascular health in the long term.
Most of these cohort studies have looked into physical activity, diet and muscle strength as predictors and CVD risks and/or obesity as the outcome measurements(Reference Martinez-Gomez, Eisenmann and Gomez-Martinez11–Reference Abreu, Santos and Moreira13). Only a handful of studies evaluated the effects of dietary intake or physical activity on muscle strength in a population-based study. Furthermore, the associations among these factors were often analysed cross-sectionally. Some dietary studies have shown beneficial effects of the Mediterranean diet(Reference Evaristo, Moreira and Lopes14), while others have shown no effects of single nutrient(Reference Gracia-Marco, Bel-Serrat and Cuenca-Garcia15) or food groups(Reference Saeedi, Black and Haszard16) on muscle strength. While a population-based cohort study had concluded lower physical activity is associated with lower hand grip strength (HGS) for both sexes(Reference Otero, Cohen and Herrera17). On the contrary, another study found that low physical activity is associated with lower HGS among females, but not males(Reference Silva, Pelegrini and Chula de Castro6). It was postulated that males tend to practice sports that require more strength and movements from the lower limbs, such as soccer and running, as compared with females who tend to perform activities that require upper limbs more, such as volleyball and handball(Reference Silva, Pelegrini and Chula de Castro6).
To date, there is increasing evidence from adolescent cohort studies in regard to the association of poor muscle strength with CVD in the past two decades(Reference Agostinis-Sobrinho, García-Hermoso and Ramírez-Vélez1,Reference Peterson, Gordon and Smeding2,Reference Peterson, Zhang and Saltarelli18,Reference Ramírez-Vélez, Tordecilla-Sanders and Correa-Bautista19) . Studies have tracked poor muscle strength from adolescence until adulthood and the factors affecting muscle strength(Reference Trudeau, Shephard and Arsenault3,Reference Fraser, Schmidt and Huynh4) . Studies conducted in Western countries related to this field are scarce, and to the best of our knowledge, no such similar studies are available from the Asian region. This paper aims to evaluate the longitudinal association between dietary intake, physical activity scores and muscle strength among adolescents over a 5-year period.
Subjects and methods
Study design and area
This was a 5-year closed cohort study of secondary school students. Baseline (W0) assessment was carried out from March 2012 to May 2012. The first follow-up (W1) assessment in 2014 and the second follow-up (W2) assessment which took place in 2016 were also performed during the months of March to May of the respective years. This study covers three selected states in Peninsular Malaysia, namely, Kuala Lumpur, Selangor and Perak. This study employed a multistage sampling design as described in the main Malaysian Health and Adolescents Longitudinal Research Team Study protocol(Reference Majid, Su and Jalaludin20).
Study population
The sampling frame consisted of all secondary school students within Kuala Lumpur, Selangor and Perak. The participants were recruited at the age of 13 years (in 2012) and were re-assessed at the age of 15 and 17 years. The baseline exposure data (dietary intake and physical activity scores), the sociodemographic and anthropometric data and the outcome of interest (muscle strength) of the participants who participated in 2012 were used. All participants were then followed up in 2014 (first follow-up) and subsequently in 2016 (second follow-up) to record the above exposure data and outcome of interest. The participants were tracked using their identification number, and no additional participants were added during the follow-up period.
In this study, participants with a specific health condition such as primary muscular diseases or disorder were excluded from the recruitment. In addition, participants with tendinitis, current injuries or deterioration of mobility due to previous injury or accident in at least one of the arms or hands and fracture in the upper limbs in the previous 6 months were also excluded from this study.
In total, ten schools participated in 2012 (baseline) with a total of 1014 students eligible for recruitment. However, eight students were excluded because they did not take part in the HGS assessment, while thirteen were excluded for not completing the 7-d diet history booklet. Finally, a total of 923 students had been recruited for baseline and follow-up for a 5-year period. Subsequently, some students were lost during the first and second follow-ups: 304 (33 %) and 182 (29 %) in the first and second follow-ups, respectively. Thus, the number of students included for analysis was only 437. Fig. 1 explains the sampling flow for this study.
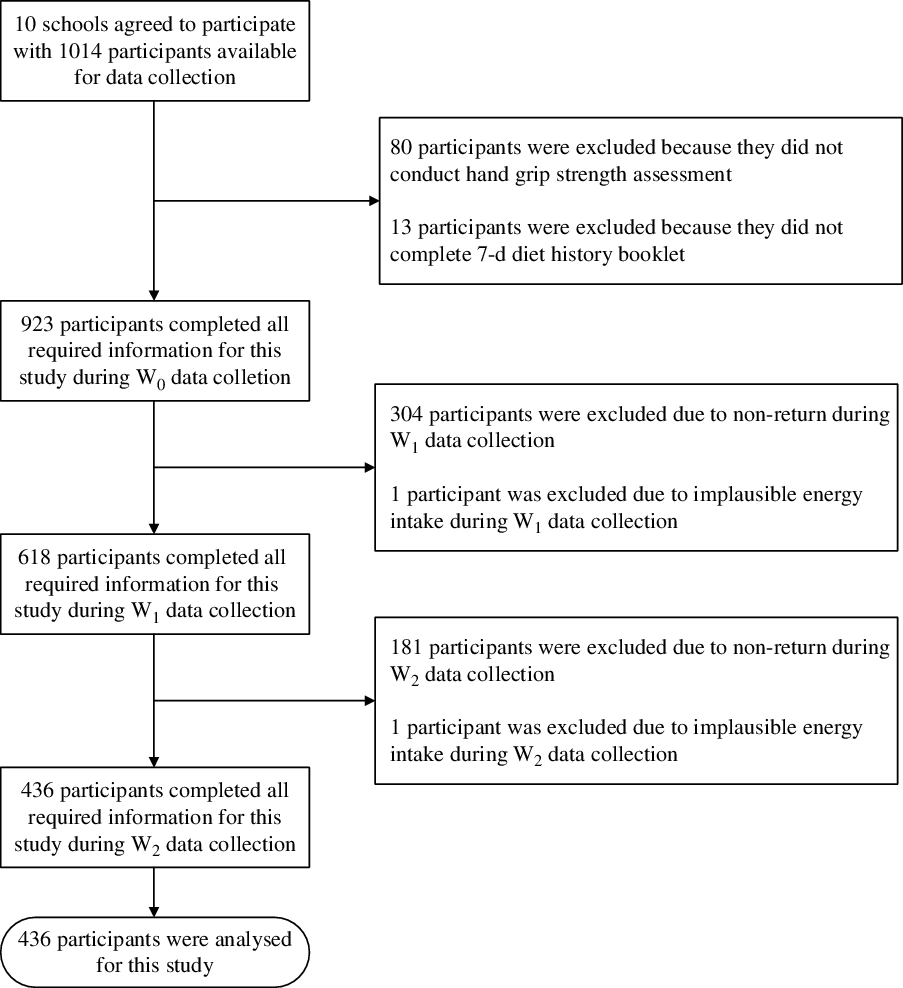
Fig. 1. Sampling flow for this study.
In this study, early adolescence refers to 13-year-old adolescents, middle adolescence refers to 15-year-old adolescents and late adolescence refers to 17-year-old adolescents.
Muscle strength
The primary outcome of this paper is muscle strength. HGS was used as a proxy measurement for muscle strength in adolescents. A strong correlation (r 0·736–0·890) and strong reliability (r > 0·8) have been found between HGS and total muscle strength among adolescents(Reference Wind, Takken and Helders21). HGS, when measured using a calibrated Jamar dynamometer (Jamar; Sammons Preston Rolyan), has been shown to have good to excellent test–retest reproducibility (r > 0·80) and excellent inter-rater reliability (r 0·98)(Reference Roberts, Denison and Martin22).
Prior to the measurement, the hand dynamometer was adjusted for different hand sizes. The participant was asked to stand with his/her shoulder adducted and neutrally rotated, elbow in full extension, forearm in a neutral position and wrist between 0 and 30° in dorsal flexion (handshake position). Measurement began with dominant hand followed by non-dominant hand. Both hands were measured three times each, and the readings were recorded to the nearest 0·1 kg. The averages of the measurements of dominant hand were used in the analysis(Reference Majid23). Literature has shown that muscle strength should be expressed in both (i) absolute form (kg) and (ii) relative to body weight (kg/kg body weight)(Reference Blakeley, Van Rompay and Schultz24). The reason for expressing muscle strength relative to body weight (normalised form) is because it is associated with body dimension(Reference Peterson, Zhang and Saltarelli18,Reference Ramírez-Vélez, Tordecilla-Sanders and Correa-Bautista19) .
Dietary intake
A 7-d diet history of repeated 24-h dietary recall for the past 7 d consecutively was employed to assess dietary intake among adolescents. It was found to be the most preferred and commonly used method for epidemiological studies(Reference Freedman, Midthune and Arab25). It is appropriate since adolescents can recall better than adults(Reference Burrows, Martin and Collins26). The participants were interviewed by trained dietitians. Open-ended questions were used to obtain information on daily food and drinks that participants consumed for breakfast, mid-morning snack, lunch, afternoon tea, dinner and supper over the 7-d period (five weekdays and a weekend). Flip chart containing local food as a visual tool was used to assist the participants in estimating the portion size of the foods that they consumed for past 7 d. The food and drinks consumed by participants were then documented into a 7-d diet history booklet. The total energy intake, intakes of carbohydrate (g), protein (g), fat (g) and Ca (mg) were analysed using the Nutrient Composition of Malaysian Food (4th edition)(Reference Tee, Noor and Azudin27) via the Nutritionist Pro database (Axxya Systems). An average intake of 7 d of total energy, protein, carbohydrate, fat and Ca were obtained using Nutritionist ProTM Diet Analysis software (Axxya Systems). Thereafter, the calculated average daily intake of energy and nutrient intakes were extracted using the Nutritionist ProTM Extraction Tool (Axxya Systems). Subsequently, data cleaning was performed, which involved checking the consistency, errors and correctness of the data entered and implausible energy intake. Two participants with implausible energy intake (>20 920 kJ/d (>5000 kcal/d))(Reference Berkey, Rockett and Field28) were removed from the dietary dataset.
Dietary data management
The process of data monitoring for all three points of data collection was completed by the Malaysian Health and Adolescents Longitudinal Research Team Study study core team members (dietitian and paediatrician) to ensure the completeness and quality of the data collected prior to the dietary data analysis. The process of dietary analysis started with summarising the raw dietary data into a diet summary list and coding each of the food items consumed into Microsoft Word. Ten per cent of the diet summary list was randomly cross-checked by a pair of qualified dietitians to ensure standardisation of the amounts used and to reduce errors in data entry. The percentages of data entry errors were all below 10 %, which was considered an acceptable margin of error(Reference Day, Fayers and Harvey29). This list included information on the meal of the day, mealtime, type of the food and drink, portion size (household unit, unit in grams for food and unit in millilitres for drink) and food code. The source of the food code was from the Nutrient Composition of Malaysian Food (4th edition)(Reference Tee, Noor and Azudin27). New codes were created for food or recipes that could not be found in the Nutrient Composition of Malaysian Food. New food items were added based on the food packaging, and new recipes were entered based on the standard recipe (per serving size) into Nutritionist ProTM Diet Analysis software (Axxya Systems). Dietary data were analysed. Ten per cent of the analysed dietary data was checked by independent research dietitians who were not involved in analysing the dietary data. This was done to ensure the quality of data entry. The data entry error was within the acceptable margin of error(Reference Day, Fayers and Harvey29). Thereafter, the analysed dietary data were extracted using the Nutritionist ProTM Extraction Tool (Axxya Systems).
Physical activity questionnaire for older children
The physical activity questionnaire for older children (PAQ-C) is reliable and valid with good internal consistency(Reference Kowalski, Crocker and Faulkner30,Reference Zaki, Sahril and Omar31) . Similarly, the Healthy Lifestyle in Europe by Nutrition in Adolescence study has shown that the PAQ-C has modest comparability with accelerometer data in assessing physical activity among European adolescents(Reference Ottevaere, Huybrechts and De Bourdeaudhuij32). As reported by Zaki et al.(Reference Zaki, Sahril and Omar31), the reliability of the Malay version of PAQ-C was determined using the Cronbach’s α coefficient and the intra-class correlation coefficient. The criterion validity of the PAC-Q (M) was assessed by comparing it with the 3-D Physical Activity Recall tool, and the result was found to be acceptable (r 0·60, P < 0·01)(Reference Zaki, Sahril and Omar31). There is a total of ten items in PAQ-C. The first item assesses the type and frequency of sports and/or dance the adolescents performed over the past 7 d. The second to eighth items assess the activity of the adolescents during physical education classes, recess, and lunchtime, right after school, in the evenings, on weekends and during leisure time. The ninth item assesses the previous week’s physical activity frequency. The tenth item is used to report any unusual activities during the previous week.
Sociodemographic measures
Information on sex, date of birth and ethnicity were captured using a questionnaire. Another questionnaire was given to students’ parents to collect birth weight (in kg) and parents’ socioeconomic status. Socio-economic status was captured as categorical data.
Pubertal stages
The self-reported Tanner pubertal questionnaire was used for data collection. In a school-based study, this method of self-reported questionnaire has been found to be reliable(Reference Jaruratanasirikul, Kreetapirom and Tassanakijpanich33). The rating for males is based on development of external genitalia and pubic hair and for females is based on development of breasts and pubic hair. A numerical scale of 1–5 is used for the different stages of pubertal development (i.e. stage 1–stage 5).
Anthropometric measures
All equipment were calibrated before the measurements were performed. Body weight was measured using a digital electronic weighing scale (Seca 813; Seca) and recorded to the nearest 0·1 kg. Height was measured with a calibrated vertical stadiometer (Seca Portable 217; Seca) and recorded to the nearest 0·1 cm. BMI was calculated as weight in kg divided by the square of height in metres. BMI was furthered categorised based on International Obesity Task Force cut-off points (overweight: 21·91 kg/m2 for males and 22·58 kg/m2 for females; obesity: 26·84 kg/m2 for males and 27·76 kg/m2 for females)(Reference Cole, Bellizzi and Flegal34). Waist circumference (midpoint between the lowest rib margin and the iliac crest) was measured with a non-elastic measuring tape (Seca 201; Seca) and recorded to the nearest 0·1 cm. Percentage of body fat was measured with a bioelectric impedance analyser (SC-240 Body Composition Analyser; Tanita Europe BV, Amsterdam, The Netherlands). Prior to the measurement, age, sex and height were entered into the SC-240 Body Composition analyser. The percentage of body fat was determined based on the body impedance when a subthreshold electrical current (frequency of 50–60 kHz) passes through the body. The length of hand span was measured using with a non-elastic measuring tape (Seca 201; Seca) and recorded to the nearest 0·1 cm. Measurement was taken from the tip of the thumb to the tip of the small finger with the hand opened as wide as possible. Both hands (left and right) were measured, and the readings were recorded.
Assessment of physical fitness level
The assessment of physical fitness level was based on modified Harvard Step Test protocol, which utilise 30 cm height of step box instead of 50 cm. This protocol was successfully used in previous local studies(Reference Tee, Gan and Tan35,Reference Hanifah, Majid and Jalaludin36) . The assessment was undertaken by the assigned research assistants. Prior to the measurement of physical fitness level, the finger pulse oximeter was attached to one of the participant’s fingers. The participant was asked to step onto and off a stool (30 cm in height) with both feet alternating for 5 min. Peak heart rate and peripheral capillary oxygen saturation (SpO2) during each minute of exercise were recorded. Heart rate and SpO2 at 0·1 and 2 min post-exercise were recorded. Total exercise duration was recorded in seconds. Physical fitness score was calculated by dividing the total duration of exercise in seconds by the sum of three heart rate values measured at 0, 1 and 2 min post-exercise(Reference Hanifah, Majid and Jalaludin36,Reference Treviño, Fogt and Wyatt37) .
Serum vitamin D level
After an overnight fast of at least 10 h prior to data collection, venous blood samples were collected by a trained phlebotomist. Electrochemiluminescence immunoassay (ECLIA by Advia Centaur XP) on a Cobas E 411 analyser was used to determine serum 25-hydroxyvitamin D (25(OH)D) concentration. A detailed description of the analysis of serum vitamin was published(Reference Al-Sadat, Majid and Sim38).
Ethics
Ethical approval was obtained from the Medical Ethics Committee, University Malaya Medical Centre (MEC reference no. 896.34). The National Medical Research Register number is 14-376-20486. Participation in the study was voluntary. Written informed consent and assent for participation in the study were obtained from the parents or guardian as well as the participants.
Statistical analysis
For the descriptive statistics, continuous data were reported in means and 95 % CI, while categorical data were reported in frequencies and percentages. Line graphs were drawn to describe the trend in muscle strength in absolute form and relative to body weight (normalised HGS), dietary intakes (energy, protein, carbohydrate, fat and Ca) and physical activity.
In this study, muscle strength, which was measured by HGS, was the primary outcome of interest. Meanwhile, dietary intake and physical activity were the main predictors investigated in this study. Given the potential confounding effect of energy intake, it is impossible to enter all macronutrients and energy intake simultaneously in the multiple linear regression. Therefore, the macronutrients (protein, carbohydrate and fat) were adjusted accordingly. Protein was expressed in g/kg of body weight to reflect better intake and facilitate a more meaningful discussion. Carbohydrate and fat were adjusted using the nutrient density method and were expressed as a percentage of total energy intake(Reference Willett39).
The generalised estimating equation (GEE) was used to investigate the effect of the longitudinal relationship between dietary intake and physical activity on muscle strength changes over the 5-year period. GEE is appropriate for continuous response variables and repeat measures(Reference Twisk40). In this study, both outcome (HGS) and predictors (dietary intake and physical activity) were in continuous form. In GEE, correlation matrix can have different structures which can affect the GEE results. Therefore, five types of working correlation matrix (these are independent, first-order autoregressive, exchangeable, m-dependent and unstructured) were computed, and unstructured model with the lowest quasilikelihood under the independence model criterion (QIC) was chosen in the GEE analysis(Reference Hwang and Takane41). Potential variables were included in the analysis. For continuous variables, these include birth weight(Reference Bielemann, Gigante and Horta42), serum vitamin D(Reference Foo, Zhang and Zhu43,Reference Geiker, Hansen and Jakobsen44) , length of hand span(Reference Sirajudeen, Shah and Pillai45,Reference Shah, Sirajudeen and Somasekaran46) , physical fitness score(Reference Artero, Ruiz and Ortega47) and BMI(Reference Silva, Pelegrini and Chula de Castro6), and categorical variables include ethnicity(Reference Moy, Darus and Hairi48), sexual maturation(Reference Koley and Khanna49,Reference Little50) and monthly household income(Reference Otero, Cohen and Herrera17,Reference Sandercock, Lobelo and Correa-Bautista51) were included into GEE model. The fact that these variables are associated with muscle strength cannot be ignored and often it was adjusted in the previous studies. Therefore, these variables should be considered in muscle strength studies among adolescents.
All the statistical analyses were performed using Statistical Package for Social Sciences (SPSS) software for Windows (version 24.0) with P < 0·05 regarded as statistically significant.
Missing data
In this study, imputation was not done for muscle strength because this is the outcome variable of this study. However, imputation was done for other predictor variables when Little’s missing completely at random test showed that the data were not missing completely at random. Therefore, the missing data were subsequently addressed by multiple imputation.
In multiple imputation model, all variables that are in the analysis model (outcome, exposure and confounders) were included. From there, five separate data sets were generated from which pooled estimates were taken. The variables involved in multiple imputation are HGS, dietary intakes, PAQ scores, the place of residence, ethnicity, income, sexual maturation, length of hand span (cm), weight (kg), height (cm), waist circumference (cm), percentage body fat (%), serum vitamin D level (nmol/l), physical fitness score and birth weight (kg).
Results
In this study, at baseline, a total of 923 students had complete data and two had been excluded due to an implausible energy intake of more than 20 920 kJ/d (5000 kcal/d)(Reference Berkey, Rockett and Field28), one each at first (W1) and second follow-up (W2), respectively. However, there were 618 students returned at first follow-up (W1) and 436 at second follow-up (W2). Hence, the overall follow-up rate at the fifth year was 47 %. This follow-up rate is similar to most adolescent cohort studies, which have been found to range between 40 and 51 %(Reference Biazzi Leal, Altenburg de Assis and Hinnig52,Reference Gopinath, Flood and Burlutsky53) . The main reason for the loss to follow-up in this study was either the participant’s or parents/guardians’ refusal to give consent for participation. In summary, a total of 436 participants had participated in all three waves with complete information. The independent t test was conducted to ascertain whether there were significant differences between the returned (attended all three data collections) v. non-returned (only attended baseline data collection) participants. The key variables of interest collected in 2012 were used for comparison between returned and non-returned participants. There were no differences in terms of weight, height, percentage body fat, waist circumference, hand span, HGS, energy intake and macronutrient intakes between the returned and non-returned groups, either among males or females.
Baseline characteristics of participants
Table 1 provides the baseline characteristics of the students who participated in this study when they were 13 years. The majority were female (302 students, 70 %) and 134 (30 %) were male. Among them were Malay (68 %), followed by Indian (28 %), Chinese (2 %) and other ethnicities (2 %). The majority of the participants were residing in a rural area (69 %). Most were from low- to middle-income groups with an income of less than RM3000 per month (RM5·50 equivalent to 1 GBP) based on the definition by Department of Statistics Malaysia(54). Most of them were right-hand dominant (86 % for males and 94 % for females). During baseline data collection, 43 % (43·3) males and 28 % (27·3) females had yet to reach mid-pubertal stage.
Table 1. Characteristics of the students at baseline
(Mean values and 95 % confidence intervals; numbers and percentages)

RM, Ringgit Malaysia; HGS, hand grip strength.
Trends in muscle strength, dietary intake and physical activity
We observed significant changes in muscle strength over a 5-year period for males and females. The magnitude of increment in HGS among males was greater over time (18–28 kg) compared with their female counterparts (15 kg) (Fig. 2). When the HGS was expressed in the form of kg per body weight (normalised HGS), we also observed significant changes in muscle strength for both sexes (not shown). Generally, the trend of dietary intake for both sexes was similar (Table 2). This study indicates that the dietary intake (energy, macronutrients and calcium intake) of males tends to plateau during late adolescence (17 years). However, the dietary intakes of the females were not consistent. We observed decreased trends for protein, fat and Ca intakes. Physical activity shows significant change in the score over 5-year period time (Fig. 3).
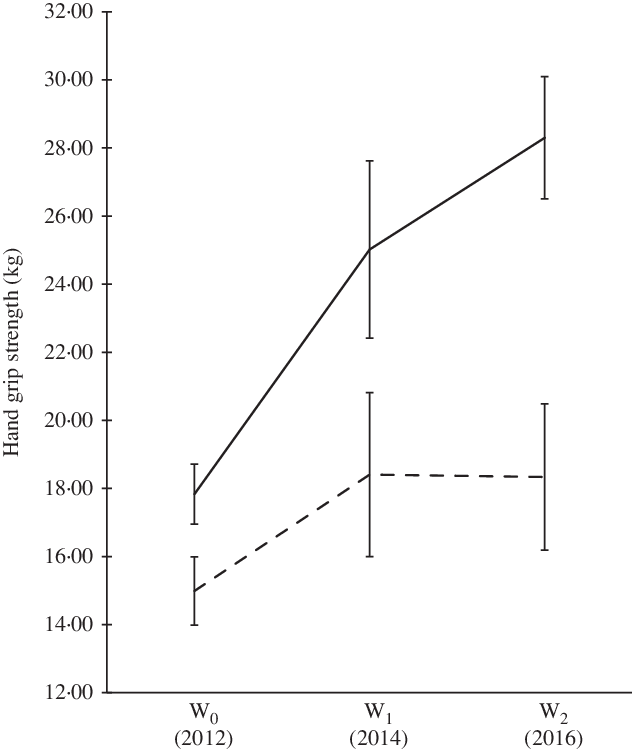
Fig. 2. Hand grip strength of participants over the 5-year period. Using generalised estimating equation, statistically significant changes over 5-year period at a level of significance of P < 0·05. W0, early adolescence; W1, middle adolescence; W2, late adolescence. ![]() , Males;
, Males; ![]() , females.
, females.
Table 2. Anthropometric measurements and dietary intake of the study participants
(Mean values and 95 % confidence intervals)
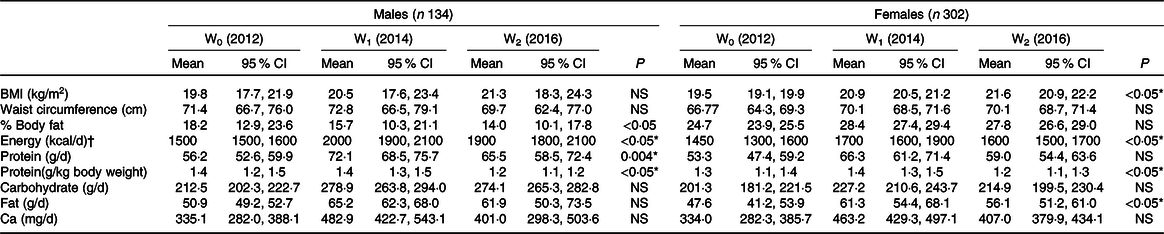
* Using generalised estimating equation, statistically significant changes over 5-year period (P < 0·05).
† To convert energy values from kcal to kJ, multiply by 4·184.
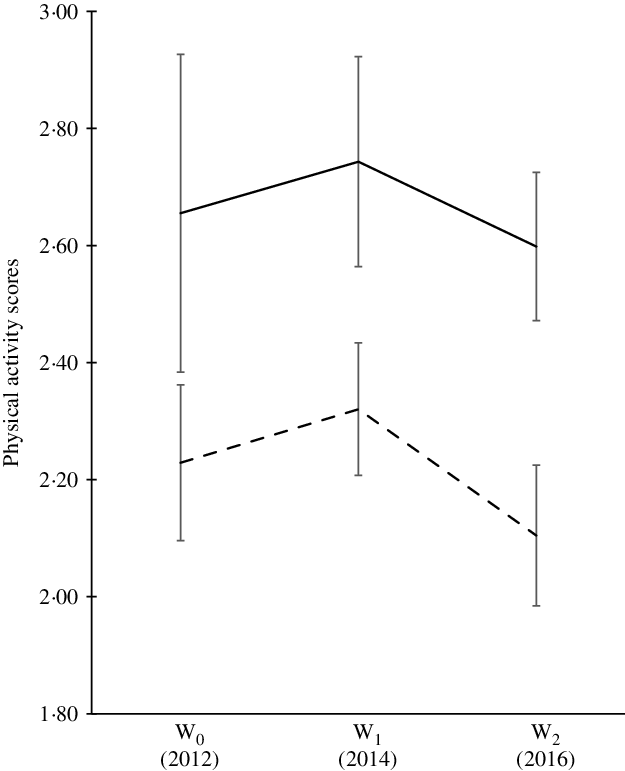
Fig. 3. Physical activity score of participants over the 5-year period. Using generalised estimating equation, statistically significant changes over 5-year period at a level of significance of P < 0·05. W0, early adolescence; W1, middle adolescence; W2, late adolescence. ![]() , Males;
, Males; ![]() , females.
, females.
Trends in BMI, waist circumference and percentage of body fat
Our data (Table 2) showed that there was no significant difference in terms of BMI and WC, but there was a significant reduction of percentage of body fat among males over 5-year period. As for females, BMI increased significantly over the 5-year period. The WC and percentage body fat of the female participants were also found to increase significantly between the ages of 13 and 15 years old (not shown).
Longitudinal analysis
A GEE was computed while controlling for ethnicity, household income, birth weight, BMI, length of the hand span, serum vitamin D and physical fitness score. Separate models were computed for males and females. Table 3 showed the results of the GEE analysis for both sexes. The muscle strength changes 5-year period was significantly correlated with protein (β = 0·035; P = 0·016) and carbohydrate intake (β = 0·002; P = 0·013). As for females, none of the variables of interest was correlated with the muscle strength changes over 5-year period.
Table 3. Generalised estimating equation for the longitudinal relationship between muscle strength, dietary intake and physical activity scores among Malaysian adolescents over a 5-year period†
(β Coefficients and 95 % confidence intervals)

QIC, quasilikelihood under the independence model criterion; QICC, corrected quasilikelihood under the independence model criterion.
* Statistically significant (P < 0·05).
† Controlled for place of residency, ethnicity, household income, birth weight, BMI, length of the hand span, serum vitamin D and physical fitness score.
‡ To convert energy values from kcal to kJ, multiply by 4·184.
Discussion
Trend in muscle strength, dietary intakes and physical activity
The muscle strength of the participants in this study was much lower (13 years old; males: 17·8 (sd 0·9) kg; females: 15·0 (sd 1·0) kg, 15 years old; males: 25·0 (sd 2·0) kg; females: 18·4 (sd 2·4) kg, 17 years old; males: 28·3 (sd 1·8) kg; females: 18·3 (sd 2·2) kg) than adolescents in Colombia (mean age: 13 years old; males: 25·3 (sd 9·2) kg; females: 22·6 (sd 8·2) kg)(Reference Ramírez-Vélez, Tordecilla-Sanders and Correa-Bautista19), Europe (mean age: 15 years old; males: 35·9 (sd 9·3) kg; females: 26·2 (sd 4·9) kg)(Reference Gracia-Marco, Bel-Serrat and Cuenca-Garcia15) and Brazil (mean age: 16 years old; males: 42·7 (sd 8·7) kg; females: 28·8 (sd 5·9) kg)(Reference Silva, Pelegrini and Chula de Castro6). Moreover, when compared with the results of the Asian region, the female adolescents in this study had lower muscle strength than those in Beijing, China(Reference Foo, Zhang and Zhu43). Unfortunately, there is no population-based data on other Asian male adolescents with which we could compare. However, we must not forget the fact that body size (e.g. body weight) could have an effect on muscle strength as per se (Reference Leong, Teo and Rangarajan55). For example, the mean weight of Colombian male and female adolescents were generally higher than the adolescents of present study (males Colombian: 45·8 kg v. present study: 45·6 kg; females Colombian: 42·1 kg v. present study: 44·7 kg)(Reference Ramírez-Vélez, Tordecilla-Sanders and Correa-Bautista19). Nevertheless, as far as we know, this is the first documented longitudinal muscle strength study among adolescents of both sexes in the Asian region.
In relation to the trend, this study showed an upward trend in muscle strength for males and females, consistent with other epidemiological studies, which indicated that younger adolescents have lower HGS compared with older adolescents(Reference Silva, Pelegrini and Chula de Castro6,Reference Huotari, Nupponen and Laakso8,Reference Silverman9,Reference Tremblay, Shields and Laviolette56) . When the normalised HGS was followed for both sexes, the muscle strength trend for males remained the same, while for females, a declining trend was observed between middle and late adolescence. This could suggest that this study population of females stop growing muscle mass during late adolescence. In addition, physiologically, adolescent males usually gain muscle mass, whereas females develop body fat during puberty(Reference Otero, Cohen and Herrera17,Reference Koley and Khanna49,Reference McComas, Sica and Petito57) . The testosterone hormone in males shows more effect on muscle building in comparison with the oestrogen hormone in females(Reference McComas, Sica and Petito57). From a panel data analysis from the Alimentación y Valoración del Estado Nutricional de los Adolescentes (AVENA) study in 2001–2002 and the Healthy Lifestyle in Europe by Nutrition in Adolescence-cross-sectional study in 2006–2007 shows that female muscular strength was lower as they grow older(Reference Moliner-Urdiales, Ruiz and Ortega58).
Interestingly, the dietary intake trends identified in this study are different from those reported from other countries(Reference Mendez, Sotres-Alvarez and Miles59–Reference Yu, Lopez-Olmedo and Popkin61). However, this difference could be due to the difference in the duration of studies undertaken. Besides that, the previous studies were based on panel data and covered a broad age range, as compared with this study which followed the same individuals at three different points in time and covered a more restricted age range of 13–17 years. It should also be added that there is no local longitudinal data against which to compare the results of this study. Most local studies were conducted as cross-sectional(Reference Rezali, Chin and Mohd Yusof62–Reference Zalilah, Khor and Mirnalini64). This is the first study in Malaysia to investigate the longitudinal trend in energy, macronutrient and Ca intakes among adolescents from early until late adolescence.
The analysis of the physical activity score for males and females in this study indicated that there was a decreasing trend with age. This is in agreement with several review papers which concluded that physical activity among the youth seems to decrease over time(Reference Miller, Cheatham and Patel65,Reference Knuth and Hallal66) . This could be due to numerous reasons (i) an increase in formal responsibilities (i.e. at school) and a shift in individual preferences related to leisure time activities may cause reduced participation in physical activity in adolescence(Reference Müller, Khoo and Lambert67), (ii) it has been noted that technology usage is associated with a shift in physical activity in several studies globally(Reference Ng and Popkin68), (iii) physical activity self-efficacy(Reference Dan, Mohd and Zalilah69) and peer influence(Reference Cheah, Lim and Kee70) may affect physical activity, (iv) adolescents who are overweight or obese are more likely to be physically inactive(Reference Baharudin, Zainuddin and Manickam71,Reference Chew, Leong and Yap72) and (iv) these participants in this study were predominantly from the rural area who may have poor accessibility to recreational park and sports facilities(Reference Saimon, Choo and Bulgiba73,Reference Abd-Latif, Nor and Omar-Fauzee74) . Furthermore, the available recreational park and sports facilities in rural areas may not be adequately equipped with exercise equipment especially for females(Reference Danis, Sidek and Yusof75).
Effects of dietary intakes and physical activity on muscle strength
Based on earlier finding, it was indicated that energy, carbohydrate, fat intakes and physical activity score were positively correlated with HGS, while protein intake was negatively correlated with HGS in males only(Reference Ng, Hairi and Jalaludin76). Nevertheless, such association was not seen when tracked longitudinally except for protein and carbohydrate intake.
In this study, this longitudinal analysis suggested that higher intake of protein and carbohydrate leads to stronger muscle strength. Possible explanation includes protein quality, timing and the amount of protein ingested(Reference Breen and Phillips77–Reference Strasser, Volaklis and Fuchs79). A study has showed that at least 25 g of high-quality proteins (inclusion of at least 8–10 g essential amino acids with higher leucine content) promote muscle protein synthesis. Hence, this results in greater muscle strength(Reference Breen and Phillips77). Consumption of high-quality protein right before exercise is postulated to increase muscle growth and strength(Reference Tipton and Phillips80).
As for the carbohydrate, the magnitude of the estimated carbohydrate effect (on a 5-year muscle strength change) was small. The effects may accumulate over time and potentially become clinically significant if high intakes persist for multiple years. Nevertheless, it is crucial to ensure the carbohydrate quality that is consumed (such as whole grain which contains more dietary fibre and micronutrients). In fact, a cross-sectional study has suggested that sweetened beverage intake (which contains sugar) attenuates the positive association between muscle strength and physical activity(Reference Hao, Pollock and Harris81). In this study, we were not able to breakdown the carbohydrate for further investigation in view of non-availability dietary fibre and sugar in our Malaysian food database (namely, Nutrient Composition of Malaysian Food).
In this study, the effect of Ca on muscle strength was not seen. This could be due to the low consumption of Ca among our study population being less than 50 % of the recommended nutrient intake. Moreover, the mechanism between dietary Ca intake and muscle strength still remains unclear. However, this could be due to weak bone strength, as explained by the Mechanostat theory(Reference Rauch, Bailey and Baxter-Jones82). Generally, Malaysian adolescents have poor bone health status(Reference Majid, Ramli and Ying83,Reference Suriawati, Majid and Al-Sadat84) . Several studies have shown that dietary Ca and vitamin D intakes are positively associated with bone mineral content(Reference Suriawati, Majid and Al-Sadat84,Reference Kristinsson, Valdimarsson and Steingrimsdottir85) . Therefore, good bone strength promotes good muscle strength, and dietary Ca intake does play a role in muscle strength.
Studies have shown that an increase in physical activity promotes muscle strength among adults(Reference Breen and Phillips77,Reference Tipton and Phillips80) but lack of evidence among adolescents in community set up(Reference Silva, Pelegrini and Chula de Castro6,Reference Otero, Cohen and Herrera17) . This effect also was not observed in the present adolescent study. The types of activity in which adolescents are involved may contribute to such findings(Reference Breen and Phillips77). Malaysian male adolescents preferred activities such as badminton, football and cycling(Reference Ahmad and Woolley86). These activities are not muscle-building activities, which further emphasise that an increase in physical activity is not enough to increase muscle strength. It has to be an activity that promotes muscle building and strengthening of muscle mass and strength. Thus, the WHO(87) suggested including activities that strengthen muscle and bone at least 3 d per week in 60 min of moderate- to vigorous-intensity physical activity, to improve muscle strength.
In this study, no relationship between muscle strength, dietary intake and physical activity scores was found among females. Interestingly, BMI played a role in affecting muscle strength among females based on the finding of this study. Given the fact that females gained more body fat composition during adolescence period and coupled reduced physical activity(Reference Majid, Amiri and Azmi88) which may lead to obesity and thus lower muscle strength. This warrants an emphasis on healthy eating with controlled energy intakes as this would promote a healthier body weight and especially lean body mass.
Strengths and limitations
This study provides the first Malaysian population estimates of HGS, a marker of overall muscle strength, dietary intakes and physical activity, and it tracked the changes of these variables over time in the same individuals from early adolescence (13 years) to middle (15 years) and late adolescence (17 years). Often, these cohort studies were analysed as cross-sectional looking either at a single nutrient(Reference Gracia-Marco, Bel-Serrat and Cuenca-Garcia15), on dietary pattern(Reference Saeedi, Black and Haszard16), or adherence to Mediterranean diet only(Reference Evaristo, Moreira and Lopes14). Furthermore, the longitudinal design of this study has allowed the researcher to investigate the longitudinal relationship between the key variables of interest. This data could be utilised for the local intervention programme leading to a better musculoskeletal health of Malaysian population in the long run. Besides that, this study used validated methods to assess dietary intakes (7-d diet history) and physical activity (PAQ-C) and an objective method (HSG dynamometer) to measure muscle strength in adolescents.
Nevertheless, this study has limitations which warrant caution when interpreting the findings. First, the cohort design means that there will be missing data and there is no best way to deal with missing data. However, since the data were missing at random, we had opted to overcome this issue by using multiple imputations in order to reduce the parameter estimates bias. Second, the tool used to investigate physical activity assessed the recreational activity and did not capture the specific types of activities that strengthen muscle. Nevertheless, measuring recreational activity and inactivity patterns is crucial because if these activities are modifiable, these activities could be included as components in public health policies. For instance, the inclusion of resistance training in the physical activity syllabus in schools could assist the policy direction. Third, this study used the recall method. Although a rigorous dietary assessment method was used, the possibility of under reporting and over reporting of dietary intake is unavoidable. This limitation may therefore lessen the strength of any observed association. Nevertheless, no method is without limitations, and the recall method is no exception. This recall method would be a reasonable approach for two main reasons. The memory processing of adolescents has a better memory processing than that of adults(Reference Burrows, Martin and Collins26), and using other approaches such as indirect calorimetry and record-based methods was not possible given that this study employs population-based participation approach.
Conclusion
This study provides good insights into the relationship of dietary intake, physical activity and nutritional status with muscle strength. The present study showed that males had higher muscle strength with higher intake of protein and carbohydrate. In addition, the males were active physically, but their level of activity and possibly the type of physical activity were not enough to increase muscle strength. In this study, the BMI of the females increased over time, thus led to lower muscle strength. These findings emphasise the need to develop sex-specific nutritional and physical activity programmes to ensure that muscular health is at the optimal level as early as possible, preferably in the early adolescence period.
Acknowledgements
The authors would like to thank participants who have involved in the study and Associate Professor Dr. Mohd Nahar Azmi Mohamed for the support and guidance.
This study was supported by funding received from the University Malaya’s Research Programme (UMRP022A and B-14HTM) and Postgraduate Research Fund (PG026-2016 A).
H. A. M. and M. Y. J. designed research; A. K. N., H. A. M., T. T. S. and M. D. conducted research; A. K. N., H. A. M. and N. N. H. performed statistical analysis; A. K. N. drafted the manuscript; H. A. M. had primary responsibility for final content. All authors read and approved the final manuscript.
The authors declare that there are no conflicts of interest.


