


1. Introduction
Schizophrenia is a serious mental disorder that usually develops in late adolescence or early adulthood. Characterized by delusions, hallucinations and cognitive impairments, schizophrenia affects nearly 1% of the world’s population Reference McGrath, Saha, Chant and Welham[1]. In genetic analysis, monozygotic twins studies only show around 50% concordance rate which strongly suggests that genetic basis alone is insufficient in explaining the development of schizophrenia Reference Cardno, Marshall, Coid, Macdonald, Ribchester and Davies[2]. Therefore, this prompts the investigation of environmental risk factors. Notable environmental factors include perinatal complications, neuro-trauma, psycho-trauma, substance abuse, and migration among others. However, one of the most important and immediate environmental factor is the gut microbiota Reference Clemente, Ursell, Parfrey and Knight[3]. The human gut microbiome comprises of bacteria on the order of trillions in magnitude with between 3 and 10 million unique genes, dwarfing the human genome by a ratio of 150:1 Reference Li, Jia, Cai, Zhong, Feng and Sunagawa[4–Reference Sender, Fuchs and Milo7]. This massive genetic repertoire which, unlike the human genome, is influenced by medication, probiotic or prebiotic supplementation or lifestyle changes, provides a means to better understand a variety of diseases and also to create low-cost rapid therapies with minimal side-effects.
The concept of the microbiota-gut-brain axis was proposed nearly a decade ago Reference Rhee, Pothoulakis and Mayer[8]. Considerable evidence now supports that there is a bidirectional interaction between the nervous system and the enteric microbiota. Four main routes have been suggested: neural, endocrine, immune, and metabolic pathways Reference Cardno, Marshall, Coid, Macdonald, Ribchester and Davies[9, Reference Smith10].
Besides the relatively new microbiota-gut-brain axis concept, the origin of schizophrenia has many classic hypotheses, such as the dopamine (DA) hypothesis Reference Carlsson and Lindqvist[11], serotonin (5-HT) hypothesis Reference Woolley and Weil-Malherbe[12], glutamate hypothesis Reference Kim, Kornhuber, Schmid-Burgk and Holzmüller[13] and membrane hypothesis Reference Horrobin, Glen and Vaddadi[14]. Thus, what are the relationships between microbiota-gut-brain axis and hypotheses of schizophrenia? The microbiota-gut-brain axis could be related to the classic neurotransmitter hypotheses due to the fact that microbes produce essential neurotransmitters such as DA, 5-HT and norepinephrine Reference Dinan, Stilling, Stanton and Cryan[15]. In fact, more than 90% of human 5-HT is produced in the gut where the microbiome promotes its synthesis and regulation Reference Gershon and Tack[16, Reference Yano, Yu, Donaldson, Shastri, Ann and Ma17]. In contrast, the role of the microbiota-gut-brain axis in the membrane hypothesis of schizophrenia is still unknown. The membrane hypothesis of schizophrenia is not only the most inclusive and promising hypothesis but also the biochemical basis of neurodevelopmental disorders. The core of the membrane hypothesis is that reduced synthesis and increased degradation of cell membranes, and the subsequent abnormal signal transmission are the causes of schizophrenia Reference Horrobin, Glen and Vaddadi[14, Reference Kemp van der18]. Furthermore, the membrane hypothesis also suggests that the schizophrenia is part of a systemic disease of membrane dysfunction instead of an independent brain disease, which happens to fit the key point of microbiota-gut-brain axis Reference Horrobin, Glen and Vaddadi[14]. However, unlike the classic neurotransmitter hypotheses, the relationship with microbiota-gut-brain axis and membrane hypothesis is still lack of research. In order to fill this research gap, we simultaneously measured the composition of gut microbiota and the marker of cell membrane disruption in brain, which is choline Reference Shutter, Tong and Holshouser[19]. As Schwarz et.al and Shen et.al have already conducted the gut microbiome study of first episode psychosis and schizophrenia Reference Shen, Xu, Li, Huang, Yuan and Wang[20, Reference Schwarz, Maukonen, Hyytiäinen, Kieseppä, Orešič and Sabunciyan21], we proposed to study the gut microbiota and brain imaging features of schizophrenia-afflicted individuals by following the high-risk (HR) and ultra-high risk (UHR) subjects, thereby exploring the relationships of microbiota-gut-brain axis and membrane hypothesis as well as shedding light on a new perspective for schizophrenia research. Here, we report the baseline results of our longitudinal prospective observational study.
2. Methods
2.1. Participants
Eighty-one HR subjects, nineteen UHR subjects and sixty-nine health controls (HC) were recruited from November 2016 to May 2017 at the Second Xiangya Hospital, Central South University, Changsha, Hunan, China. All participants were 13–30 years old Han Chinese; the demographic characteristics are detailed in Table 1.
Table 1 General characteristics of the recruited subjects.

HR: high-risk patients; UHR: ultra-high risk patients; HC: health controls; ChiSq: Chi-square; M: male; F: female; P: positive symptom; N: negative symptom; D: disorganized symptom; G: general symptom; GAF: Global Assessment of Function Scale.
** The difference between the groups is significant with a p-value less than 0.01.
All HCs and HRs were screened for lifetime absence of all five-axis diagnoses of mental disorders using the DSM-IV-TR criteria Reference APA[22]. In addition, all HCs were confirmed to have no family history of psychiatric disorder in their first-degree relatives. By contrast, the HRs were confirmed to have at least one of their first-degree relatives diagnosed with schizophrenia. All UHR subjects were screened by the Structured Interview for Prodromal Syndromes (SIPS) Reference McGlashan, Miller, Woods, Rosen, Hoffman and Davidson[23] and fulfilled one of the three subsets: Brief Intermittent Psychotic Syndrome (BIPS), Attenuated Positive Symptom Syndrome (APSS) and Genetic Risk and Deterioration Syndrome (GRDS). Exclusion criteria for all subjects included: gastrointestinal and endocrine diseases (including constipation and diarrhea), serious organ disorders (such as stroke and heart failure), a history of diagnosis of psychiatric disorders and corresponding treatments (such as antipsychotics, antidepressants and anticonvulsants), had used alcohol, antibiotics, probiotics or any other medications (oral or injectable) during the last three months.
This study was approved by the Ethics Committee of the Second Xiangya Hospital, Central South University (No. S090, 2016) and carried out in accordance with the Declaration of Helsinki. All participants were aware of the risks and benefits of the study and signed informed consent forms. Thirty-seven HCs did not agree with the Proton Magnetic Resonance Spectroscopy (1H-MRS) scanning, but they all had completed the clinical assessment and fecal sample collection. And there were no statistical differences of characteristics between the HCs which agreed to brain scanning and those who did not (see Table S1 in Supplementary material).
2.2. Clinical assessment
Both HRs and UHRs completed the Scale of Prodromal Symptoms (SOPS) for screening of schizophrenic symptoms and were assessed with the Global Assessment of Function Scale, Modified Version (GAF-M) to evaluate their psychological, social, and occupational functionalities Reference Hall[24]. The SOPS is a 19-item scale, a part of the SIPS and includes four subscales for positive, negative, disorganized and general symptoms.
2.3. Fecal DNA extraction and sequencing
All samples were collected using Swube™ dual swabs and stored at −80 °C for further processing. Each 0.2 g of raw sample was used for DNA extraction with QIAGEN QIAamp kit. We evaluated DNA concentration in each sample by fluorometry and sample integrity by agarose gel electrophoresis (1% concentration, 150 V, for 40 min). PCR amplification and library preparation were performed using 515F/806R primers to target the V4 region of the 16S rRNA gene. Samples were amplified in triplicate and cleaned using AGENCOURT AmpureXPbeads kit. For each reaction, we used 30 ng of DNA, 4 μL of PCR primer cocktail and 25 μL of NEB Phusion High-Fidelity PCR master mix. The final library was quantified by determining the average molecule length using Agilent 2100 bioanalyzer and quantified by real-time EvaGreen qPCR. Sequencing was performed using Illumina MiSeq 250 base-pair paired-end sequencing by BGI Genomics, China.
2.4. 1H MRS scanning procedure
All participants had Proton Magnetic Resonance Spectroscopy (1H-MRS) scans within 24 h after attending the study. All examinations were conducted on a 3.0 T magnetic resonance imager (Siemens, Skyra, Germany) using a 16-channel head coil at the Magnetic Imaging Centre of Hunan Children's Hospital. Participants were equipped with foam pads to reduce head motion and scanner noise. Anatomical images were acquired with three-dimensional T1-weighted magnetization-prepared rapid acquisition gradient echo for voxel tissue segmentation (TR 2530 ms; TE 2.33 ms; FOV 256 × 256 mm; flip angle 7°; slice thickness 1 mm; gap 0 mm; NEX 1; slices 192). 1H MRS spectra were measured by using the standard PRESS sequence (svs_se, TR 3000 ms, TE 30 ms, NEX 80). A 10 × 20 × 20 mm voxel of interest (VOI) was located on gray matter of the anterior cingulate cortex (ACC) using coronal, sagittal and transverse images (Fig. 1). The unsuppressed water spectra were acquired from the same voxel.
Choline was quantified by using LCModel version 6.3–1B (LCMODEL Inc. CA) at the Second Affiliated Hospital, Shantou University Medical College located in Shantou, Guangdong, China. The absolute choline concentration was calculated with tissue water as the internal reference and corrected for the cerebrospinal fluid (CSF) content in ACC. According to LCModel manual (http://s-provencher.com/pages/lcm-manual.shtml), seven HRs and two UHRs’ spectra were discarded because of these exclusion criteria: (1) the Cramer–Rao minimum variance > 15%, (2) choline FWHM < 0.1, and (3) the signal-to-noise ratio (SNR) > 10.
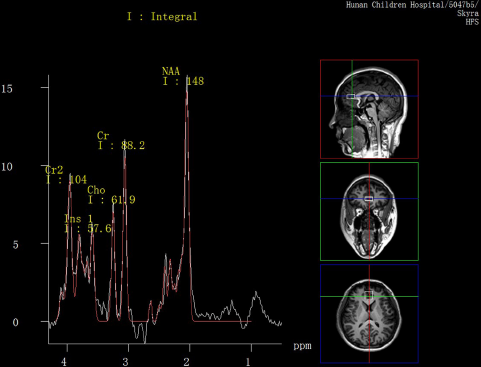
Fig. 1. MR images of the location of anterior cingulate cortex (ACC) voxel and spectral line of metabolites.
2.5. Bioinformatics and statistical analysis
To conduct 16S rRNA analysis, we first used QIIME2 to generate the feature table (BIOM), using the DADA2 sub-OTU (Operational Taxonomic Unit) picking an algorithm with default parameters Reference Callahan, McMurdie, Rosen, Han, Johnson and Holmes[25, Reference Caporaso, Kuczynski, Stombaugh, Bittinger, Bushman and Costello26]. On the output BIOM table, firstly, we calculated alpha- and beta-diversity metrics using QIIME2. Alpha-diversity is the species diversity within a single sample, here we used the observed OTUs to represent the richness and Shannon diversity index to quantify both abundance and evenness of the species. Beta-diversity is the differences in species composition among samples and the comparisons usually be presented in a distance matrix. Canberra distance matrix was used in the Principal Coordinates Analysis (PCoA) plot and the subsequent permutational analysis of variance (PERMANOVA) model was employed for testing the difference between groups. Then we applied Partial Least Squares Discriminant Analysis (PLS-DA) with mixOmics (https://CRAN.R-project.org/package=mixOmics) to divide the samples into different predefined clusters and employed sparse PLS-DA (sPLS-DA) to select the most discriminative features that help cluster samples. Linear Discriminant Analysis (LDA) Effect Size (LEfSe) Reference Segata, Izard, Waldron, Gevers, Miropolsky and Garrett[27] (http://huttenhower.sph.harvard.edu/lefse) was performed to detect which taxa had significantly different abundances among groups with non-parametric factorial Kruskal-Wallis (KW) rank-sum test. For LEfSe analysis, we performed the LDA to estimate the effect size of each differentially abundant microbes with default settings (the non-negative threshold for the logarithmic LDA score was 2 and tests of significance were two-sided, p-values were less than 0.05). The effect size of LDA model is equivalent to the microbes's variability and discriminatory power between groups Reference Callahan, McMurdie, Rosen, Han, Johnson and Holmes[25]. PICRUSt was used to predict functional profiling of microbiota from 16S rRNA data with the Greengenes database (http://greengenes.lbl.gov) and KEGG Database (www.genome.jp/kegg/) Reference Langille, Zaneveld, Caporaso, McDonald, Knights and Reyes[28]. And statistical analysis of PICRUSt outputs was performed with the Statistical Analysis of Metagenomic Profiles (STAMP) software package Reference Parks, Tyson and Hugenholtz[29].
All subsequent statistical analyses were completed using the software package R (http://cran.r-project.org/). Demographic characteristics and clinical assessment scores were described and detected the statistical differences using the Chi-square test, the Kruskal-Wallis rank-sum test and the Wilcoxon rank-sum test. Differences in choline concentration in ACC were assessed with Analysis of Variance (ANOVA) and Analysis of Covariance (ANCOVA), and applied with post-hoc Tukey Honestly Significant Difference (HSD) test to correct for multiple comparisons.
3. Results
3.1. Clinical characteristics
The 3 groups (HR, UHR and HC) recruited in this study had no significant differences in age and gender (p > 0.05). However, significantly more severe symptoms and lower function were observed in UHR group (Table 1).
3.2. Bioinformatics analysis of the sequences
From a total of 169 samples, we obtained 6,514,098 qualified sequences at a minimum depth of 31,121 reads. Because of the high number of minimum reads, we selected it as a rarefaction depth and performed all subsequent analyses using a rarefied feature table.
First, we calculated global diversity metrics to quantify microbial differences between subject groups. For alpha-diversity, or within-subject diversity, we employed the observed OTUs and Shannon diversity index to estimate the microbial richness and diversity, respectively. We observed no statistically significant differences among the three groups in microbial richness (Kruskal-Wallis p = 0.61), or diversity (Kruskal-Wallis p = 0.97). For beta-diversity, we proceeded with the PCoA using Canberra distance matrix Reference Lance and Williams[30] and found that group difference was significant through PERMANOVA (p = 0.029), in which, both the UHRs and HRs had significant differences with HCs (p = 0.048 for both).
Next, we applied PLS-DA to divide the samples into different clusters (Fig. 2, A) and used sPLS-DA to identify the most significantly abundant microbes in the UHR group (Fig. 2, B). The cluster plot showed heterogeneity within UHR group, which differed in distances from the other two groups. Combined with the LEfSe biomarker identification (Fig. 3), we found that orders Clostridiales, Lactobacillales and Bacteroidales and genera Lactobacillus and Prevotella were increased in UHRs compared to HRs and HCs. At the species level, only Lactobacillus ruminis was identified by both methods together as a significant feature in the UHR group.

Fig. 2. Taxonomic differences between UHR, HR and HC groups with PLS-DA and sPLS-DA.
(A) Clustered plot: represented the clustered plot for the OTUs selected on 1 st and 3rd components. The clustered plot based on 1 st and 2nd components was generated as well (see Fig. S1 in Supplementary material), but the cluster was overly driven by particular outliers and failed in separating the samples. (B) Contribution plots: showed the normalized and log ratio transformed abundance values of each OTU in the PLS-DA model and in which group the OTUs are the most abundant (only the UHR group has significant abundant OTUs in our model).
Abbreviations: HR: high-risk subjects; UHR: ultra-high risk subjects; HC: health controls; PLA-DA: Partial Least Squares Discriminant Analysis; sPLA-DA: sparse Partial Least Squares Discriminant Analysis; OTU: Operational Taxonomic Unit.

Fig. 3. Taxonomic differences between UHR, HR and HC groups with LEfSe.
(A) Taxonomic cladogram: the enriched taxa of each group are represented in a taxonomic tree. (B) Taxonomic bars: the LDA scores of each taxa that exceed the established significance threshold.
Abbreviations: HR: high-risk subjects; UHR: ultra-high risk subjects; HC: healthy controls; LEfSe: Linear Discriminant Analysis (LDA) Effect Size.
Finally, we used PICRUSt to make an overall functional prediction at 3 levels into KEGG pathways (see http://www.genome.jp/kegg/pathway.html#mapping for the detailed pathways in all levels). However, none of the 3 levels showed any significant differences of functional coverage among three groups. Then the KEGG Orthology (KO) database (http://www.genome.jp/kegg/ko.html) was applied to address the molecular-level functions, such as the synthesis of DA and 5-HT as well as the metabolism of choline. As the synthesis of SCFAs are much more complicated than the others, partly because the SCFAs is a group of metabolites including acetate, propionate, butyrate and so on, so the simplified pathways of SCFAs production are adopted from Stilling et.al and Macfarlane et. al’s papers instead of KO database Reference Stilling, van de Wouw, Clarke, Stanton, Dinan and Cryan[31, Reference Macfarlane and Macfarlane32]. And it turned out that instead of the synthesis of DA and 5-HT and the metabolism of choline, but the synthesis of SCFAs presented a difference among groups. That is, the SCFAs related pyruvate synthesis, acetyl-CoA synthesis and fatty acid biosynthesis initiation pathways were found to be elevated in UHR subjects other than HRs and HCs. But only the acetyl-CoA synthesis pathway showed a significant difference (p = 0.05) after multiple testing adjustment (Storey FDR; see Fig. S2 in Supplementary material).
3.3. 1H MRS spectra: comparison of choline levels between groups
After quality control, there were 74 HR subjects, 17 UHR subjects and 32 HCs left in the MRS cohort. With age and a dummy variable of gender serving as covariates, there was a significant difference of choline levels between three groups (p = 0.03). And after post-hoc analysis, we found the differences mostly derived from UHR and HC groups where the choline levels in UHR subjects were significantly higher than that of the HCs (p = 0.03) (Fig. 4).
3.4. Association with gut microbiome, clinical symptoms and choline concentration in anterior cingulate cortex
As illustrated in Fig. 2, the microbiota composition among groups was heterogeneous, but the underlying reason was unknown. To determine whether this was related with clinical symptoms or choline concentrations we identified 13 individuals (10 UHRs and 3 HRs) that clustered outside the main distribution area and 87 individuals (9 UHRs and 78 HRs) that gathered inside (Fig. 2). We found that the outside cluster does have significantly higher positive (p < 0.01), negative (p < 0.01) and dissociative (p < 0.01) symptom scores and lower GAF scores (p < 0.01). However, the general symptom scores (p = 0.15) and the choline concentrations (p = 0.53) were non-significantly increased in the outside cluster.
4. Discussion
4.1. Relationships with previous studies
As the first gut microbiome study of UHR subjects for schizophrenia, our results are consistent with previous gut microbiome studies of first episode psychosis, schizophrenia and autism which reported elevated Lactobacillus Reference Shen, Xu, Li, Huang, Yuan and Wang[20, Reference Schwarz, Maukonen, Hyytiäinen, Kieseppä, Orešič and Sabunciyan21, Reference Adams, Johansen, Powell, Quig and Rubin33–Reference Tomova, Husarova, Lakatosova, Bakos, Vlkova and Babinska35], Clostridium Reference Angelis, Piccolo, Vannini, Siragusa, Giacomo and Serrazzanetti[36–Reference Song, Liu and Finegold39], and Prevotella Reference Shen, Xu, Li, Huang, Yuan and Wang[20] levels in patients. Also, two oropharyngeal microbiome studies in schizophrenia revealed that Lactobacilli and Lactobacillus phage phi adh are more abundant in patients than controls Reference Castro-Nallar, Bendall and Pérez-Losada[40, Reference Yolken, Severance, Sabunciyan, Gressitt, Chen and Stallings41]. The murine model of autism also showed that Bacteroidetes are mostly affected by prenatal Valproate exposure Reference de Theije, Wopereis, Ramadan, van Eijndthoven, Lambert and Knol[42]. Generally, these studies explained the correlation of elevated levels of Lactobacillus and Clostridium with the underlying inflammation. Unlike the diverse Lactobacillus genus, our results focus on the Lactobacillus ruminis species which is a known Tumor Necrosis Factor (TNF)-stimulatory strain Reference Taweechotipatr, Iyer, Spinler, Versalovic and Tumwasorn[43].

Fig. 4. The difference of choline levels in ACC between groups.
Choline levels are significantly higher in UHR group than HC group.
Abbreviations: HR: high-risk subjects; UHR: ultra-high risk subjects; HC: health controls; ACC: anterior cingulate cortex; Cho: choline.
Brain imaging analyses (1H-MRS) in UHR subjects have already been performed for several years. Early in 2003, Wood et. al. reported a significant elevation of Choline/Creatine in the left dorsolateral prefrontal cortex (DLPFC) of UHR Reference Wood, Berger, Velakoulis, Phillips, McGorry and Yung[44]. Other than the prefrontal cortex, the limbic system is increasingly being regarded as having an important role in the early damaging effects of schizophrenia Reference Copolov, Velakoulis, Mcgorry, Mallard, Yung and Rees[45]. Several studies have already reported schizophrenia patients and high-risk individuals have increased choline level in ACC Reference O’Neill, Levitt, Caplan, Asarnow, McCracken and Toga[46–Reference Chiu, Lui, Hung, Chan, Chan and Sham48], which is a significant part of the limbic system and a central hub for cognitive processing Reference Cordes, Mathiak, Dyck, Alawi, Gaber and Zepf[49]. All mentioned observations are not only consistent with our findings but also leading to the interpretation that elevated choline level is a sign of disturbed membrane metabolism, often the result of glial activation Reference Plitman, de la Fuente-Sandoval, Reyes-Madrigal, Chavez, Gómez-Cruz and León-Ortiz[50].
4.2. Gut microbiome and membrane hypothesis
The membrane hypothesis has been greatly enriched and developed in recent years due to the joining of the microglia hypothesis Reference Monji, Kato and Kanba[51] and the immune hypothesis Reference Kinney, Hintz, Shearer, Barch, Riffin and Whitley[52]. Both emerging hypotheses emphasize the significant role of microglial activation in membrane dysfunction, which could induce excessive synaptic pruning, apoptosis, blood-brain barrier (BBB) disruption and amplification of neuroinflammation and then cause damage to the membrane integrity Reference da Fonseca, Matias, Garcia, Amaral, Geraldo and Freitas[53–Reference Streit, Mrak and Griffin56]. The evidences of activated microglia are heavily supported in the schizophrenia research field. For example, postmortem brain studies of schizophrenia have shown that the marker for activated microglia is elevated in patients Reference Bayer, Buslei, Havas and Falkai[57, Reference Radewicz, Garey, Gentleman and Reynolds58]; a positron emission tomography (PET) brain imaging study also has suggested increased microglial activity in schizophrenia patients and UHR individuals Reference Bloomfield, Selvaraj, Veronese, Rizzo, Bertoldo and Owen[59]. However, the pathogenic mechanism of microglia activation in schizophrenia patients remains unclear. Genetically, the complement component 4 (C4) genes may stimulate the microglia via the complement cascade Reference Sekar, Bialas, De Rivera, Davis, Hammond and Kamitaki[60]. But how about the environmental factors, especially gut microbiome? To answer this, our results provided a possibility that changes in the gut microbiota may serve as a resource in microglial activation which contributes to the onset of schizophrenia based on membrane hypothesis.
Our main finding is that levels of Clostridiales, Prevotella and Lactobacillus ruminis in gut microbiota and level of choline in ACC are elevated in UHR subjects. As mentioned above, the association between elevated choline and membrane hypothesis is widely recognized, hence the role of gut microbiome in membrane hypothesis is the key point at present. In regard to the association between gut microbiota and the membrane hypothesis, the former two genera (Clostridiales and Prevotella) are known to be involved in the fermentation of carbohydrates and are prominent producers of SCFAs Reference Houser and Tansey[61] which is also supported by our functional prediction. The pyruvate synthesis, acetyl-CoA synthesis and fatty acid biosynthesis initiation are three fundamental reactions in the synthesis of SCFAs Reference Tumanov, Bulusu and Kamphorst[62] which were observed to be more active in UHR subjects to different degrees in our study. SCFAs, which mainly consist of acetate, propionate and butyrate, are able to cross the blood brain barrier (BBB) and may have different effects on microglia Reference Vadder, Petia, Goncalves, Vinera, Zitoun and Duchampt[63]. Studies have reported how microglial activation is affected by propionate and the microglial inhibition by butyrate Reference Sherwin, Sandhu, Dinan and Cryan[64, Reference Vinolo, Rodrigues, Nachbar and Curi65]. However, high concentration and mixtures of SCFAs were suggested to promote activation of microglia and amplification of the inflammatory process Reference Pender, Quinn, Sanderson and MacDonald[66, Reference Sampson, Debelius, Thron, Janssen, Shastri and Ilhan67]. In autism studies, total SCFAs were observed at increased levels in the stool of autistic children Reference Wang, Christophersen, Sorich, Gerber, Angley and Conlon[68], and propionate was proven to induce autistic behaviors and microglia activation in animal models Reference Ossenkopp, Foley, Gibson, Fudge, Kavaliers and Cain[69, Reference Shultz, MacFabe, Martin, Jackson, Taylor and Boon70]. The administration of valproic acid, an effective assistance drug in alleviating schizophrenic symptoms, could inhibit the transport of SCFAs across the BBB in rodents Reference Adkison and Shen[71], that in turn indicates the negative effect of SCFAs on brain function. As for our latter finding, taxon Lactobacillus ruminis could stimulate the production of the TNF Reference Taweechotipatr, Iyer, Spinler, Versalovic and Tumwasorn[43]. There are three facts about TNF that most attract our interest: TNF could not only cross the BBB, but also increase the permeability of the BBB Reference Banks, Kastin and Broadwell[72, Reference Tsao, Hsu, Liu, Liu, Lei and Wu73]; it is a robust activator of microglia Reference Klapal, Igelhorst and Dietzel-Meyer[74] and the expression of TNF could be promoted by SCFAs Reference Morris, Berk, Carvalho, Caso, Sanz and Walder[75]. So far, we could infer that the gut microbiota differences in UHR subjects may be involved in microglial-induced membrane dysfunction through elevating the SCFAs and TNF level, and thereby become the gut extension of schizophrenia’s membrane hypothesis (Fig. 5). In addition, there is conceivable evidence suggesting that exposure to certain microbial proteins and inflammatory metabolites could weaken the BBB Reference Downs, Perna, Vitelli, Cook and Dhurjati[76, Reference Huang and Jong77]. The membrane hypothesis could in turn be the brain extension to microbial translocation mechanism.
As for the HR and HC groups, our analyses did not show apparent distinction between this two groups. The HRs’ relatively normal microbial environment may protect them from illness thereby counteracting risks brought on by their genes.
4.3. Limitations and highlights
The main limitation of this study is the small sample size, especially of the UHR group, which might make the direct relationship of choline concentration in brain and gut microbiota composition underpowered. Second, neither the metabolites (such as SCFAs and choline) nor the inflammation markers (including TNF) concentration in blood, stool or cerebrospinal fluid samples had been evaluated directly. Third, the Body Mass Index (BMI) and diet information are lacking in our study, though the dietary habits of individuals in Hunan Province are very similar. As the BMI and diet could have a nonnegligible impact on gut microbiota, we should control for these factors to decrease possible bias in our future study. Fourth, the phylogenetic power of 16S rRNA gene sequencing data is low at the species level Reference Janda and Abbott[78]. Although the V4 region of the 16S rRNA gene is perceived to have relatively robust discrimination among most bacterial species Reference Caporaso, Lauber, Walters, Berg-Lyons, Lozupone and Turnbaugh[79], our species level result need to be treated carefully and replicated by future metagenomics sequencing. Fifth, our functional profiling is performed on the basis of 16S rRNA gene data Reference Langille, Zaneveld, Caporaso, McDonald, Knights and Reyes[28]. We make inferences about the genome corresponding to the specific marker gene sequence, as well as about the functional potential of a given genome. Our current knowledge of metabolic pathways and functions is limited and we can estimate that the coverage is at 50% of any given genome at best Reference Mi, Muruganujan and Thomas[80, Reference Suzek, Wang, Huang, McGarvey and Wu81]. Most of the well-characterized functions correspond to housekeeping genes. It is likely that more relevant pathways will be discovered in the future, as we develop better high-throughput methods to either characterize or predict the functions of microbial genes which would match the pace of our discoveries Reference Jiang, Oron, Clark, Bankapur, D’Andrea and Lepore[82]. Finally, our 1H MRS scans only include one region of interest (ROI) − the anterior cingulate cortex (ACC), prompting the need for more areas of the brain to be observed.
Notably, we conducted the gut microbiome and 1H MRS study in the same subjects at the same time thus strengthening our conclusions. All the subjects we studied were drug-naïve for at least 3 months, hence excluding one important confounding effect of gut microbiome. Our exploration bridges the gap between brain membrane metabolism and gut microbiota with the potential microglial activation by SCFAs. This baseline study of UHR subjects provides a new perspective for the pathological process of schizophrenia. In a follow-up study, we will test the hypotheses formulated in this paper by collecting longitudinal microbiome and brain imaging data to record the trajectory of transition to psychosis in high-risk subjects. Consequently, we aim to build a predictive microbiome-brain model of schizophrenia.
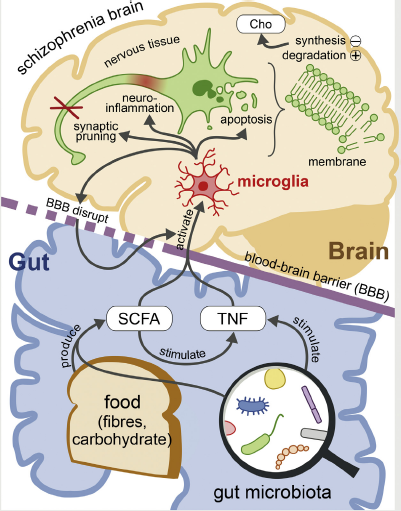
Fig. 5. Schematic representation of the gut microbiota promotes the onset of schizophrenia via the membrane hypothesis.
Dietary fibers and carbohydrate could be fermented by certain microbiota to create SCFAs which are able to enter the CNS through BBB with the stimulated TNF and activate the microglia. The activation of microglia in CNS could disturb the membrane metabolism in brain cells, which triggers the membrane hypothesis (through synaptic pruning, apoptosis, neuroinflammation and BBB disruption), increases the Choline level and further lead to the onset of schizophrenia. This pathway could be amplified by the increased permeability of BBB.
Abbreviations: SCFAs: Short Chain Fatty Acids; TNF: Tumor Necrosis Factor; CNS: Central Nervous System; BBB: Blood-brain barrier; Cho: choline.
Our findings strengthen the link between the gut microbiome and schizophrenia via the membrane hypothesis. It gives hope for the use of the gut microbiota as a tool for early diagnosis of schizophrenia as well as the development of personalized microbial therapeutics, thereby alleviating psychiatric symptoms in a precision-medicine approach.
Author contributions
YH, JT and XC designed the study. YH, YZ, ZL, XM, NY and LY collected the samples and clinical informations. CL and KJ carried out the brain scaning. YH, TK, QZ, MT and RK analyzed and discussed the experimental result. YH and TK wrote the first draft of the manuscript. All authors contributed to and have approved the final manuscript.
Conflict of interest
There is no conflict of interest to declare.
Acknowledgements
This work was funded by the National Natural Science Foundation of China (81471361 and 81271484 to X.C.) and China Scholarship Council (Grant No. 201606370199 to Y.H.). We thank all the participants who donated their stool samples and cooperated with the brain scanning and evaluation. And we would like to thank Dr. Stephen J. Glatt and Mr. Jason Zhao for constructive comments and revisions.
Appendix A. Supplementary data
Supplementary data associated with this article can be found, in the online version, at https://doi.org/10.1016/j.eurpsy.2018.05.011.


Comments
No Comments have been published for this article.