


P is an essential mineral that plays an important role in energy metabolism(Reference Amanzadeh and Reilly1). Being incorporated in adenosine triphosphate, it has been shown to enhance energy expenditure (EE). Ingestion of P was able to elevate both RMR upon consumption of a low energy diet(Reference Nazar, Kaciuba-Uściłko and Szczepanik2) and postprandial thermogenesis in obese subjects(Reference Jaedig and Henningsen3,Reference Jaedig, Lindgärde and Arborelius4) . Similarly, P caused a significant increase in RMR in obese women during weight reduction(Reference Kaciuba-Uściłko, Nazar and Chwalbińska-Moneta5). In line, it was recently demonstrated that the addition of 500 mg of P to a high carbohydrate meal was able to boost postprandial EE of both lean and obese subjects(Reference Assaad, El Mallah and Obeid6), as well as enhance the postprandial thermogenesis upon ingestion of diets of different nutrient compositions(Reference Abdouni, Olabi and Obeid7). Such increases in different components of EE may be related to P availability(Reference Morris, Nigon and Reed8), which is directly influenced by dietary P intake and replenishment(Reference Fischbeck9,Reference Hettleman, Sabina and Drezner10) .
Extensive research has also highlighted the ability of structured exercise, denoting supervised, prescribed and/or planned training sessions, to alter various components of EE. It was demonstrated that exercise enhances RMR when measured by indirect calorimetry(Reference Pinto and Shetty11). Generally, animal studies have shown that both single exercise sessions and long-term exercise training at various intensities result in increases in RMR(Reference Speakman and Selman12). Of note is that the greater the intensity of the exercise, the higher the post-exercise EE(Reference Yoshioka, Doucet and St-Pierre13). However, the energy cost of exercise was reported to be partially compensated over time(Reference Riou, Jomphe-Tremblay and Lamothe14), through alterations in EE and/or energy intake(Reference Whybrow, Hughes and Ritz15,Reference Drenowatz16) . The effect of structured exercise on total daily EE is evident though its impact on non-exercise activity thermogenesis (NEAT). NEAT is defined as the EE for all activities except structured exercise, such as activities of daily living, occupation, leisure, postural maintenance, spontaneous muscle contraction, talking and fidgeting(Reference Levine17). As such, while some studies reported an elevation in NEAT post-exercise(Reference Alahmadi, Hills and King18), numerous others found a reduction in EE from NEAT as a compensation for the energy spent during exercise sessions(Reference King, Caudwell and Hopkins19,Reference Melanson20) . More specifically, as volume and intensity of exercise increases, NEAT decreases(Reference Melanson20). Additionally, aerobic exercise results in a reduction in NEAT(Reference Riou, Jomphe-Tremblay and Lamothe14,Reference Drenowatz16) , possibly due to increases in fatigue associated with aerobic training(Reference Doucet, McInis and Mahmoodianfard21). However, it is not clear whether the capacity of P to stimulate EE would impact energy compensation following regular structured aerobic exercise. Accordingly, our objective was to examine the combined effect of dietary P and moderate-intensity running exercise routine on energy balance and body composition.
Methods
Animal housing
Approval of the experimental protocol was obtained from the Institutional Animal Care and Use Committee of the American University of Beirut, Lebanon. The study was performed in accordance with the criteria outlined in the Guide for the Care and Use of Laboratory Animals. Seven-week old male Sprague Dawley rats were housed individually in wire-bottom cages in a controlled environment (22 (sd 1)°C, inverse light cycle 12 h light–12 h dark cycle, light off at 13.00 hours). Rats had free access to water and semisynthetic powder control diet for 1-week adaptation period.
Experimental diets
The semisynthetic powder experimental diets (online Supplementary Table S1) were isoenergetic and were all prepared using the same ingredients. Dried egg white was used as the main source of protein (20 % of the energy content), because it supplies all essential amino acids and contains negligible amounts of P (mean values and standard deviation: 1·5 (sd 0·013) g/kg) (EPA reference). To control the level of P in the various diets, P-free mineral mix (AIN-93 G mix without P) was used, and different proportions of potassium phosphate from Dyets Inc. were added accordingly. Potassium phosphate was used as the P source because K does not affect the growth of laboratory rodents(Reference Murai, Shukuin and Sugimoto22,Reference Jodas, Voltera and Ginoza23) .
Experimental design
Two sequential experiments were run. Following the 1-week acclimation period, forty-eight rats in Expt 1 (Low P-LP diets) and forty-eight rats in Expt 2 (High P-HP diets) were randomly divided into different experimental groups (eight rats per group), each presented with their corresponding experimental diet containing various P levels, and following either a sedentary (S) or an exercise (E) routine.
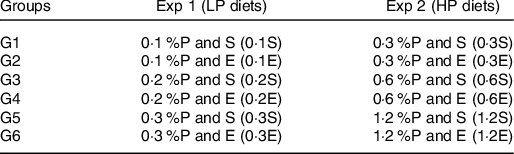
Under standard conditions, the recommended P content of rats’ diet is 0·3 % based on the AIN-93 recommendation for optimal growth of laboratory rats(Reference Reeves24). 0·1 %P is equivalent to 0·063 mg P/kJ (0·263 mg P/kcal), 0·2 %P~0·126 mg P/kJ (0·526 mg P/kcal), 0·3 %P~0·189 mg P/kJ (0·789 mg P/kcal), 0·6 %P~0·377 mg P/kJ (1·579 mg P/kcal) and 1·2 %P~0·755 mg P/kJ (3·158 mg P/kcal). Rats were maintained on their respective diet ad libitum for the whole experimental period of 6 weeks. Upon termination of the experiment, overnight-fasted rats were anaesthetised with isoflurane (Forane; Abbott) and blood was collected from the superior vena cava. The rats were then killed by severing their hearts. Immediately afterwards, tissue samples (liver, gastrocnemius muscle, epididymal fat pad) were immediately excised, weighed, frozen in liquid N2 and then stored at −80°C. Blood samples were centrifuged at 2200 g for 15 min at 3°C, and aliquots of plasma were collected and stored at −80°C until further analysis.
Structured exercise
A motor-driven rodent treadmill apparatus (4-lane Rat Model locally manufactured for experimental purposes) was used for the implementation of structured exercise training sessions. Initially, during a 3-d acclimation period, the physically exercised groups underwent a low-intensity running protocol for 10 min/d at 10 m/min. Thereafter, 30 min of moderate-intensity exercise protocol (equivalent to 60 %VO2 max) was implemented 5 d a week for a total of 6 weeks. Wherein, exercising rats were started at 10 m/min for 5 min, and speed was increased up to 14 m/min for another 5 min, then kept constant at 18 m/min(Reference Lu, Dong and Tucker25) to reach a total of 30 min per session. To encourage the rats to run forward during the whole training session, a mild electrical stimulus (0·1 mA at 90 volts and 25 Hz) was delivered(Reference Zhao, Pang and Liu26). Correspondingly, sedentary rats were placed on the treadmill in static mode for the same period of time.
Body weight and composition
Body weight and body composition analysis were measured once per week till the end of the experiment. For non-invasive measurement of body composition, rats were placed in a whole-body composition analyser (Minispec LF110) based on NMR technology, yielding measurements for fat tissue (fat mass-FM), lean tissue (Lean Body Mass-LBM) and free fluid in living rats.
Energy balance parameters
Food intake was monitored twice weekly and averaged in order to calculate weekly energy intake and subsequently total energy intake (EI). Total energy expenditure (TEEx) was estimated using an energy balance technique, which is highly correlated with indirect calorimetry. It was specifically calculated as the difference between EI over the whole experimental period and the change in energy stores (ΔEst) (energy accumulated in fat and lean mass gain)(Reference Ravussin, Gutman and LeDuc27). In particular, body composition parametes (FM and LBM) were recorded at the start and the end of the experiment (in grams), and the mass gains were computed in terms of accumulated energy stores also known as ΔEst (in kJ), i.e. the sum of the change in fat stores (ΔFatst) and the change in LBM stores (ΔLBMst). The energetic equivalent of FM was assigned 39·33 kJ/g (9·4 kcal/g) and LBM 4·184 kJ/g (1·0 kcal/g)(Reference Halldorsdottir, Carmody and Boozer28,Reference Pullar and Webster29) . Below are the detailed calculations of TEEx:
 $${\rm{TEEx }} = {\rm{EI - }}\left( {\rm{\Delta} {\rm{Fatst}} + \Delta {\rm{LBMst}}} \right)\,{\rm{and}}\,\rm{\Delta} {\rm{Est}} = \Delta {\rm{Fatst}} + \Delta {\rm{LBMst}}$$
 $${\rm{Then}}\,{\rm{TEEx}} = {\rm{EI}} - \rm{\Delta} {\rm{Est}}$$
 $${\rm{Where}},\,\rm{\Delta} {\rm{Fatst}} = \left( {{\rm{FMFinal}} - {\rm{FMInitial}}} \right) \times {\rm{39}}\!\cdot\!{\rm{33}}\,{\rm{kJ}}/{\rm{g}}$$
 $${\rm{And}},\,\rm{\Delta} {\rm{LBMst}} = ({\rm{LBMFinal}} - {\rm{LBMInitial}}) \times {\rm{4}}\!\cdot\!{\rm{184}}\,{\rm{kJ}}/{\rm{g}}$$
Consequently, the percentage fat stores (%Fatst) represents the proportion of the gain in energy stores attributed to fat accumulation, and the percentage LBM stores (%LBMst) denotes the proportion of the gain in energy stores attributed to LBM accumulation. The specific calculations are as follows:
 $$\% {\rm{Fatst}} = \left( {\rm{\Delta} {\rm{Fatst}}/\rm{\Delta} {\rm{Est}}} \right) \times {\rm{1}}00$$
 $$\% {\rm{LBMst}} = \left( {\rm{\Delta} {\rm{LBMst}}/\Delta {\rm{Est}}} \right) \times {\rm{1}}00$$
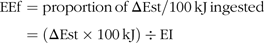
Finally, energy efficiency (EEf) is determined as the amount of energy stored per 100 kJ consumed.
 $$\displaylines{
{\rm{EEf}} = {\rm{proportion}}{\mkern 1mu} {\rm{of}}{\mkern 1mu} \Delta {\rm{Est/100}}{\mkern 1mu} {\rm{kJ}}{\mkern 1mu} {\rm{ingested}} \cr
{\rm{ = }}(\Delta {\rm{Est}} \times {\rm{100}}{\mkern 1mu} {\rm{kJ}}) \div {\rm{EI}} \cr} $$
$$\displaylines{
{\rm{EEf}} = {\rm{proportion}}{\mkern 1mu} {\rm{of}}{\mkern 1mu} \Delta {\rm{Est/100}}{\mkern 1mu} {\rm{kJ}}{\mkern 1mu} {\rm{ingested}} \cr
{\rm{ = }}(\Delta {\rm{Est}} \times {\rm{100}}{\mkern 1mu} {\rm{kJ}}) \div {\rm{EI}} \cr} $$
Plasma analysis
Fasting plasma glucose, total cholesterol, HDL-cholesterol, TAG, total P, plasma urea nitrogen (PUN) and plasma creatinine were measured with an enzymatic colorimetric method on the Vitros 350 Chemistry System (Ortho-Clinical Diagnostics). The plasma insulin concentration was determined by an enzyme immunoassay using the Rat/Mouse Insulin ELISA Kit (EZRMI-13 K; EMD Millipore Corporation). The plasma parathyroid hormone (PTH) and fibroblast growth factor-23 (FGF-23) were quantitatively measured by a sandwich enzyme immunoassay technique using the Rat PTH and Rat FGF23 ELISA Kits respectively (My BioSource, Thermo Fisher Scientific).
Statistical analysis
The Harvard University (USA) software (http://hedwig.mgh.harvard.edu/sample_size/size.html) was used to determine sample size. The sample size for two groups was calculated using input parameters as follows: α error probability of 0·05, power probability of 0·08, 1·5 or 25 % difference between the means based on previously determined weight gain data (6·0 (sd 0·95) g/d)(Reference Hammoud, Jabbour and Tawil30). As a result, a total of sample size of eight rats per group was obtained.
Results were expressed as mean values and standard deviation. Statistical analysis was performed using the SPSS Statistics 25.0 software (IBM Corp.). In both experiments, multiple-way ANOVA (general linear model), with time, P and exercise as well as their interactions was used to analyse the results throughout the 6-week experimental period. For the variables that were not measured on weekly basis, general linear model, with P and exercise as well as their interactions was used.
Results
Energy balance outcomes
In the LP diets experiment (Exp 1), EI was significantly different according to P (P < 0·001), in which the 0·3 %P groups had the highest intake. While EI of the exercised rats was significantly lower than that of the sedentary rats (P = 0·009) (Fig. 1(A)). Surprisingly, the TEEx was not found to be affected by neither P nor E. Changes in EEf were similar to that of EI, in which EEf was increased as the P content of the diet increased, and this was highly pronounced in the 0·3 %P groups (P < 0·001), whereas EEf decreased among the exercising groups (P = 0·001) (Fig. 1(B)). In line with the trajectory of EEf, the ΔEst were altered between groups with different P levels, demonstrating lower accumulation of body stores with lower dietary P intake as compared with the standard 0·3 %P group (P = 0·039).

Fig. 1. Expt 1 – Effect of phosphorus and exercise on total energy intake (EI) (![]() ) (A), total energy expenditure (TEEx) (
) (A), total energy expenditure (TEEx) (![]() ) (A), energy efficiency (EEf) (
) (A), energy efficiency (EEf) (![]() ) (B), and the accumulated energy stores (ΔEst) (
) (B), and the accumulated energy stores (ΔEst) (![]() ) (B) in the six group of rats over the 6-week experimental period. Group 0·1S: 0·1 %P and sedentary; group 0·1E: 0·1 %P and exercise; group 0·2S: 0·2 %P and sedentary; group 0·2E: 0·2 %P and exercise; group 0·3S: 0·3 %P and sedentary; group 0·3E: 0·3 %P and exercise. Data are expressed as mean values and standard deviations of all values. A multiple-way ANOVA (general linear model) was performed with time, phosphorus and exercise as factors. Significance was set at P < 0·05.
) (B) in the six group of rats over the 6-week experimental period. Group 0·1S: 0·1 %P and sedentary; group 0·1E: 0·1 %P and exercise; group 0·2S: 0·2 %P and sedentary; group 0·2E: 0·2 %P and exercise; group 0·3S: 0·3 %P and sedentary; group 0·3E: 0·3 %P and exercise. Data are expressed as mean values and standard deviations of all values. A multiple-way ANOVA (general linear model) was performed with time, phosphorus and exercise as factors. Significance was set at P < 0·05.
In the HP diets experiment (Exp 2), EI significantly varied between the various P levels (P = 0·001) (Fig. 2(A)). Additionally, P × E interaction was significantly different between all of the six groups (P = 0·002), demonstrating an incremental increase in intake in the exercising groups of both 0·6 and 1·2 %P as compared with their sedentary counterparts. In contrast to LP diets experiment, TEEx significantly increased with increasing P levels and supervised E (P < 0·001). Additionally, TEEx responded to the combined effect of these factors, showing a greater EE in the 1·2 %P sedentary group (339·62 kJ/d (81·17 kcal/d)) as compared with the 0·3 %P (311·04 kJ/d (74·34 kcal/d)) (P = 0·05) and 0·6 %P (318·99 kJ/d (76·24 kcal/d)) (P = 0·034) sedentary groups (Fig. 2(A)). EEf was also significantly influenced by P (P = 0·010) and E (P < 0·001) (Fig. 2(B)). Notably, the EEf was altered by the joint P × E factors, where it was significantly lower in the 1·2 %P groups as compared with the 0·3 %P groups (P = 0·047). A similar course of change in total ΔEst was documented, where incremental levels of dietary P resulted in a decreasing trend in ΔEst, which were significantly reduced in response to physical exercise (Fig. 2(B)).

Fig. 2. Expt 2 – Effect of phosphorus and exercise on total energy intake (EI) (![]() ) (A), total energy expenditure (TEEx) (
) (A), total energy expenditure (TEEx) (![]() ) (A), energy efficiency (EEf) (
) (A), energy efficiency (EEf) (![]() ) (B), and the accumulated energy stores (ΔEst) (
) (B), and the accumulated energy stores (ΔEst) (![]() ) (B)) in the six group of rats over the 6-week experimental period. Group 0·3S: 0·3 %P and sedentary; group 0·3E: 0·3 %P and exercise; group 0·6S: 0·6 %P and sedentary; group 0·6E: 0·6 %P and exercise; group 1·2S: 1·2 %P and sedentary; group 1·2E: 1·2 %P and exercise. Data are expressed as mean values and standard deviations of all values. A multiple-way ANOVA (general linear model) was performed with time, phosphorus and exercise as factors. Significance was set at P < 0·05.
) (B)) in the six group of rats over the 6-week experimental period. Group 0·3S: 0·3 %P and sedentary; group 0·3E: 0·3 %P and exercise; group 0·6S: 0·6 %P and sedentary; group 0·6E: 0·6 %P and exercise; group 1·2S: 1·2 %P and sedentary; group 1·2E: 1·2 %P and exercise. Data are expressed as mean values and standard deviations of all values. A multiple-way ANOVA (general linear model) was performed with time, phosphorus and exercise as factors. Significance was set at P < 0·05.
Body weight gain and composition variations
In the LP diets experiment, body weight increased gradually with time, though differences were observed between the various groups (Fig. 3(A)). In which, body weight was increased with P content of the diet (P < 0·001), essentially showing significance between 0·1 % and 0·3 %P sedentary groups starting at week 2 (online Supplementary Table S2). Further, a significantly lower body weight was displayed in the exercising groups (P = 0·001). At the body composition level, significant differences in % body fat were found according to P (P = 0·001) and E (P = 0·005) (Fig. 3(B)). % body fat in the 0·3 %P sedentary group was higher than that of the other groups. Additionally, the groups who were regularly exercising accumulated a lower % body fat throughout the experimental period (P = 0·005) (see online Supplementary Table S3 for details). Percentage LBM was found to be statistically significant according to P (P = 0·001) and E (P = 0·013) (Fig. 3(C)) (see online Supplementary Table S4 for details). Looking at the quantity and type of energy stores accumulated throughout the study period (Table 1), it is clear that the ΔEst of the 0·3 %P sedentary group was the highest, differing by around 1200 kJ (300 kcal) as compared with the other groups, while ΔEst in the exercising groups was lower than the sedentary groups, though failed to reach statistical significance (P = 0·062). The differences in ΔEst between the groups were mainly related to changes in body fat content, as the amount of LBM gained was similar between the groups. Thus, the lower ΔFatst observed in the exercising groups resulted in a higher proportion of gain in body stores coming from LBMst accumulation (%LBMst) among these groups.

Fig. 3. Expt 1 – Effect of phosphorus and exercise on body weight and composition measures. Weekly body weight gain in g (A), percentage body fat (B) and percentage lean body mass (C), of the six groups of rats over the 6-week experimental period. Group 0·1S: 0·1 %P and sedentary; group 0·1E: 0·1 %P and exercise; group 0·2S: 0·2 %P and sedentary; group 0·2E: 0·2 %P and exercise; group 0·3S: 0·3 %P and sedentary; group 0·3E: 0·3 %P and exercise. Data are expressed as mean values and standard deviations of all values. A multiple-way ANOVA (general linear model) was performed with time, phosphorus and exercise as factors. Significance was set at P < 0·05. (A–C) ![]() , 0·1S;
, 0·1S; ![]() , 0·1E;
, 0·1E; ![]() , 0·2S;
, 0·2S; ![]() , 0·2E;
, 0·2E; ![]() , 0·3S;
, 0·3S; ![]() , 0·3E.
, 0·3E.
Table 1. Expt 1 – Effect of phosphorus and exercise on body energy stores in the six groups of rats over the 6-week experimental period*
(Mean values and standard deviations)

E, exercise; Est, energy stores; Fatst, fat stores; LBMst, lean body mass stores; group 0·1S: 0·1 %P and sedentary; group 0·1E: 0·1 %P and exercise; group 0·2S: 0·2 %P and sedentary; group 0·2E: 0·2 %P and exercise; group 0·3S: 0·3 %P and sedentary; group 0·3E: 0·3 %P and exercise.
* A two-way ANOVA was performed with P and exercise as factors. Significance was set at P < 0·05.
† To convert kJ to kcal, divide by 4·184.
In the HP experiment, body weight was significantly different according to P, E and their interaction (Fig. 4(A)). In the sedentary groups, the 0·3 %P showed a higher body weight than that of the other groups. As expected, the groups who were consistently exercising had a significantly lower body weight than the non-exercising groups, and the magnitude of the difference in weight being greatest among the 0·3 %P group (E v. S) (P < 0·001). Effectively, the 0·3 %P exercising group started showing significantly less body weight gain as compared with its sedentary counterpart starting at week 3 (online Supplementary Table S5). Percentage body fat was significantly influenced by P, E and the combined P × E factors, and the pattern of change was very similar to that of body weight, noting a lowest % body fat in the 1·2 %P exercising group (P = 0·01) (Fig. 4(B)) (see online Supplementary Table S6 for details). The sedentary groups displayed a lower %LBM than their exercising counterparts, and the extent of this difference was highest among the 0·3 % and 1·2 %P groups (S v. E) (P < 0·001) (Fig. 4(C)) (see online Supplementary Table S7 for details).

Fig. 4. Expt 2 – Effect of phosphorus and exercise on body weight and composition measures. Weekly body weight gain in g (A), percentage body fat (B) and percentage lean body mass (C), of the six groups of rats over the 6-week experimental period. Group 0·3S: 0·3 %P and sedentary; group 0·3E: 0·3 %P and exercise; group 0·6S: 0·6 %P and sedentary; group 0·6E: 0·6 %P and exercise; group 1·2S: 1·2 %P and sedentary; group 1·2E: 1·2 %P and exercise. Data are expressed as mean values and standard deviations of all values. A multiple-way ANOVA (general linear model) was performed with time, phosphorus and exercise as factors. Significance was set at P < 0·05. (A–C) ![]() , 0·3S;
, 0·3S; ![]() , 0·3E;
, 0·3E; ![]() , 0·6S;
, 0·6S; ![]() , 0·6E;
, 0·6E; ![]() , 1·2S;
, 1·2S; ![]() , 1·2E.
, 1·2E.
At the level of energy stores (Table 2), it was evident that the exercising groups had significantly lower ΔEst as compared with the sedentary groups (P < 0·001). The differences in the accumulation of energy stores were mainly attributed to lower gains in Fatst, though LBMst gains were also lower but to a lesser extent. Noteworthy is the result that the proportion of accumulated energy balance coming from LBM (%LBMst) was significantly higher in all the exercising groups (P = 0·004).
Table 2. Expt 2 – Effect of phosphorus and exercise on body energy stores in the six groups of rats over the 6-week experimental period*
(Mean values and standard deviations)

E, exercise; Est, energy stores; Fatst, fat stores; LBMst, lean body mass stores; group 0·3S: 0·3 %P and sedentary; group 0·3E: 0·3 %P and exercise; group 0·6S: 0·6 %P and sedentary; group 0·6E: 0·6 %P and exercise; group 1·2S: 1·2 %P and sedentary; group 1·2E: 1·2 %P and exercise.
* A two-way ANOVA was performed with P and exercise as factors. Significance was set at P < 0·05.
† To convert kJ to kcal, divide by 4·184.
Plasma analysis
In the LP diets experiment, plasma glucose and insulin levels were found to be similar among the groups (Table 3). Total cholesterol concentrations was significantly lower in the exercising groups (P = 0·04). Plasma TAG showed a similar trend though failed to reach significance. Plasma P was not affected by P content of the diet, while PUN was reduced with increased P content of the diet (P = 0·004). No changes in plasma PTH or FGF-23 were detected between the different groups.
In the HP experiment, plasma glucose and insulin were similar between the various groups (Table 4). Both plasma total cholesterol (P = 0·001) and TAG (P = 0·001) were significantly reduced in the groups who exercised regularly. Increased P content of the diet was associated with a reduction in plasma P (P < 0·001) and an increase in PUN (P = 0·001), which was also significantly affected by the joint P × E factors (P = 0·016). Serum PTH and FGF-23 levels remain unchanged in response to increasing dietary P level.
Table 3. Expt 1 – Effect of phosphorus and exercise on blood metabolites in the six groups of rats*
(Mean values and standard deviations)

E, exercise; TC, total cholesterol; PUN, plasma urea N; PTH, parathyroid hormone; FGF-23, fibroblast growth factor-23; group 0·1S: 0·1 %P and sedentary; group 0·1E: 0·1 %P and exercise; group 0·2S: 0·2 %P and sedentary; group 0·2E: 0·2 %P and exercise; group 0·3S: 0·3 %P and sedentary; group 0·3E: 0·3 %P and exercise.
* A two-way ANOVA was performed with P and exercise as factors. Significance was set at P < 0·05.
Table 4. Expt 2 – Effect of phosphorus and exercise on blood metabolites in the six groups of rats*
(Mean values and standard deviations)

E, exercise; TC, total cholesterol; PUN, plasma urea N; PTH, parathyroid hormone; FGF-23, fibroblast growth factor-23; group 0·3S: 0·3 %P and sedentary; group 0·3E: 0·3 %P and exercise; group 0·6S: 0·6 %P and sedentary; group 0·6E: 0·6 %P and exercise; group 1·2S: 1·2 %P and sedentary; group 1·2E: 1·2 %P and exercise.
* A two-way ANOVA was performed with P and exercise as factors. Significance was set at P < 0·05.
Discussion
Our data show that the relation between dietary P content and body weight or energy stores is not linear. Highest body weight and ΔEst were at 0·3 %P and decreased with lower or higher levels. EI did not follow the same pattern, it was the lowest in the 0·1 and 0·2 %P groups and the highest in the 0·6 and 1·2 % groups. Yet, the lower body weight gain and ΔEst of the 0·1 and 0·2 %P groups were the result of a combination of reduced EI as well as EEf. While the lower body weight gain and ΔEst of the 0·6 and 1·2 % groups were attributed to an increase in TEEx that resulted in a decrease in EEf.
In our experiments, ΔLBMst were similar between the groups (0·1 to 1·2 %P). Hence, the change in body weight and ΔEst were mainly due to differences in FM, as LBM was preserved.
Our results are in line with others, as studies in animals have shown that diets deficient in P are associated with a lower food intake and weight gain(Reference Laouari, Kleinknecht and Habib31). Besides, a comparable rising trend in food intake and EEf was previously demonstrated when P was increased gradually from very low to standard P level of 0·3 %, which can be related to the capability of young animals to regulate their food intake in order to support their nutritional requirements for growth and maintenance(Reference Hammoud, Jabbour and Tawil30). However, at higher intakes of P (>0·3 %P), food intake was shown to be inconsistent among different studies. No difference in food intake was noted in rats when P level spanned from 0·2 to 1·2 %(Reference Abuduli, Ohminami and Otani32). Whereas in humans, lower intakes were reported on the long-run when main meals were supplemented with 375 mg P(Reference Ayoub, Samra and Hlais33), and on the short-term when ad libitum food intake was reduced following a 500 mg P supplement(Reference Obeid, Dimachkie and Hlais34). In our experiment, food intake continued to rise as the P level increased in the diet. Nonetheless, the higher EI was accompanied by a significant elevation in TEEx and a reduction in EEf which explains the lower weight and fat gains. In agreement, rats fed a high P diet displayed an elevated thermogenesis, which was manifested by an increase in the expression of UCP-1 in brown adipose tissue(Reference Abuduli, Ohminami and Otani32). Bassil et al.(Reference Bassil and Obeid35) have also demonstrated an implication of P in energy metabolism, altering substrate oxidation and increasing thermogenesis in healthy individuals. In effect, P ingestion with high carbohydrate meal elevated post-prandial EE in both lean and obese subjects(Reference Assaad, El Mallah and Obeid6). Similarly, P supplementation leads to an increase in RMR and post-prandial EE in overweight(Reference Nazar, Kaciuba-Uściłko and Szczepanik2) and obese women(Reference Jaedig and Henningsen3,Reference Jaedig, Lindgärde and Arborelius4) . Moreover, in both animal and human studies, a reduction in RQ upon P supplementation indicates preferential utilisation of fat for energy production resulting in enhanced EE and reduced body weight gain and lower fat accumulation(Reference Assaad, El Mallah and Obeid6,Reference Abuduli, Ohminami and Otani32) . In support, numerous studies have shown that P supplementation affects fat metabolism. Imi et al.(Reference Imi, Yabiki and Abuduli36) have demonstrated that a high P diet (1·5 %P) results in less fat accretion in rats and a reduction in white adipose tissue activity by increasing lipolytic gene expression and decreasing lipogenic gene expression in visceral fat tissue. Similarly, rats ingesting 1·2 %P diet for 8 weeks had lower visceral fat accumulation and lower hepatic lipid synthesis due to altered m-RNA expression of lipogenesis-related genes(Reference Abuduli, Ohminami and Otani32). In addition, P supplementation for 12 weeks in obese and overweight subjects has significantly improved body weight, BMI and waist circumference indicating a reduction in abdominal obesity(Reference Ayoub, Samra and Hlais33).
Two plasma parameters responded to dietary P levels. The first was PUN, a marker for protein breakdown. In the LP diet experiment, PUN decreased significantly as P intake increased to 0·3 %P, which reflects an enhanced protein anabolism as P intake increases from deficient to standard level. This is in accordance with Raji et al.(Reference Ragi, El Mallah and Toufeili37), who revealed that P-containing diets were associated with a reduced PUN and an increase in body protein %, hence implying that protein metabolism was affected by the P level in the diet. Correspondingly, P supplementation of low-protein diets was able to improve total body protein content and reduce urinary nitrogen excretion and thus improved protein anabolism(Reference Hammoud, Jabbour and Tawil30). At higher P intake, although the PUN was significantly different, the pattern of values was inconsistent. As ΔLBMst were found to be similar among different levels of P intake, there is a possibility that the higher PUN observed in the 0·6 and 1·2 %P may be attributed to both a higher protein breakdown and subsequent protein anabolism, which may suggest a higher protein turnover in these groups. Though not directly measured in this study, we speculate that a probable higher protein turnover, which is known to be energy expensive, may have contributed to the elevation of TEEx observed in the HP diets experiment.
The second plasma parameter to examine is plasma P. Our study found that at low levels of P intake, plasma P levels were not affected. Yet, the higher P levels in the diet resulted in lower serum P levels and showed no difference in the phosphaturic hormones PTH and FGF-23, knowing that an elevated serum P generally results in an elevation of these two parameters(Reference Calvo38). In agreement, Kremsdorf et al.(Reference Kremsdorf, Hoofnagle and Kratz39) have shown that a 33 % increase in dietary P does not result in significant changes in plasma P level and its regulatory hormones (PTH and FGF-23). Another study has shown no difference in fasting plasma P concentration upon ingestion of different P levels in the diet; however, the random plasma P level was significantly higher in the high dietary P group as compared with the control(Reference Imi, Yabiki and Abuduli36). This confirms that an elevated P intake is not associated with an elevated fasting serum P, which is in line with findings in humans where serum P was found to be a poor indicator of dietary P intake(Reference de Boer, Rue and Kestenbaum40,Reference Mataix, Aranda and López-Jurado41) . Yet, dietary P can affect post-prandial P levels(Reference Assaad, El Mallah and Obeid6), where P is required for metabolic processes and is involved in the elevation of post-prandial EE(Reference Assaad, El Mallah and Obeid6,Reference Bassil and Obeid35) .
Starting with the effect of exercise on the various parameters, the data presented in the current study demonstrated a significant reduction in plasma measurements of total cholesterol and/or TAG in the exercising groups. This is consistent with the therapeutic and preventive effects of exercise on improving cardio-metabolic parameters(Reference da Silva Coqueiro, de Jesus Soares and Pereira42). Structured exercise denotes weekly prescribed or programmed exercise intervention, which in the current study consisted of 30 min of moderate-intensity supervised aerobic training (equivalent to 60 %VO2 max) five times per week for 6 weeks.
Our research also demonstrates that structured exercise results in a lower fat accumulation and maintains a higher %LBM. In the LP diets experiment, the lower body weight was mainly related to the reduction in EI rather than the effect of exercise on EE. Conversely, in the HP exercising groups, the lower body weight (including ΔEst and ΔFatst) was highly attributed to an increase in TEEx and a decrease in EEf. The lower fat and weight gains in the exercising groups are in line with previous observations, where dynamic aerobic exercise training was found to significantly reduce body weight, fat percentage and adiposity index(Reference Thirupathi, da Silva Pieri and Queiroz43) and adipogenesis-related markers(Reference Rocha-Rodrigues, Rodríguez and Becerril44). Additionally, structured physical exercise is known to maintain or improve LBM(Reference Andersson, Xu and Rebuffe-Scrive45).
An important finding of this research is related to the effect of a moderate-intensity exercise routine on TEEx and energy compensation either through changes in EE and/or EI. Although there were no direct measurements of TEEx, our data show that in the LP experiment, the increase in EE as a result of structured exercise did not result in an overall increase in calculated TEEx as would be expected, which was probably due to a reduction in spontaneous activity as a means of compensation for the energy expended during exercise. Essentially, a decrease in NEAT and an increase in sedentary behaviour were reported following exercise(Reference Melanson20). Additionally, King et al.(Reference King, Caudwell and Hopkins19) have shown a reduction in NEAT following routine exercise sessions, and as a result of this compensation, TEEx remains unchanged in response to physical exercise(Reference Jakicic, Marcus and Gallagher46).
On the other hand, in the HP experiment, the energy expended during exercise was partially compensated for by an increase in EI shown in the 0·6 % and 1·2 %P exercising groups. In line, Pinto et al.(Reference Pinto and Shetty11) have shown that exercised rats had significant elevation in EI following exercise training. Moreover, on average, humans compensated for around 30 % of the exercise-induced energy deficit by increasing their EI(Reference Whybrow, Hughes and Ritz15,Reference Stubbs, Hughes and Johnstone47) , as they tend to experience an increase in hunger(Reference Myers, Dalton and Gibbons48), and an elevated drive to eat(Reference Riou, Jomphe-Tremblay and Lamothe14). Nonetheless, in contrast to the LP experiment results, the exercising groups of the HP experiment demonstrated a significantly higher TEEx which may be attributed to a higher NEAT as rats remained active post-exercise. This implies that there was no compensation for the energy cost of exercise through less daily activity. This is in agreement with research reporting no reduction in NEAT in response to prescribed exercise training(Reference Washburn, Lambourne and Szabo49) and no increase in sedentary behaviour following supervised aerobic exercise(Reference Myers, Dalton and Gibbons48). Moreover, Alahmadi et al.(Reference Alahmadi, Hills and King18) have shown that walking exercise even had a delayed effect on increasing NEAT.
Conclusion
It is the first time that the combination of P and regular E training were studied to determine their effect on energy balance, energy compensation and body composition. We can infer from the above discussion that, with the ingestion of low P levels, NEAT seems to be lowered, as the TEEx in exercising rats was shown to be similar to the sedentary ones. This can mean that the low P availability affects the way in which rats respond to daily movement, thereby increasing their sedentary behaviour and reducing their spontaneous activity. On the other side, at higher P intakes (0·6 and 1·2 %), although there was a partial compensation evident in an elevated EI in the exercising group, they displayed a higher TEEx. This means that the energy deficit induced by exercise was not compensated for by reduced NEAT or increased sedentary behaviour. Hence, an increased P intake reduced the bodily ability to compensate for the exercise-induced energy deficit. This, in turn, increased TEEx which further enhanced body composition measures. The cost of elevated TEEx appears to have been derived from fat stores and not LBM as the data showed that the 1·2 %P exercising group had the lowest fat accretion and the best maintenance of %LBM throughout the experimental period.
Future research can investigate the combined effect of P and E in obese rats, or the joint effect of P and other forms of structured exercise (resistance exercise or vigorous aerobic exercise) on energy balance and body composition.
Acknowledgements
This work was supported by the American University of Beirut Research Board.
S. W. S. formed the research question; O. A. O. designed the experiment; S. W. S. and M. E. R. carried out the experiments and conducted the laboratory analysis; S. W. S., M. E. R., A. A. E. and O. A. O. analysed the data; all authors were involved in writing the paper and had final approval of the submitted and published versions.
The authors declare that there are no conflicts of interest.
Supplementary material
For supplementary material referred to in this article, please visit https://doi.org/10.1017/S0007114520004985


