The UN in its Millennium Development Goals (MDG) aims to eradicate extreme poverty and hunger in the period 1990–2015 and to halve the proportion of people who suffer from hunger and malnutrition(1). Malnutrition is highly associated with infant and child mortality, which are the two indicators used for monitoring the progress to achieve another MDG goal to reduce infant and child mortality.
The UN has also reported that more than one-third of the world's population suffers from micronutrient deficiencies, particularly vitamin A, iodine, folate and Zn deficiencies. Malnutrition includes not only underweight due to insufficient energy and protein intakes, but also micronutrient deficiencies due to insufficient food intakes. These deficiencies can affect a child's physical and cognitive development and increase the risk of infection(Reference Ban2). This means that reducing malnutrition is a very important aspect of national development to improve community welfare.
Although the occurrence of childhood malnutrition has been declining in Indonesia since the 1990s, the current prevalence of malnutrition is still high compared with that in the neighbouring countries(Reference Le Nguyen, Le Thi and Nguyen Do3, Reference Poh, Ng and Siti Haslinda4). The government of Indonesia has mainstreamed the goals and targets of MDG in all the phases of annual, mid-term and long-term developments from planning and budgeting to implementation. The MDG's report for Indonesia 2010(5), based on data from Riskesdas 2010(6), indicates that the prevalence of underweight in children aged < 5 years is 17·9 %. The prevalence of thinness, defined as BMI-for-age z-score (BAZ) < − 2 sd, in school-aged children (6–12 years) is 12·2 %. The prevalence of stunting in children aged < 5 years and those aged 6–12 years is 35·6 % and is much higher than that of underweight(6). The prevalence of underweight among children aged < 5 years has declined from 37·5 % in 1989, 26·4 % in 1999, 18·4 % in 2007, to 17·9 % in 2010(6, 7).
However, there are no recent national data available on micronutrient status and risk factors associated with nutritional problems in children. A national study on vitamin A was conducted in 1991 and on iodine deficiency in 2002(7, 8). Studies on Fe-deficiency anaemia are not comprehensive, covering limited subjects and areas only(9). Therefore, for the purpose of nutrition planning, monitoring and evaluation, there is an urgent need for comprehensive and in-depth nutrition information at the population level. The information needed includes anthropometric nutritional status indices, biochemical parameters, physical activity patterns, dietary intakes and related risk factors associated with nutritional status such as morbidity, and the consequences of undernutrition such as psychometric and cognitive development.
The objective of the present study was, therefore, to provide national representative data on physical growth and development, physical activity, food consumption and food habits, cognitive development and blood chemistry for healthy children aged 0·5–12 years. The results of anthropometric variables, micronutrient status (Hb, ferritin, and vitamins A and D) and selected macronutrient and micronutrient intakes will be discussed in the present study. The present study is part of the South East Asian Nutritional Survey (SEANUTS), a multi-centric study simultaneously being carried out in 16 744 children, aged 0·5–12 years, in four countries(Reference Schaafsma, Deurenberg and Calame10).
Experimental methods
The SEANUTS in Indonesia used a cross-sectional study design in forty-eight (out of 440) districts/cities in 2011. Multistage cluster sampling, stratified for geographical location, sex and age, was carried out. The selection of districts (forty-eight), subdistricts (ninety-six) and villages (ninety-six) was based on probability proportional to size to be representative at the national level(Reference Lwanga and Lemeshow11–Reference Varkeuisser, Pathmanathan and Brownlee13).
The study population consisted of 7211 children aged 6 months to 12 years, who lived in both rural and urban areas. Children were clustered into three age groups: 0·5–1·9; 2·0–4·9; 5·0–12 years. Sample size determination was done to represent these three age groups based on the following formula:
where n is the required sample size, Z 1 − α/2 is the value of the standard normal distribution at the desired CI, p is the estimated prevalence of the key variable of interest and d is the relative precision required.
Underweight and anaemia with prevalence rates of 18·4 and 25·0 %, respectively, were used as the key indicators as they represent both macronutrient and micronutrient problems and are relevant indicators for MDG. Minimum sample sizes of 2180 children for nutritional status and 716 for micronutrient deficiencies per age group were calculated taking into account a confidence level of 95 %, a dropout rate of 10 % and a design effect of 2·0. Inclusion criteria were age between 6 months and 12 years, apparently healthy without signs of physical, clinically mental or clinically genetic disorders as determined by the physician of the local Community Health Centre and willingness to participate in the study. Exclusion criteria were age < 6 months and >12 years.
The study was conducted according to the guidelines laid down in the Declaration of Helsinki, and all procedures involving human subjects were approved by the Committee of Heath Research Ethics, the National Institute of Health Research and Development, the Ministry of Health, Republic of Indonesia, number LB.03.02/KE/6430/2010, and the Ministry of Home Affairs, number 440.02/1751.D.I.
Written informed consent was obtained from all the parents of the subjects or legal guardians, witnessed and signed by village health cadres or village staff. All study procedures were standardised before use and administered by trained personnel, under expert supervision. The present study was registered in the Netherlands Trial Registry as NTR2462.
Body weight was measured with a Seca digital weighing scale (SECA) to the nearest 0·1 kg. Standing height (accurate to 0·1 cm) was measured with a portable Harpenden stadiometer (Holtain) for children aged ≥ 2 years, and length in children aged < 2 years was measured using a horizontal board to the nearest 0·1 cm. BMI (kg/m2) was calculated by dividing the measured weight (kg) by the square of height or length (m). Anthropometric parameters were classified using the WHO growth standards for 0–5 years(14, 15) and the WHO growth reference for 5–19 years(15–Reference Shoham and Duffield17). Weight-for-age z-scores (WAZ), height-for-age z-scores (HAZ), BAZ and weight-for-height z-scores (WHZ) were calculated using the software WHO Anthro version 3.1.0(15) (World Health Organisation, Geneva, Switzerland) for children aged ≤ 5 years. For children aged >5 years, the WHO AnthroPlus version 1.0.3(15) software was used to determine WAZ, HAZ and BAZ. A cut-off point score < − 2·00 sd for HAZ, WHZ and WAZ was used to classify stunting, wasting and underweight, respectively. A cut-off point z-score >2·00 sd or >1·00 sd for BAZ was used to classify overweight and that of >3·00 sd or >2·00 was used to classify obesity for children aged < 5 years and ≥ 5 years, respectively.
Blood samples were collected in 50 % of the randomly selected study areas (villages). Capillary (finger prick using autoclick) blood was collected for children aged 0·5–1·9 years to measure Hb concentration (HemoCue). In children aged ≥ 2 years, venous blood was collected to measure Hb, ferritin and vitamin A and D concentrations. CV were obtained from inter- and intra-assay reproducibility. The samples were analysed at an accredited central commercial clinical chemical laboratory (P Lab). The classification of blood parameter values is based on the internationally accepted standards. Anaemia was defined as Hb concentrations < 115 g/l for children aged 5–11 years and < 110 g/l for children aged 0·5–4·9 years. Serum ferritin concentrations < 12 mg/l for children aged < 5 years and < 15 mg/l for those aged >5 years were used to identify children with depleted Fe stores. Serum retinol concentration < 0·70 μmol/l and circulating 25-hydroxyvitamin D concentration < 50 nmol/l were used as cut-offs to define vitamin A and D deficiencies, respectively(Reference Gibson18–Reference Greer22).
In half of the randomly selected study areas (villages), a 1 d dietary recall was obtained by using standardised questionnaires. Samples of food portions were weighed during data collection to more accurately quantify local foods or food products. Analysis of dietary intake was done using the Nutrisoft program developed by the Food and Nutrition Research Center, using Indonesian food composition tables(23, 24). Dietary intakes were compared with the Indonesian RDA(25).
Statistical analyses were carried out using SPSS (SPSS, Inc.). Weight factors were calculated to extrapolate study participants to the national estimate. The weighing method was based on the actual number of children in each district, age, sex and area of residence. The information on population density, age group, sex and residence (rural/urban) was obtained from the Population Census 2010 Report released by the Indonesian Central Board of Statistics(26). The total population of Indonesia in 2010 was 237 641 326, of which children aged 0·5–12 years were approximately 52 723 020. Using the weight factor applied for each child, the total number given in Table 1 was close to the total population of children aged 0·5–12 years.
Table 1 Number of children who participated in the study by age group, sex and area of residence

Differences between variables in different strata (age group, sex and area of residence) were tested for significance using t tests or ANOVA. The χ2 statistics were used to test for differences in prevalence data across the strata. Data are presented as means with their standard errors or classified according to the internationally accepted standards. The level of significance was set at P< 0·05.
Results
The results of the SEANUTS provide the latest data on nutritional status for a nationally representative sample of Indonesian children. Table 1 reports the number of children who participated in the study as well as the estimated population of Indonesian children represented by the sample in the three age groups. Distribution of participating subjects based on sex ratio and residence (urban and rural) was similar to that in the population.
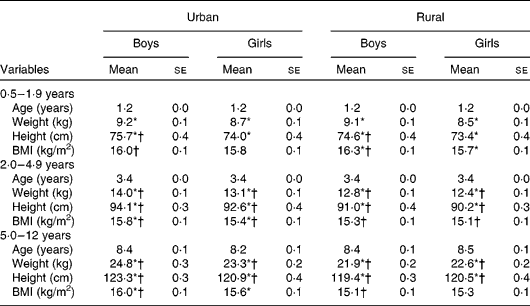
Table 2 reports the means and standard errors for weight, height and BMI of the children. In general, boys are significantly heavier and taller than girls across the three age bands in both urban and rural areas. The mean differences between boys and girls were only 0·4–1·5 kg of weight and 0·9–2·5 cm of height. There was a significant difference in height and BMI between urban and rural children, particularly in the older age groups.
Table 2 Anthropometric characteristics of the children by age group, sex and area of residence (Mean values with their standard errors)

* Mean values were significantly different between the sexes after correction for age (P< 0·5).
† Mean values were significantly different between the urban and rural areas after correction for age (P< 0·5).
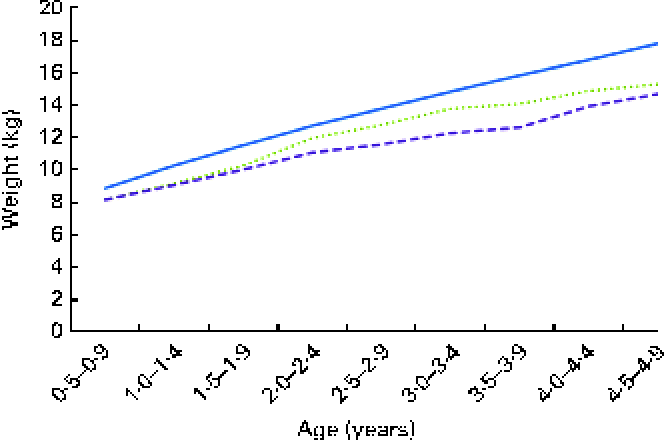
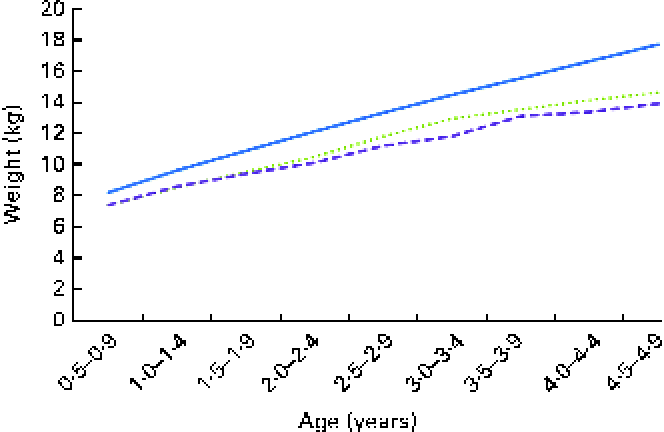
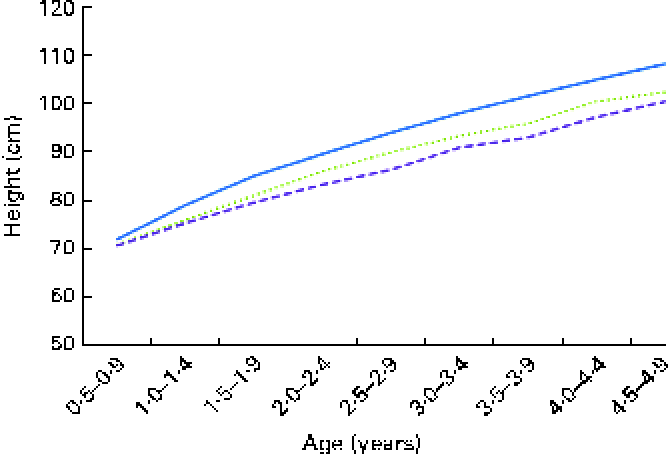
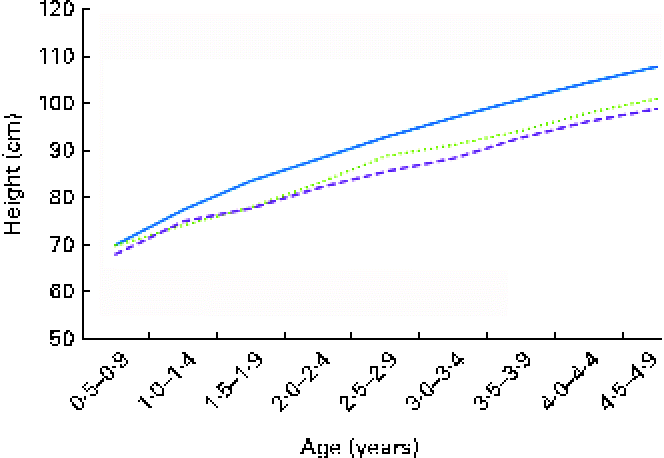
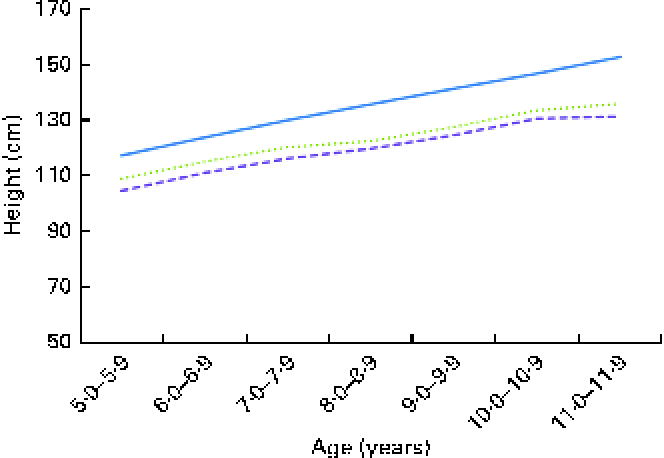
The growth pattern of Indonesian children compared with the WHO standard curves is shown in Figs. 1–8. The mean weight of Indonesian children was slightly below the WHO standard from the age of 6 months onwards and the deviation from the WHO curve was progressively increasing with age in both boys and girls. Rural boys and girls lagged more behind than their urban counterparts, but the differences were small (Figs. 1–4). A similar deviation was observed for height when compared with the WHO growth curves (Figs. 5–8).

Fig. 1 Mean weight of boys aged 0·5–4·9 years. ![]() , WHO;
, WHO; ![]() , urban;
, urban; ![]() , rural. (A colour version of this figure can be found online at http://www.journals.cambridge.org/bjn).
, rural. (A colour version of this figure can be found online at http://www.journals.cambridge.org/bjn).

Fig. 2 Mean weight of girls aged 0·5–4·9 years. ![]() , WHO;
, WHO; ![]() , urban;
, urban; ![]() , rural. (A colour version of this figure can be found online at http://www.journals.cambridge.org/bjn).
, rural. (A colour version of this figure can be found online at http://www.journals.cambridge.org/bjn).

Fig. 3 Mean weight of boys aged 5·0–9·9 years. ![]() , WHO;
, WHO; ![]() , urban;
, urban; ![]() , rural. (A colour version of this figure can be found online at http://www.journals.cambridge.org/bjn).
, rural. (A colour version of this figure can be found online at http://www.journals.cambridge.org/bjn).

Fig. 4 Mean weight of girls aged 5·0–9·9 years. ![]() , WHO;
, WHO; ![]() , urban;
, urban; ![]() , rural. (A colour version of this figure can be found online at http://www.journals.cambridge.org/bjn).
, rural. (A colour version of this figure can be found online at http://www.journals.cambridge.org/bjn).

Fig. 5 Mean height of boys aged 0·5–4·9 years. ![]() , WHO;
, WHO; ![]() , urban;
, urban; ![]() , rural. (A colour version of this figure can be found online at http://www.journals.cambridge.org/bjn).
, rural. (A colour version of this figure can be found online at http://www.journals.cambridge.org/bjn).

Fig. 6 Mean height of girls aged 0·5–4·9 years. ![]() , WHO;
, WHO; ![]() , urban;
, urban; ![]() , rural. (A colour version of this figure can be found online at http://www.journals.cambridge.org/bjn).
, rural. (A colour version of this figure can be found online at http://www.journals.cambridge.org/bjn).

Fig. 7 Mean height of boys aged 5·0–9·9 years. ![]() , WHO;
, WHO; ![]() , urban;
, urban; ![]() , rural. (A colour version of this figure can be found online at http://www.journals.cambridge.org/bjn).
, rural. (A colour version of this figure can be found online at http://www.journals.cambridge.org/bjn).

Fig. 8 Mean height of girls aged 5·0–9·9 years. ![]() , WHO;
, WHO; ![]() , urban;
, urban; ![]() , rural. (A colour version of this figure can be found online at http://www.journals.cambridge.org/bjn).
, rural. (A colour version of this figure can be found online at http://www.journals.cambridge.org/bjn).
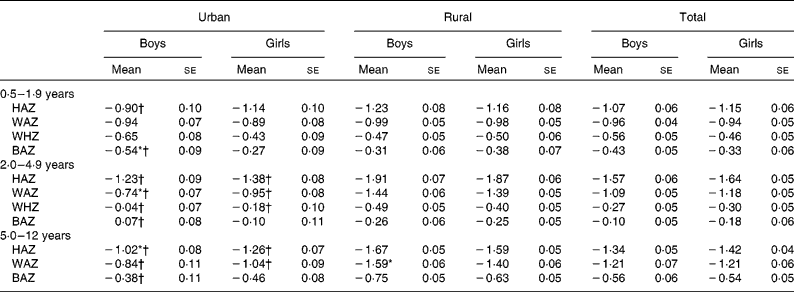
The HAZ, WAZ, WHZ and BAZ, on average, were negative irrespective of age group, sex and area of residence (Table 3) with the exception of BAZ in 2 to 4·9 y old urban boys. In urban children, in the 0·5–1·9-year age group, the WHZ and BAZ differed between the sexes, and in the 2·0–4·9-year age group, a difference was observed in the HAZ, WAZ and BAZ.
Table 3 Anthropometric nutritional status indices by age group, sex and area of residence (Mean values with their standard errors)

HAZ, height-for-age z-score; WAZ, weight-for-age z-score; WHZ, weight-for-height z-score; BAZ, BMI-for-age z-score.
* Mean values were significantly different between the sexes (P< 0·05).
† Mean values were significantly different between the urban and rural areas (P< 0·05).
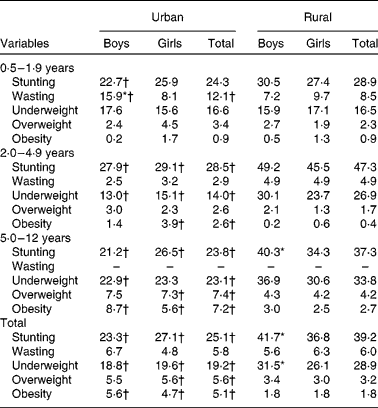
Table 4 highlights that stunting is a major problem in Indonesia with the overall prevalence of 25·1 and 39·2 % in urban and rural areas, respectively. There was no clear trend in the prevalence of stunting across the groups, although it was higher in the 2·0–4·9-year age group. Wasting was prevalent in 5·8 and 6·0 % of the children in urban and rural areas, respectively. Interestingly, the lowest wasting prevalence (2·9 to 4·9 %) was observed in the 2·0–4·9-year age group. Underweight was more prevalent in rural areas (28·9 %) than in urban areas (19·2 %) (Table 4). A higher percentage of children were underweight in the older age groups than those aged < 2 years. Table 4 also reports the prevalence of overweight and obesity in Indonesian children. Overall, the prevalence of overweight and obesity in urban areas was almost twice (10·7 %) that in rural areas (5·1 %), consistent across the age groups. The prevalence did not differ between boys and girls.
Table 4 Percentage of stunting, wasting, underweight, overweight and obesity by age group, sex and area of residence

* Mean values were significantly different between the sexes (P< 0·05).
† Mean values were significantly different between the urban and rural areas (P< 0·05).
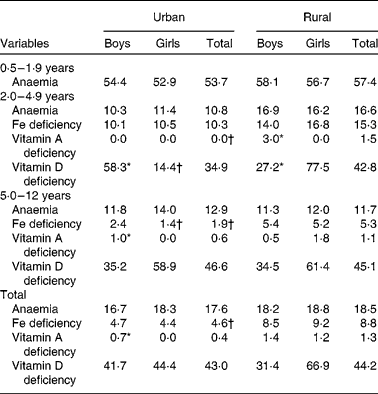
The mean values for biochemical parameters are given in Table 5. Only children with normal values of C-reactive protein and α-glycoprotein, markers of inflammation, were included in the analysis. The table reveals that most of the micronutrient parameters were similar between the sexes and urban/rural areas and were within the normal range, except for vitamin D, with mean values close to than the cut-off value of 50 nmol/l. The prevalence of anaemia ranged from 53 to 58 % in children aged < 2 years (Table 6). Overall, the prevalence of anaemia was 17·6 % in urban areas and 18·5 % in rural areas. The prevalence of anaemia did not differ significantly between the sexes or areas of residence, although a trend towards a higher prevalence was observed in rural areas. Fe deficiency was highest in the 2·0–4·9-year age group and rural areas (Table 6).
Table 5 Biochemical parameters by age group, sex and area of residence (Mean values with their standard errors)

* Mean values were significantly different between the sexes (P< 0·05).
† Mean values were significantly different between the urban and rural areas (P< 0·05).
Table 6 Prevalence (%) of anaemia, iron deficiency, vitamin A deficiency and vitamin D deficiency by age group, sex and area of residence

* Mean values were significantly different between the sexes (P< 0·05).
† Mean values were significantly different between the urban and rural areas (P< 0·05).
The emerging micronutrient problem found in the SEANUTS was vitamin D deficiency. The prevalence was as high as 44 % in both urban and rural areas (Table 6). The overall prevalence of vitamin A deficiency was < 1 %.
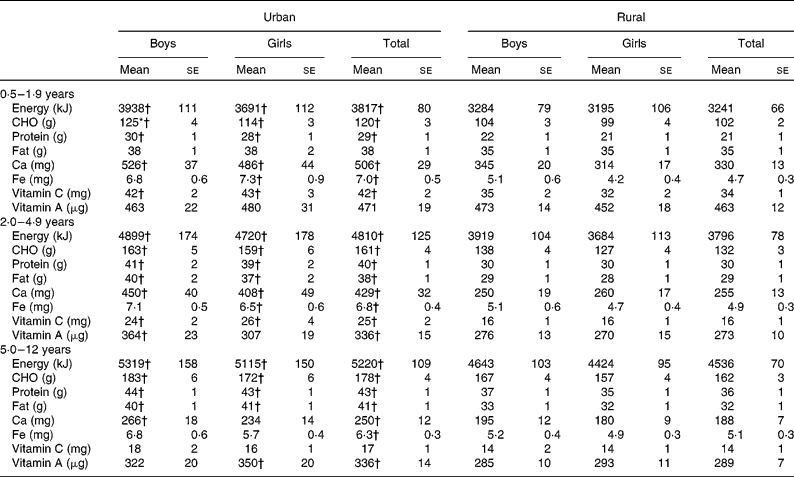
Table 7 reports the average intakes of selected macronutrients and micronutrients (total energy, carbohydrates, protein, fat, Ca, Fe, and vitamins A and D). As shown in the table, in general, boys consume more energy, carbohydrates, fat, protein, Ca and Fe than girls, although the differences are, especially for protein, quite small. Urban children generally have a higher intake of all macronutrients and micronutrients than their rural counterparts.
Table 7 Intakes of selected macronutrients and micronutrients by age group, sex and area of residence (Mean values with their standard errors)

CHO, carbohydrates.
* Mean values were significantly different between the sexes (P< 0·05).
† Mean values were significantly different between the urban and rural areas (P< 0·05).
The average intake of macronutrients and micronutrients does not reflect the level of possible insufficiency in the individual intake of nutrients. Therefore, in Table 8, the percentage of boys and girls with nutrient intakes below the Indonesian RDA is given by age group, sex and area of residence. As shown in the table, the percentage of children with nutrient intakes below the Indonesian RDA was higher in rural areas than in urban areas. Older children were more at risk for not meeting the Indonesian RDA for many nutrients in both urban and rural areas.
Table 8 Percentage of children consuming selected macronutrients and micronutrients below the Indonesian RDA by age group, sex and area of residence

† Mean values were significantly different between the urban and rural areas (P< 0·05).
Discussion
The present study reveals that the growth of height and weight of Indonesian children is below the WHO growth standards. The older the child, the greater the differences compared with the WHO growth standards, which means that faltering of growth starts from the early life of an Indonesian child and continues to the end of elementary school age. Although data from other studies show that there has been an improvement in child growth, undernutrition is still the major problem in Indonesia.
The SEANUTS validates that the major nutritional problem in Indonesia continues to be stunting across the age groups and irrespective of the area of residence (approximately 25 % in urban areas and approximately 39 % in rural areas) compared with underweight and wasting. Stunting has always been related to wealth because proteins, especially protein from animal sources, are relatively expensive. In addition, ensuring dietary diversity and adequate intakes of micronutrients that contribute to a child's growth is difficult, especially for poor families. These may plausibly explain the significant difference in the prevalence of stunting between rural and urban areas in the two younger age groups as observed in the present study as well as in the Riskesdas(6, 27). Interestingly, the proportion of stunted boys in rural areas was higher than that of girls. A possible explanation might be that growth velocity in boys is higher, thus their nutrient requirements are higher. In the absence of adequate nutrient intakes, the likelihood of getting stunted will be higher. Consumption of excess energy by a stunted or wasted child without considering the need of other nutrients for a balanced lean mass synthesis might lead to an excessive synthesis of fat tissue. This may limit the advantage for health or even result in negative health effects at an older age (obesity). It is well known that long-lasting undernutrition not only affects physical linear growth (stunting), but is also likely to have an impact on brain development (WHO, 2009)(Reference Shoham and Duffield17).
Although several nutrition and health programmes have been implemented in Indonesia, there is a need for a breakthrough programme with a focus on life-cycle approach and emphasising on the first 1000 d of life starting from conception. This is a critical period in a child's life because undernutrition during this period can cause irreversible and long-term damage such as decreased intellectual capacity and impaired immune function and physical growth. There is an urgent need for better policies, planning and implementation of a strategy for the first 1000 d of life not only within the health sector but also with collaborative efforts from other sectors of economic and social development.
The prevalence of underweight, including severe underweight, in children aged < 5 years in the present study in 2011 was 19·5 %. In the older age groups, the prevalence of underweight was clearly higher in rural areas, which suggests that underweight is not related to wealth, but that during school age, dietary habits and food intakes as well as lifestyle factors might be important. These overall findings of the present study are in line with those reported by Riskesdas conducted in 2010 (18·4 %) and 2007 (17·9 %)(6, 27). There has been a declining trend of underweight since 1989 in children aged < 5 years. The prevalence of underweight in 1989, 1999, 2007 and 2010 was 37·47, 26·36, 18·4 and 17·9 %, respectively(6, 7, 28). This declining trend suggests the successful implementation of the national programme on underweight and overweight for children aged < 5 years. Since the 1980s, a programme on monthly growth monitoring of children aged < 5 years is being implemented in Indonesia through Posyandu (community health centre). This programme aims to improve the growth of children through the familiarisation and adoption of the WHO growth standard 2006, assessment of monthly child growth monitoring in most of the villages throughout Indonesia in Posyandu (community health post), provision of rice for the poor and free health services for the poor, free complementary feeding during severe undernutrition, and training on (exclusively) breast-feeding and complementary feeding practices(Reference Shoham and Duffield17). However, Riskesdas 2010 has shown that the coverage of this programme has decreased to only 49·4 %, with a wide variation among the provinces and districts ranging from 21 to 86 %. There has also been a decrease in coverage associated with age with monitoring of 68 % in 0–6-month-old children and only 39 % in 48–59-month-old children. There is, therefore, a need to reorganise this programme including nutrition education that can contribute to better child growth.
Although the study reveals that the problem of overweight and obesity in children is not so high compared with that in other countries participating in the SEANUTS(Reference Le Nguyen, Le Thi and Nguyen Do3, Reference Poh, Ng and Siti Haslinda4), there is an increasing trend of overnutrition in Indonesia (10·7 % in urban areas and 5·1 % in rural areas). With the improvement of social and economic progress in Indonesia, it is likely that the prevalence will increase in the near future. Therefore, existing nutrition programmes, particularly nutrition information education on balanced diets, should be reorganisation to prevent the increasing trend of overnutrition.
The present study reports a high prevalence of anaemia (more than 50 %) in children aged < 2 years, a value that is four to five times higher than that in children aged >2 years. These findings are not much different from those of a study of Herman(Reference Herman29), which was conducted in seven provinces in Indonesia and found that 56·5 % of boys and 43·5 % of girls aged < 5 years suffer from anaemia. Several factors could have contributed to the high prevalence of anaemia in the younger age groups such as a poor Fe status during pregnancy and delivery, poor Fe stores in infancy, poor complementary feeding in infants and young children, and poor quality of Fe-containing foods, resulting in low bioavailability of Fe. Fe supplementation programmes for pregnant mothers have been implemented in Indonesia to distribute ninety Fe tablets (ferrous sulphate). The Riskesdas study(6) conducted in 2010 revealed that while the overall coverage of pregnant women was 80·7 %, the compliance was very poor with only 18·0 % taking all the ninety Fe tablets, 36·3 % taking less than thirty tablets and 19·3 % refusing to take the tablets. This highlights the need to improve coverage and compliance by several measures in order to effectively manage anaemia and Fe deficiency.
It was interesting to note that the prevalence of vitamin A deficiency was much lower than (overall 1 %) that reported by previous studies(30). The prevalence of vitamin A deficiency in 2–4·9-year-old children was 1·4 %. The existing programme of providing high-dose vitamin A capsules twice a year (in February and August) for children aged < 5 years may have contributed to this low prevalence. According to Riskesdas 2010(6), the overall coverage of vitamin A programme is 69 % (74 % in urban areas and 66 % in rural areas). The lower prevalence of vitamin A deficiency in urban areas may be attributed to a higher coverage and a better intake of vitamin A from foods in urban areas. A separate study focused on vitamin A status is suggested to reconfirm and validate the results of the present study.
To our knowledge, there is no information on vitamin D deficiency in Indonesia. The SEANUTS study is the first to report a wide prevalence of vitamin D deficiency. However, it has to be kept in mind that the vitamin D status was determined from relatively small (n 276) samples and, therefore, the results should be interpreted with caution. The prevalence of vitamin D deficiency is slightly higher in girls, probably because girls are less likely to play outside the house and hence lack sun exposure. This finding seems to be in line with those of a study conducted in Saudi Arabian children, in which it was found that vitamin D deficiency is common among Saudi Arabian children and is related to both sun exposure and physical activity(Reference Al-Othman, Al-Musharaf and Al-Daghri31). It is also in line with SEANUTS findings in the other countries(Reference Le Nguyen, Le Thi and Nguyen Do3, Reference Poh, Ng and Siti Haslinda4).
The SEANUTS in Indonesia showed that more than half of the children had dietary intakes below the Indonesian RDA. The low intake levels contribute to a high prevalence of undernutrition and low values of biochemical parameters in children in all age groups. The present study shows that the mean energy intakes are 3514, 4282 and 4869 kJ/d (840, 1024 and 1164 kcal/d) for children aged 0·5–1·9, 2·0–4·9 and 5·0–12 years, respectively. Riskesdas 2007(27) has reported that the mean energy intake is 7259 kJ/capita per d (1735 kcal/capita per d) for all age groups including adults. Riskesdas 2010(6) differentiated energy consumption based on the age group. Using a minimum level of energy consumption below 70 % of the Indonesian RDA as suggested by Reutlinger & Alderman(Reference Reutlinger and Alderman32), it was found that the proportions of children having an energy intake below 70 % of the RDA were 23, 34 and 61 % in the age groups 0·5–1·9, 2·0–4·9 and 5·0–12 years, respectively. Another study has shown that weaning diets met only 50 % of the energy and protein needs and that only 9·5 % of poor families fed their children according to the best practice guidelines (USAID, 2010)(15). SUSENAS (National Socioeconomic Survey) conducted in 2009(30) indicated that child-feeding practices in Indonesia remain inadequate in almost all children. Thus, low dietary intakes as those found in the present study are likely to contribute to the high prevalence of underweight. MDG's report of Indonesia 2010(5) reveals that the dietary energy consumption of 62 % of the population is below the minimum level (8368 kJ/capita per d (2000 kcal/capita per d)).
In summary, the data of the SEANUTS reveal that Indonesia suffers a double burden of malnutrition. The main problems are the high prevalence of stunting and underweight across all age groups and a high prevalence of Fe-deficiency anaemia in children aged < 2 years. There is a need for better policies, planning and implementation of health and nutrition programmes through the revitalisation and redirection of the existing programmes. Alternative strategies to implement life-cycle approaches of nutrition programmes, particularly during the first 1000 d of life, are also warranted to combat these deficiencies and achieve MDG. It is also essential to monitor and prevent the growing trend of overnutrition, overweight and obesity to ensure a healthy adult population.
Acknowledgements
The authors are indebted to FrieslandCampina for providing funding for the present study; PT Frisian Flag Indonesia representatives, particularly Victoria Valentina; and Persagi, Anne Schaafsma, Paul Deurenberg, I. K., Wim Calame and Panam Parikh for their valuable guidance and suggestion in designing the study protocol, preparation, implementation, monitoring, data management and analysis of the study. The authors are also indebted to the government and health representatives at all levels for their contribution to the study as well as to all the children and their families for their willingness to participate in the present study. The authors' contributions are as follows: S. S., B. B., H. H., F. E., M. S., Y. W., E. S., E. R., G. S. and S. N. S. conceived and designed the study and were involved in the data analysis, interpretation and drafting of the manuscript; S. S. was the principal investigator; I. K. was involved in the monitoring of the study as well as in the drafting of the manuscript. All authors contributed to the writing of this manuscript. The study was sponsored by FrieslandCampina, but it had no influence on the outcome of the study. None of the authors or the research institute (Persagi) had any conflict of interest.
This paper was published as part of a supplement to the British Journal of Nutrition, the publication of which was supported by an unrestricted educational grant from Royal FrieslandCampina. The papers included in this supplement were invited by the Guest Editor and have undergone the standard journal formal review process. They may be cited. The Guest Editor appointed to this supplement is Dr Panam Parikh. The Guest Editor declares no conflict of interest.


