


Currently, the Japanese government promotes a new type of travelling, called ‘health tourism’, which encourages individuals to visit nature-rich areas and taste local cuisines in an effort to promote and maintain people’s health. As part of the Health Tourism Project, we created a new weight loss programme, which consists of a trip with overnight stays and combines the pleasure of sightseeing with health promotion( 1 ). The weight loss programme includes exercise, leisure activity, and low-energy intake (EI) using traditional Japanese food culture. With this programme, individuals can increase their total energy expenditure (TEE) for weight loss, attributed to the intervention’s design (7-d physical activity and diet boot camp), whereas enjoying the scenery, culture of the location and food, and participating in leisure and physical activity.
To achieve body weight loss, it is important to reduce EI, increase TEE, or combine these factors to create a negative energy balance (EB)( Reference Schoeller 2 ). Increasing physical activity is an effective means to increase TEE, and energy restriction is needed to reduce EI. A negative EB induces fat mass (FM) and/or fat-free mass (FFM) loss( Reference Heymsfield, Gonzalez and Shen 3 ). Effective weight loss programmes decrease FM while maintaining or moderately decreasing FFM to treat those who are overweight, obese and/or have the metabolic syndrome. Previous studies have indicated that weight loss programmes that include an increase in physical activity improve the effectiveness of FM loss and attenuate FFM loss during weight loss( Reference Delany, Kelley and Hames 4 , Reference Stoner, Rowlands and Morrison 5 ).
Several exercise modalities are recommended to prevent and treat excessive weight. Running, which is a whole-body exercise, can more easily increase energy expenditure (EE) compared with other exercises( Reference Margaria, Cerretelli and Aghemo 6 ). Slow jogging at a speed similar to that of walking (3·0–6·0 km/h) has also received attention( Reference Tanaka and Jackowska 7 ), because it can also produce an EE about twice as much as that of walking( Reference Ikenaga, Yamada and Kose 8 ). Moreover, intermittent exercise, which appears easier to perform and acquire as an active habit in some individuals, can also play a role in the prevention and management of unhealthy weight( Reference Ando, Usui and Ohkawara 9 ). Hence, the combination of slow jogging with intermittent walking may be a more beneficial exercise intervention than walking alone to reduce FM, particularly in elderly people who have participated in a similar exercise programme( Reference Ikenaga, Yamada and Kose 8 ).
Japan is known for a long life expectancy, and the prevalence of overweight and obese individuals is the lowest among the Organisation for Economic Co-operation and Development countries( 10 ). Washoku, a traditional dietary culture in Japan, was added to the United Nations Educational, Scientific, and Cultural Organization’s roster of intangible cultural heritages in December 2013( 11 ). This Japanese food culture, which could be associated with the low prevalence of overweight and obese individuals and long life expectancy in Japan, is known worldwide( 10 ). Moreover, most traditional Japanese meals are cooked with salt, soya and natural stock. Cooking oil is rarely used in order to enjoy the original taste of the ingredients, which makes them low EI meals( Reference Ninomiya 12 ). Nevertheless, satisfaction is high with traditional Japanese food, especially traditional Okinawan low EI cuisine (before being Americanised), which is unique and very important for a healthy lifestyle( Reference Willcox and Willcox 13 ). Thus, Okinawan cuisine may potentially contribute to weight loss in individuals classified as overweight or obese, and for individuals who want to improve their body composition while remaining cautious of salt intake.
This study aimed to evaluate the effect of a newly developed, 1-week health tourism programme, that involved slow jogging and many leisure activities to increase TEE, and energy restriction without water restriction, on weight, body composition and health outcomes. In addition, this study aimed to determine the short-term efficacy of the programme on weight for 12 weeks after the programme. We hypothesised that the Health Tourism weight loss programme would produce energy deficiency and FM decreases, even after only 1 week, and in turn, further improve health outcomes.
Methods
Subjects
This study, called the ‘Okinawa Health Tourism Study’, was conducted three times between 2014 and 2015. Participants stayed at a hotel in Okinawa for 1 week and received training and meals. This study was conducted according to the guidelines laid down in the Declaration of Helsinki and all procedures involving human subjects/patients were approved by the Ethics Committee of Fukuoka University in Japan (approval no.: 14-08-01). Written informed consent was obtained from all subjects/patients. This study was registered under title ‘Effect of a short-term health tourism on body composition, energy metabolism and aerobic capacity’ (registration no. UNIM-CTR UMIN000028592; URL: https://upload.umin.ac.jp/cgi-open-bin/ctr_e/ctr_view.cgi?recptno=R000032722).
Data on age, current and past body mass and health history were initially obtained via telephone interview or email for screening purposes. Subjects who passed the initial screening provided written informed consent. As a result, thirty-six men and women, who were willing to lose body mass, participated: twenty subjects with ‘healthy-weight’, defined as BMI <25·00 kg/m2 (men: n 9, women: n 11; age: 46 (sd 17) years (range: 23–67 years); height: 165 (sd 9) cm) and sixteen subjects with ‘excess-weight’, defined as BMI ≥25·00 kg/m2 (men: n 10, women: n 6; age: 50 (sd 14) years (range: 24–60 years); height: 164 (sd 9) cm). The subjects were not using any medications affecting glucose and lipid metabolism (to avoid potential confounding effects on weight change), had no thyroid and heart disease, were aged ≥20 years, and had self-reported weight stability (<5·0 % change in body mass over the previous month). Exclusion criteria included pregnancy, lactation and amenorrhea (absence of three or more consecutive menstrual cycles). All subjects completed the programme and participated in the examinations before and after the programme. After completing the 1-week programme, the participants measured their own weight at the prescribed time and date.
Study design
The experimental protocol and Health Tourism weight loss programme timelines are described in Fig. 1(a) and 1(b). Subjects performed 1 h of intermittent slow jogging exercise three times per d: early in the morning, at noon and in the evening. They performed the exercise training using the intermittent slow-jogging method( Reference Tanaka and Jackowska 7 ). They also performed leisure physical activities or sports two to three times per d during a predetermined session. These activities included sea kayaking, diving, traditional dancing, sightseeing with walking, performing agricultural experiments and other recreational activities (Fig. 1(b)). All subjects aimed to achieve at least 30 000 steps/d using a pedometer with a tri-axial accelerometer (ACC) (Actimarker EW4800; Panasonic Electric Works Co., Ltd)( Reference Murakami, Kawakami and Nakae 14 ). The ACC was used to assess physical activity level (PAL; PALACC), step counts, physical activity duration, and metabolic equivalents (MET) during the programme. Presentations about exercise and/or lifestyle diseases were given at least twice in the evening as part of the health tourism programme.
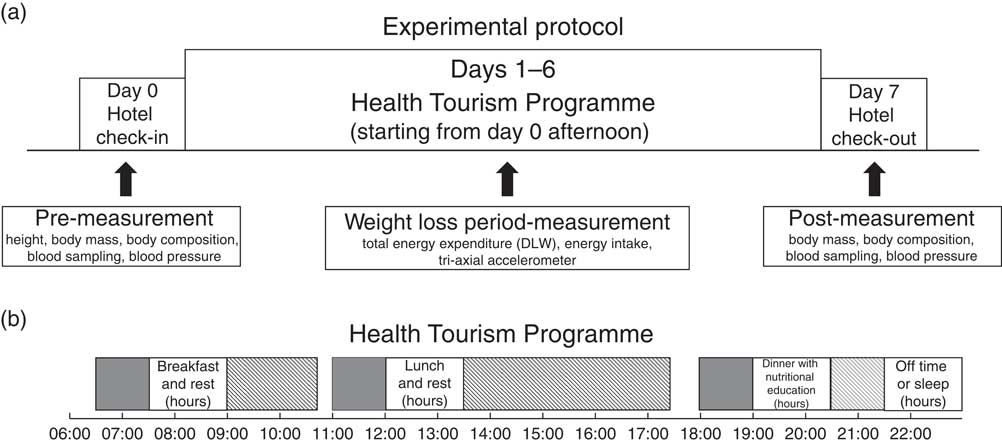
Fig. 1 Timelines of the (a) experimental protocol and the (b) Health Tourism weight loss programme. Leisure activity sessions included sightseeing with walks or runs, golf, swimming in the pool, agricultural experiences, walking or football on a beach, cycling, hiking, sea kayaking, scuba diving, skin diving, traditional dancing, table tennis, unihoc, traditional culture experiences and stretching. DLW, doubly labelled water; ![]() , 1-h jogging session;
, 1-h jogging session; ![]() , leisure activity session.
, leisure activity session.
Exercise intervention protocol
Intermittent exercise was used in the programme, which consisted of 60 s of slow jogging and 30 s of walking in a single set, and was repeated 40 times per exercise session( Reference Ikenaga, Yamada and Kose 8 ). The 60-min exercise session was controlled using a musical device. Subjects performed 180 min of the exercise protocol per d, under the supervision of an exercise trainer. The exercise intensity was set at a lactate threshold (LT) determined from an incremental exercise test completed on day 0, as described in a previous study( Reference Mori, Ayabe and Yahiro 15 ). The intensity of slow jogging was controlled at the LT intensity; all subjects were supervised and monitored by a health fitness trainer and exercise coordinator throughout the programme.
Energy restriction protocol
For each subject, registered dietitians calculated the EI and macronutrient (fat, protein and carbohydrate) intake by food weighing before and after meals, created individualised meal plans, and provided all energy-restricted foods three times per d. The target EI was calculated as ideal body weight (kg), height in m2×22 (BMI in kg/m2), by 84 kJ (20 kcal) for each individual( Reference Rodriguez, Di Marco and Langley 16 ). This EI calculation was based on the most severe energy-restricted diet in the 2016 Japanese Guidelines for the Management of Obesity Disease. Meals were categorised and targeted as follows: 628 kJ (150 kcal) (green smoothie), 1464 kJ (350 kcal) (bread and soup) and 2092–3766 kJ (500–900) kcal (Japanese diet, including Okinawan foodstuff) for breakfast, lunch and dinner, respectively (Table 1 and online Supplementary material S1). Dieticians explained and used the dinner for a nightly nutritional lecture. They first introduced the low-energy dinner, but promoted the necessity of satisfaction. For example, the dietitian introduced a low energy food as an alternative to a high-energy food, indicated how much energy was in each of the foods, and also taught the cooking method at the dinner lecture. Participants weighed their own rice and adjusted the serving, as necessary. Participants also learned EB concepts. With regards to EI, protein intake was set between 1·20–1·70 g/kg body mass to maintain FFM, according to the recommendation from the American College of Sports Medicine( 17 ).
Table 1 Macronutrient components of each meal (Mean values and standard deviations)
Anthropometry and body composition measurement
All anthropometric measurements were performed with subjects wearing light undergarments only. Height was measured to the nearest 1 cm using a stadiometer on day 0, and body mass was measured to the nearest 0·1 kg using a calibrated balance beam scale (DC-320; Tanita) before and after the programme (days 0 and 7). The subjects refrained from doing exercise and fasted for a minimum of 10 h before the measurement.
Percent body fat was calculated using a stable isotope dilution technique before and after the intervention programme. Subjects were instructed to collect their urine samples on days 0 and 7 (at baseline and 3 and 4 h after baseline for both days) to calculate their total body water (TBW). The TBW calculation, collection methods and validation were described in our previous study( Reference Sagayama, Yoshimura and Yamada 18 , Reference Sagayama, Jikumaru and Hirata 19 ). The dilution space of each subject was obtained from urine 2H enrichments using the following equation:
 $$N\,{\equals}\,\left[ {WA\left( {\delta _{{\rm a}} {\minus}\delta _{{\rm t}} } \right)} \right]\,/\,\left[ {{\rm 18}\!\cdot\!0{\rm 2}\alpha \left( {\delta _{{\rm s}}\! -\delta _{{\rm p}} } \right)} \right],$$
where N (mol) is the dilution space of 2H, W (g) is the amount of tap water used to dilute the dose for analysis, A (g) is the amount of mixed dose administered to the subject, α (g) is the dose diluted for analysis and δ is the enrichment of the dose (a), tap water (t), urine sample after dosing (s) and urine at baseline (p). TBW (mol) was revised as N/1·041( Reference Racette, Schoeller and Luke 20 ). The intra-individual standard deviation was 0·3 kg for both FM change and FFM change estimated from TBW/0·732. In this initial analysis, the estimated changes of FM and FFM using the stable isotope two-compartment model were highly correlated with the three-compartment models with no systematic bias (online Supplementary material S2).
Energy expenditure measurement
TEE was measured for approximately 7 d using the doubly labelled water (DLW) method. Subjects orally consumed a 2H2 18O dose. The bottle was rinsed twice with 30·0 ml of water. Subjects consumed no foods or fluids for 4 h after the isotope dosing, with the exception of 500·0 ml of bottled water that included washout water within 2 h after dosing. The dose composed of approximately 1·25 g/kg of estimated TBW of 20 atom% H2 18O (Taiyo Nippon Sanso) and approximately 0·12 g/kg of estimated TBW of 99·9 atom% 2H2O (Taiyo Nippon Sanso). Estimated TBW for the dose was calculated as 60·0 % of each subject’s self-reported body mass before the investigation. Urine specimens for these specific measurements were collected from all subjects on day 0 (at baseline and 3 and 4 h after baseline), day 6 in the night and day 7 in the morning. All samples were frozen and stored at −20°C in plastic containers tightly wrapped using Parafilm M® (Bemis Co., Inc.) until analysis.
Urine specimens were analysed to measure the elimination rates of stable isotope. Moreover, the isotopic analysis was conducted using isotope ratio mass spectroscopy, as previously described( Reference Rodriguez, Di Marco and Langley 16 ). Carbon dioxide production rates were calculated using the following equation:
 $${\rm rCO}_{{\rm 2}} \,{\equals}\,0\!\cdot\!{\rm 455}{\times}{\rm TBW}{\times}\left( {{\rm 1}\!\cdot\!00{\rm 7}k_{{\rm o}} -{\rm 1}\!\cdot\!0{\rm 41}k_{{\rm d}} } \right),$$
where rCO2 (mol/d) is the rate of carbon dioxide production, TBW was recalculated to obtain the mean value (before and after the intervention) and k o and k d are the rates of 18O and 2H elimination per d, respectively.
TEE was determined using the calculated rCO2 (mol/d)( Reference Schoeller, Ravussin and Schutz 21 ) and estimated respiratory exchange ratio (RER), which was calculated from the food quotient and fat loss estimated by body composition changes( Reference Black, Prentice and Coward 22 ), via a modified Weir formula( Reference Weir 23 ):
 $${\rm TEE}\,{\equals}\,{\rm 22}\!\cdot\!{\rm 4}{\times}\left[ {{\rm 3}\!\cdot\!{\rm 9}{\times}\left( {{\rm rCO}_{{\rm 2}} \,/\,{\rm estimated \,RER}} \right){\plus}{\rm 1}\!\cdot\!{\rm 1}\left( {{\rm rCO}_{{\rm 2}} } \right)} \right].$$
The estimated BMR was calculated using the National Institutes of Health formula, including body mass, height, age and sex, based on Japanese data( Reference Ganpule, Tanaka and Ishikawa-Takata 24 ):
 $$\eqalignno{ {\rm Estimated}\,{\rm BMR}\,{\equals}\, &\left[ {0\!\cdot\!{\rm 1238}{\plus}\left( {0\!\cdot\!0{\rm 481}{\times}{\rm body}\,{\rm weight}\,{\rm in}\,{\rm kg}} \right)} \right]\cr&{\plus}\left( {0\!\cdot\!0{\rm 234}{\times}{\rm height}\,{\rm in}\,{\rm cm}} \right)-\left( {0\!\cdot\!0{\rm 138}{\times}{\rm age}} \right)\cr&- {\rm sex}{\times}0\!\cdot\!{\rm 5473}{\times}\left( {{\rm men},\,{\rm 1};{\rm women},\,{\rm 2}} \right))\cr&{\times}{\rm 1}000\,/\,{\rm 4}\!\cdot\!{\rm 186}. $$
PAL determined using the DLW method (PALDLW) was calculated as follows:
 $${\rm PAL}_{{{\rm DLW}}} \,{\equals}\,{\rm TEE}\,/\,{\rm estimated \,BMR}.$$
Health-related outcomes
Blood samples were obtained from the antecubital vein after a 10-h overnight fast. Biochemistry analysis was performed by SRL Inc. The biochemical parameters included the levels of fasting glucose, TAG, HDL-cholesterol and LDL-cholesterol, as well as systolic and diastolic blood pressure. Analysis of these parameters has been previously described( Reference Yoshimura, Kumahara and Tobina 25 ).
Secondary analysis: short-term efficacy
A secondary analysis was conducted to determine the short-term efficacy of the Health Tourism weight loss programme on body mass at 2, 4 and 12 weeks post-intervention.
Statistical analysis
The results are presented as means and standard deviations. An α of 0·05 was used to denote statistical significance. All analyses were performed using IBM SPSS 23.0 for Mac (IBM Corp.). Means for the programme components (physical activity via ACC and food consumption) were calculated in all subjects. The energy metabolism data were evaluated using an unpaired t test. Data for body weight and composition and health-related outcomes were analysed using a two-way repeated-measures ANOVA with two factors: group (healthy weight v. excess weight)×time (pre-intervention, day 0 v. post-intervention, day 7). Significant within-group differences for time were evaluated using paired t tests, and unpaired t tests were used to evaluate significant between-group differences.
The sample size was originally calculated in accordance with the main objective of the trial: a number of thirty subjects to detect an effect size of 0·80 with an α of 0·05 and a power of 0·95.
Results
Body weight and composition
The changes in body composition are summarised in Table 2. Body mass, BMI, body fat percentage and FM significantly decreased from pre-intervention to post-intervention in each group. No significant interactions (group×time) were observed for any body composition parameters, indicating that changes in body composition (particularly body mass, FM and FFM) were not statistically different between the groups (Fig. 2). Body mass loss was −3·5 (sd 1·3) and −3·5 (sd 1·5) % in healthy-weight and excess-weight individuals, respectively. FM loss was −13·4 (sd 9·0) and −9·2 (sd 4·6) % in healthy-weight and excess-weight individuals, respectively. In addition, FFM did not significantly change from the intervention. After the intervention, interactions (group×time) were observed for body weight regain (P<0·01); however, body weight remained lower than pre-intervention values in both groups (12 weeks post-intervention: healthy weight, −1·7 (sd 4·0) %; excess weight, −6·3 (sd 3·8) %; P<0·01 for both) (Fig. 3).
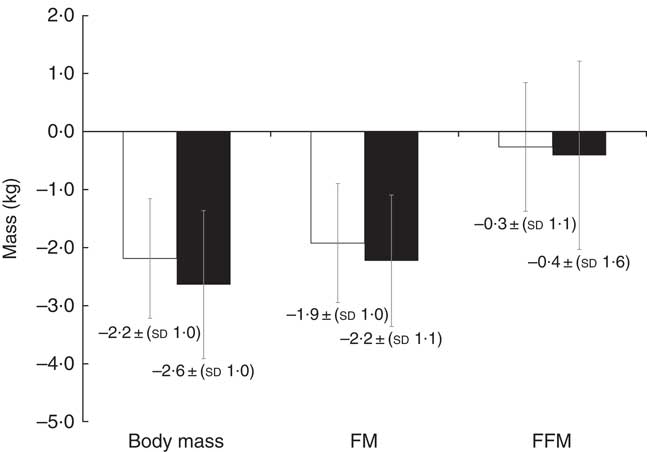
Fig. 2 Changes in body mass and composition in healthy-weight (![]() ) and excess-weight (
) and excess-weight (![]() ) adults. No significant differences in body weight, fat mass (FM) and fat-free mass (FFM) between healthy-weight and excess-weight individuals are noted. Data were analysed using unpaired t test. Values are means and standard deviations.
) adults. No significant differences in body weight, fat mass (FM) and fat-free mass (FFM) between healthy-weight and excess-weight individuals are noted. Data were analysed using unpaired t test. Values are means and standard deviations.
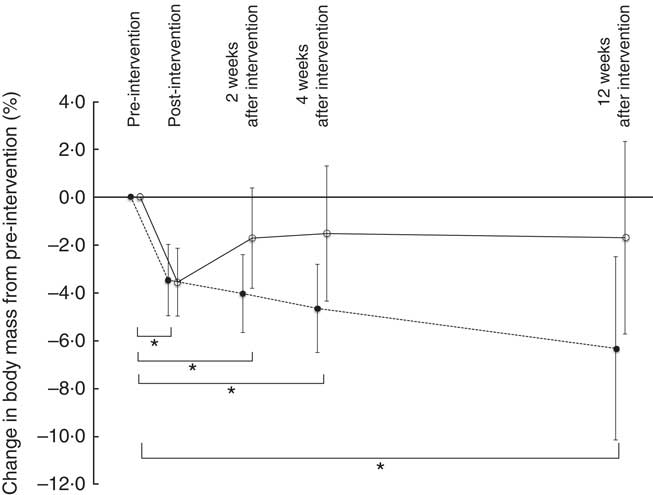
Fig. 3 Short-term changes in body mass in healthy-weight (![]() ) and excess-weight (
) and excess-weight (![]() ) adults. * P <0·05.
) adults. * P <0·05.
Table 2 Changes in body composition parameters and health-related outcomes from pre- to post-intervention in healthy-weight and excess-weight adults (Mean values and standard deviations)
FM, fat mass; FFM, fat-free mass; TBW, total body water.
a,b Mean values within a row with unlike superscript letters were significantly different in healthy and excess-weight adults, independently (P<0·05).
* Healthy weight: n 17, excess weight: n 16; total: n 33.
† To convert glucose in mg/dl to mmol/l, multiply by 0·0555; to convert TAG in mg/dl to mmol/l, multiply by 0·0113; to convert cholesterol in mg/dl to mmol/l, multiply by 0·0259.
‡ Healthy weight: n 12, excess weight: n 14; total: n 26.
Characteristics of the intervention
All thirty-six subjects successfully completed the weight loss programme. Mean physical activity data recorded using the ACC (PALACC, step counts, physical activity duration and MET) for each programme day and overall are presented in Fig. 4. The percentage of physical activity time was compared with total activity time for days 1–6. Physical activity at an intensity of 1·1–3·0 MET comprised 66 (sd 6), 64 (sd 8), 69 (sd 8), 69 (sd 8), 67 (sd 7) and 70 (sd 7) % of total activity time, respectively. Moreover, physical activities at 3·1–5·9 MET comprised 24±6, 27±7, 22±6, 23±7, 26±6, and 23±6 % of total activity time, respectively, whereas physical activities of >6 MET comprised 9 (sd 8), 8 (sd 8), 9 (sd 7), 8 (sd 7), 7 (sd 8) and 7 (sd 6) % of total activity time, respectively (Fig. 4). With regards to the meals, the mean programme macronutrient consumptions in all subjects are shown in Table 1. The proportions were protein: 34·7 (sd 2·3) %, fat: 32·2 (sd 3·6) % and carbohydrate: 33·1 (sd 5·5) %. There was no significant difference in food quotient between groups (healthy weight: 0·84 (sd 0·02) excess weight: 0·84 (sd 0·01); P=0·23), and the estimated RER was not different between weight groups (P=0·37, Table 3).
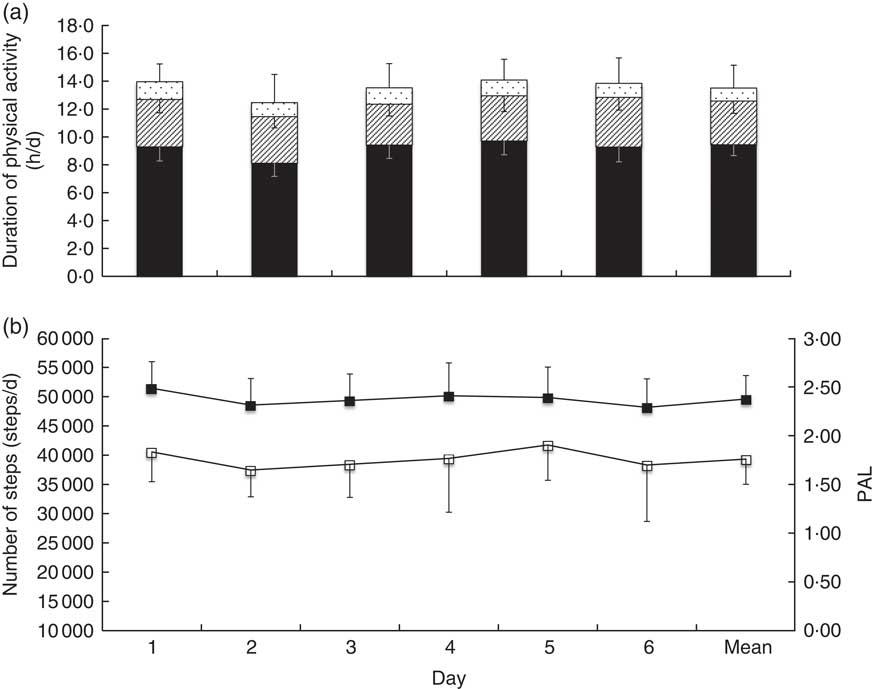
Fig. 4 Physical activity data obtained using a pedometer with tri-axial accelerometer in all subjects, presented for each programme day and as the programme mean. (a) Physical activity duration and metabolic equivalents (MET) and (b) number of steps and physical activity level recorded using the pedometer with a tri-axial accelerometer (PALACC). a: ![]() , 1·1–3·0 MET;
, 1·1–3·0 MET; ![]() , 3·1–5·9 MET;
, 3·1–5·9 MET; ![]() , >6 MET; b:
, >6 MET; b: ![]() , steps;
, steps; ![]() , PAL.
, PAL.
Table 3 Characteristics of energy metabolism during the intervention in healthy-weight and excess-weight adults (Mean values and standard deviations)
TEE, total energy expenditure; EI, energy intake; EB, energy balance; RER, respiratory exchange ratio; PALDLW, physical activity level obtained using the doubly labelled water method.
a,b Mean values within a row with unlike superscript letters were significantly different between groups (P<0·05).
Energy metabolism
The characteristics of energy metabolism are shown in Table 3. During the intervention period, there were no significant differences in EI (P=0·46), TEE (P=0·06), EB (P=0·07) and PALDLW (P=0·50) between groups (Table 3).
Health-related outcomes
As shown in Table 2, levels of glucose, TAG and LDL-cholesterol and systolic and diastolic blood pressure significantly decreased in both groups from pre- to post-intervention; HDL-cholesterol significantly increased in both groups from pre- to post-intervention. No significant interactions (group×time) were present for any of these measures.
Discussion
This study aimed to investigate the effect of a short-term weight loss programme on body weight and composition, EB and health outcomes in adults with healthy and excessive weight enrolled in a newly developed, 1-week health tourism programme. The results of this study suggest that the programme design, which included a high EE physical activity protocol coupled with a strict energy-restricted diet, led to favourable outcomes, regardless of the individual’s body weight classification.
The general population in Japan has a mean PAL of 1·75( 26 ). In contrast, the PALDLW of the newly developed programme reached 3·10, which is higher than that of competitive athletes during daily practice( Reference Sagayama, Hamaguchi and Toguchi 27 , Reference Sagayama, Kondo and Shiose 28 ). Surprisingly, the PALDLW reached over 3·0 not only in the healthy-weight group (3·14 (sd 0·43)), but also in the excess-weight group (3·05 (sd 0·43)). The subjects in the current study engaged in a long duration of light and moderate intensity physical activities, as well as a good amount of vigorous activity; 1·1 MET were achieved 10 h/d and 6·0 MET were achieved >1 h/d. It is important to note that the accelerometer underestimates actual PAL (measured with DLW) by 10·0–20·0 %; nonetheless PALACC was also maintained at a high level over the entire intervention (Fig. 4). The average number of steps completed per d was approximately 39 000, indicating that the goal of 30 000 steps/d was exceeded (Fig. 4). The number of steps in this study was far superior to a 3-month exercise programme with approximately 9000 steps/d( Reference Yoshimura, Kumahara and Tobina 25 ). We speculate that it would be difficult to achieve these high MET, PAL and number of steps in everyday life; however, these results were likely achieved because this programme was short-term, supervised and engaged participants through tourist-centric activities.
In addition, this programme provided low EI meals in the morning and afternoon that were <50·0 % of the normal EI. At dinner, we supplied the EI meal using Okinawa foodstuff. The Okinawa diet, which is a plant-rich diet with lean protein sources, healthy fats, more nutrient-dense but energy poor vegetables, fruits, and legumes, can help increase the intake of health-enhancing phytonutrients( Reference Willcox and Willcox 13 ). Our study used Okinawa foodstuff, which is low-carbohydrate and high protein, and may not reflect typical Japanese cuisine( 10 ). Moreover, we adjusted EI and provided 0 kJ (0 kcal) or low-carbohydrate beer to increase satisfaction in some subjects. Although evidence is scarce, traditional Japanese cuisine may be effective for weight loss food that also provides satiety. Based on the results of this study, the subjects successfully consumed an EI-restricted diet that achieved its design goals for reduced EI and macronutrient composition.
Guidelines established by the American Heart Association, American College of Cardiology, and The Obesity Society in 2014 recommended a 3·0–5·0 % body weight loss for risk reduction of obesity-related chronic diseases( Reference Jensen, Ryan and Apovian 29 ). Subjects who participated in the current weight loss programme experienced a 3·5 % weight loss after only 1 week. As a result of tracking subjects’ weight for 12 weeks after completing the programme, we determined that weight loss was maintained. In particular, the weight loss rate in excess-weight individuals after 12 weeks was comparable to rates from previous studies( Reference Nakata, Okada and Hashimoto 30 ). In addition, the calculated ΔFM/Δbody mass ratio was 84 % in healthy weight and 88 % in excess weight. The significant EE and energy restriction, without fluid restriction, resulted in a large energy deficit (>8368 kJ/d (>2000 kcal/d)). We also demonstrated a mean negative EB of −10 435 (sd 2824) kJ (−2494 (sd 675) kcal/d) in all subjects, measured using the DLW method for TEE and provided EI. This finding is similar to a mean value of −11 924 (sd 5611) kJ/d (−2850 (sd 1341) kcal/d) that was measured using estimated body composition changes (if calculated FM is 39 748 kJ/kg (9500 kcal/kg) and FFM is 4268 kJ/kg (1020 kcal/kg))( Reference Heymsfield, Thomas and Martin 31 , Reference Schoeller and Thomas 32 ). Thus, the FM reduction can be considered as a reasonable value, which was achieved using a short-term weight loss programme.
A recent critical review on diet-induced weight loss of >8 weeks showed that the ΔFM:Δbody mass ratio was approximately 75·0 %, and the remaining 25·0 % was lost as FFM( Reference Heymsfield, Gonzalez and Shen 3 ). In a previous study, a dietary restriction plus exercise intervention resulted in an approximately 79·0 % decrease in FM against total body mass, whereas with the diet only intervention, the FM decreased by only 70·0 % against body mass in 6 months( Reference Redman, Heilbronn and Martin 33 ). Another study indicated that adding exercise to a low-energy diet regimen increased FM losses and reduced FFM losses after 4 weeks of the intervention( Reference Heymsfield, Thomas and Nguyen 34 ). Chaston et al.( Reference Chaston, Dixon and O’Brien 35 ) reviewed twenty-six non-surgical weight loss programmes and reported that exercise, in addition to energy restriction, influenced the ΔFM/Δbody mass ratio. A significant decrease in FM while maintaining FFM or attenuating FFM loss is one of the modern obesity treatment goals. Our 1-week weight loss programme achieved this goal in healthy-weight and overweight or obese adults. Moreover, FM loss was achieved in this short period under a supervised exercise programme. In our newly developed programme, the exercise was easy to perform( Reference Tanaka and Jackowska 7 ). In addition, the programme consisted of a variety of leisure physical activities, such as sightseeing with walking (3·0–5·0 MET), recreational swimming (4·8–5·8 MET), snorkelling (5·0 MET), sea kayaking (5·0 MET) and diving (7·0 MET) in Okinawa( Reference Ainsworth, Haskell and Herrmann 36 ).
With regards to the programme’s EI-restricted diet, protein intake was set between 1·20–1·70 g/kg body mass to maintain FFM, according to the recommendation from the American College of Sports Medicine( 17 ). Pasiakos et al.( Reference Pasiakos, Cao and Margolis 37 ) reported that an appreciated protein intake (1·60 g/kg) greatly contributed to attenuated FFM loss during weight loss. Leidy et al.( Reference Leidy, Clifton and Astrup 38 ) reported that greater body weight and FM loss, preservation of FFM, perceived fullness and elevated satiety hormones were achieved with higher-protein, energy-restriction diets compared with lower-protein, energy-restriction diets. It is possible that subjects in the current weight loss programme, which included energy restriction with a high protein diet plus exercise, perceived greater fullness or satiety in the short term. Future investigations should evaluate subject perception, as positive perceptions may influence long-term participation in similar practices and potential lifestyle changes.
EB between TEE and EI determines the increase and decrease in body mass and FM; thus, TEE reduction is a significant factor that makes maintaining body mass after weight loss difficult. It is known that physical activity EE and TEE reduces with body mass reduction, even if people with obesity adopt habitual exercise, such as walking( Reference Bonomi, Soenen and Goris 39 ). Thus, subjects in this study received some exercise and diet education and practice during the programme, which was necessary for them to learn exercise and diet practices needed to maintain or lose more body mass. We estimated that intermittent slow jogging for 1 h (approximately 1674–2092 kJ/session (400–500 kcal/session)) was appropriate to maintain or lose more body mass, because the 60-min slow jogging session has a training intensity amounting to 6·0 MET (including 1·0 MET of resting energy) with approximately 1506 kJ (360 kcal) used (if the body mass is 60·00 kg). The secondary analysis revealed that both weight groups in this study maintained their body mass after the 1-week Health Tourism weight loss programme for at least 12 weeks (Fig. 3). Participants were not only provided with food restrictions for 7 d, but the programme also taught and educated them, with the advice of a dietitian, around food choices that they could then implement after the programme. Therefore, by utilising the exercises and diet completed during the 1 week of participation in the Health Tourism weight loss programme, we expect that subjects can aim for subsequent behaviour changes, improvement in body composition, and risk reduction for lifestyle-related diseases due to weight loss.
Furthermore, drastic changes in blood biomarkers were found after only 1 week. Changes in blood glucose, HDL-cholesterol, LDL-cholesterol and TAG levels were similar to those from a previous study using a 3-month weight loss programme in people with obesity( Reference Yoshimura, Kumahara and Tobina 25 ). Diet-induced weight loss of 5·0–10·0 % within a short period can greatly improve glucose and lipid metabolism( Reference Williamson, Serdula and Anda 40 ). Previous research has shown favourable effects from light-to-moderate intensity aerobic exercise training at the LT for glucose intolerance( Reference Nishida, Higaki and Tokuyama 41 ) and lipid metabolism( Reference Sunami, Motoyama and Kinoshita 42 ). Recently, a short intermittent exercise programme, including slow jogging at LT intensity, has been reported to contribute to good health in the general and older populations( Reference Ikenaga, Yamada and Kose 8 , Reference Hatamoto, Goya and Yamada 43 ).
There were a few limitations in our study. The primary limitation of our study was that there was no independent (exercise, diet or control) group. Thus, we were unable to identify which components of the intervention may have contributed to differences between and/or within groups. Second, the end of intervention data were self-reported using different types of scales; thus, there is a potential for error among devices. However, before the investigation, the weight measurements were not different between those that were self-reported and those that we measured (67·1 (sd 11·1) v. 67·0 (sd 10·6) kg, respectively; P=0·75). Third, we used an estimated RER from fat loss and food quotient for calculating TEE. We could not measure actual RER because our study design was based on a trip (not a laboratory setting). However, we estimated that the error was 1–2 % because the estimated RER was adjusted for changes in body composition( Reference Black, Prentice and Coward 22 ). Fourth, the body composition analysis was based only on the stable isotope two-compartment model. However, the close agreement with the three-compartment model using two different body composition techniques (stable isotope dilution and underwater weighing) in the first eight subjects indicated no violation associated with the two-compartment hydration assumptions, which may be due to the subjects being asked to avoid dehydration (see online Supplementary material S1). Thus, the ratio of TBW against FFM was maintained.
In conclusion, within only 1 week of participating in the Health Tourism weight loss programme, which focused on exercise with energy restriction, but without water restriction, subjects experienced a 3·5 % weight loss of primarily FM, and were able to maintain their body weight losses for at least 12 weeks after the programme. Moreover, they had improved levels of blood biochemistry and pressure. Thus, the Health Tourism weight loss programme may be a viable choice for a weight loss programme. Further studies are needed in order to accumulate more evidence for the efficacy of the Health Tourism programme (e.g. other health-related outcomes and overall health promotion).
Acknowledgements
The authors wish to thank the subjects who participated in this study. The authors also gratefully acknowledge Nakijin Village, Nakijin Clinic and Hokubuchikuishikai Hospital for their great cooperation, the staff and graduate students who assisted with the data collection, Mr Shinobu Kikuzato and Mr Shoichi Ganaha from the Nakijin Health Care Center, Ms Mamiko Ichikawa from Teikyo University, Ms Magdalena Jackowska from Fukuoka University Institute for Physical Activity and Mr Takuma Kurosaki from Fukuoka University.
This study was supported by the MEXT-supported programme of the Strategic Research Foundation at Private University (grant no. S0801083), Grant-in-Aid by Asahi Corporation and Santory Corporation. The sponsors had no control over the interpretation, writing or publication of this work. The data analysis was supported by the Research Fellowships of the Japan Society for the Promotion of Science for Young Scientists (16J11877).
H. S., K. S., Y. Y. and H. T. conceived and designed the research. H. S., K. S., M. T., Y. M., H. M. and H. T. performed the experiments. H. S., K. S. and M. T. analysed the data. H. S., K. S., M. T., Y. M., H. M., Y. Y., N. E., S. K., Y. H. and H. T. interpreted the results of the experiments. H. S. and M. T. prepared the figures. H. S., Y. Y. and H. T. drafted the manuscript. H. S., Y. Y., N. E., Y. H. and H. T. edited and revised the manuscript and all authors approved the final version of manuscript.
The authors declare that there are no conflicts of interest.
Supplementary material
For supplementary material/s referred to in this article, please visit https://doi.org/10.1017/S0007114518000582


