


Globally, the obesity epidemic is increasing at an alarming rate and especially the increase in childhood obesity is of concern(Reference Fryar, Carroll and Ogden1). Although obesity itself is not a disease, the condition often causes endocrine and metabolic changes clustered into the so called the metabolic syndrome (MetS) that typically arises in parallel with obesity(Reference Isomaa, Almgren and Tuomi2–Reference Alberti, Zimmet and Shaw4). The MetS represents a complex pathophysiological cluster characterised by excessive ectopic lipid accumulation causing inflammation, insulin resistance, hypertension and hyperlipidaemia leading to type 2 diabetes (T2D) and CVD(Reference Huang5).
Lifestyle modifications, especially through a healthy diet, have attracted great interest to alleviate MetS development. Increased consumption of dietary fibre (DF) has been proven to ameliorate postprandial dyslipidaemia and insulin responses, which could effectively modulate T2D and CVD(Reference Hartvigsen, Gregersen and Laerke6,Reference Hu, van Dam and Liu7) . DF can influence digestion and absorption processes at all sites of the gastrointestinal tract. Thus, DF, depending on its composition, can delay gastric emptying(Reference Wolever, Tosh and Spruill8), impede the digestion processes in the small intestine(Reference Yu, Ke and Li9), influence the metabolic outcome of the microbiota in the large intestine(Reference Nielsen, Laerke and Theil10) and influence the release of gastrointestinal satiety hormones(Reference Furness, Rivera and Cho11), which alone or in combination will improve postprandial glycaemia and insulin responses(Reference Yu, Ke and Li9). Although acute intervention studies have indicated soluble DF as most efficient in regulating glycaemia and cholesterol levels(Reference Weickert and Pfeiffer12,Reference Russell, Baka and Bjorck13) , controlled intervention studies have indicated that diets high in insoluble cereal fibre may improve insulin resistance(Reference Weickert, Roden and Isken14) to a larger extent than what is the case with more soluble DF sources(Reference Weickert and Pfeiffer12,Reference Weickert and Pfeiffer15) . Another dietary constituent that is known to influence the MetS is content and quality of protein(Reference Rakvaag, Fuglsang-Nielsen and Bach Knudsen16). A recent study showed that a diet high in either animal or plant protein reduced liver fat, insulin resistance and hepatic inflammation(Reference Markova, Pivovarova and Hornemann17). It has also been found that milk protein, whey protein in particular, has insulinotropic properties by affecting the release of incretin hormones and insulinotropic amino acids(Reference Nilsson, Stenberg and Frid18). Moreover, whey protein provided as a pre-meal has been found to delay gastric emptying(Reference Bjornshave, Holst and Hermansen19) and reduce glycaemic response after consuming a carbohydrate-rich diet(Reference Frid, Nilsson and Holst20,Reference Nilsson, Holst and Björck21) .
Although DF and protein have been the subject of many investigations, the interactive effects of DF and protein are poorly understood. In the present study, we investigated the possible ameliorating effects on MetS biomarkers in an obese porcine model for childhood obesity(Reference Curtasu22) by the use of enzyme-treated wheat bran as DF supplement and hydrolysed whey protein as protein supplement alone or combined. Göttingen minipigs have a small body size and have previously been used for the development of MetS models because of the anatomical and physiological similarities with adolescent and adult humans(Reference Bellger, Merricks and Nichols23,Reference Hsu, Wang and Jiang24) . We hypothesised that DF and whey protein and their combinations will have a positive effect on plasma insulin, lipid biomarkers, inflammatory biomarkers and expression of genes associated with nutrient metabolism in young obese Göttingen minipigs.
Materials and methods
Animals and handling
The care and housing of animals were done according to Danish laws and regulations regarding humane care and use of animals in research (The Danish Ministry of Justice, Act on Animal Experiments no. 474 of 15 May 2014, as stipulated in the executive order no. 12 of 7 January 2016) and performed under license obtained from the Danish Animal Experimentation Inspectorate, Ministry of Food, Agriculture and Fisheries. Animal health was monitored closely by observing behaviour (appetite, activity, interactions with humans and neighbouring pigs) and signs of disease.
A total of forty-three female Göttingen minipigs (Ellegaard Göttingen minipigs), raised at Aarhus University, Department of Animal Science, Foulum, Denmark, were used in the study. The minipigs were received at the facilities at 8 weeks of age in four separate blocks over 8 months. At arrival, the minipigs were housed in pairs and fed a standard minipig chow diet (Special Diet Services, Dietex International, UK) according to breeders’ recommendations for 1 week followed by separation and a 1-week gradual transition to a high-fat low-DF diet containing 20 % fructose (LOFLOP) for the following 20 weeks of ad libitum feeding to induce obesity. The minipigs were housed in individual pens (1·5 m × 2·4 m for pigs <50 kg, and 3 m × 2·4 m > 50 kg). Water was provided ad libitum from drinking nipples, and the pens were provided with wood shavings as bedding material for the first 22 weeks. When entering the intervention of the current experiment, the bedding was removed and replaced with a rubber mattress, and toys were provided to satisfy the minipigs’ rooting behaviour.
At an average body weight (BW) of 31·3 (sem 4·0) kg (30 weeks old), the minipigs were transferred to one of four experimental diets over 3 d to gradually reach 100 % of the experimental diet on day 4 using fixed amounts of feed corresponding to 2·6 % of BW. The four experimental diets were a diet low in DF and protein (LOFLOP), a diet low in DF and high in protein (LOFHIP; 6·8 % whey protein hydrolysate added), a diet high in DF and low in protein (20 % enzyme-treated wheat bran added) and a diet high in DF and protein (HIFHIP; 6·8 % whey protein hydrolysate and 20 % enzyme-treated wheat bran added). Wheat bran was delivered by Lantmännen Cerealia AB and was enzymatically treated with cell wall-degrading enzymes (xylanase, glucanase and cellulase) by DuPont Industrial Biosciences Aps as described by Nielsen et al.(Reference Nielsen, Laerke and Theil10). Whey protein hydrolysate (Lacprodan® HYDRO.REBUILD) was provided by Arla Foods Ingredients Group P/S. The experimental diets were produced at the feed mill at Aarhus University and stored at –20°C. Ingredients and nutrient composition of the experimental diets are shown in Table 1.
Table 1. Ingredients (g/kg as-fed), chemical composition (g/kg DM) and energy distribution (percentages) of the experimental diets

LOFLOP, low-fibre low-protein diet; LOFHIP, low-fibre high-protein diet; HIFLOP, high-fibre low-protein diet; HIFHIP, high-fibre high-protein diet; AX, arabinoxylan; RS, resistant starch; AXOS, arabinoxylan-oligosaccharides.
* Dietary fibre = NSP + fructans + RS + AXOS + Klason lignin.
† Determined by enzymatic resistant starch assay (AOAC method 2002.02).
‡ Calculated nutrient concentration and energy conversion factors (FAO) for protein (17 kJ/g), fat (37 kJ/g), carbohydrates (17 kJ/g) and total dietary fibre (8 kJ/g).
After the transition to the experimental diets, voluntary feed intake was recorded for a total of 7 weeks (first week and then for three times every second week). BW was measured at baseline, at fourth and eighth weeks after starting the intervention to calculate daily weight gain and weight gain per unit of feed intake. Anthropometric measurements including length, chest and abdomen circumference (cm) were taken using measuring tape at the end of the experimental intervention (week 28).
Sample collection
Before (week 20 of ad libitum feeding with LOFLOP) and after the intervention (week 28), fasting blood and tissue samples were taken as described in detail by Curtasu(Reference Curtasu22). Briefly, after an overnight fasting (feed removed at 15·00), the minipigs were anaesthetised with 0·1 ml/kg BW of Zolitil mixture containing 50 mg/ml tiletamine/zolazepam (Vibrac SA, Carros, France), 2·5 mg/ml butorphanol (Torbugesic® Vet, Scan Vet Animal Health A/S), 12·5 mg/ml ketamine (Ketaminol Vet, Intervet Denmark) and 12·5 mg/ml xylazine (Rompun, Bayer Health Care AG), and blood samples were collected from the jugular vein by veno-puncture. Following which the minipigs were moved into a left recumbent position, and a liver biopsy sample (50 mg) was taken with a biopsy pistol (Pro-MagTM I 2.5, Argon Medical Devices, Inc.) and a 14 G × 10 cm needle (Argon Medical Devices, Inc.) after shaving and disinfection of the skin with 0·5 % chlorhexidine solution in 85 % alcohol (Abena A/S) and subcutaneous injection of a local anaesthetic (Procamidor VET, 20 mg/ml, Richter Pharma, AG). Biopsies were supervised by ultrasound scanning by using a 6–18 MHz linear probe (MyLabTM Five VET, Biosound Esaote, Inc.) and the incision closed with a surgical staple. For sampling of subcutaneous fat and muscle tissue, the right hind leg of the minipig was cleaned, sterilised and anaesthetised locally as described for the liver biopsy. After a 15–20 mm incision of the skin, approximately 100 mg of subcutaneous adipose tissue (sAT) was collected, followed by collection of 50–100 mg muscle tissue from the semitendinosus muscle by use of the biopsy pistol. The sAT were snap frozen in liquid N2 and stored at –80°C until analysis. Muscle and liver tissues were placed in sterile tubes containing RNAlater (Sigma-Aldrich Co. LLC).
After sampling, a few drops of Streptocillin® vet. (Boehringer Ingelheim Danmark A/S) were administered to the incision site and closed with surgical staples. Urine was collected by attaching an absorbent tampon under the tail (covering the urethra) using Omniplast adhesive fabric tape (Hartmann, Germany) before the minipigs were transferred back to their pens for recovery.
Following the 8-week intervention, the animals were weighed and euthanised in the 9th week over 3 d. At euthanasia at the end of the experiment, the minipigs had not had their feed removed, so samples collected reflect the non-fasting state. For sampling, the minipigs were weighed and anaesthetised with Zolitil mixture as described above. The pigs were then fitted with a catheter in the ear vein for possible supplementary anaesthesia and put in a supine position for sampling from the jugular vein. Following which the abdominal cavity was opened by a midline incision and a blood sample was quickly taken from the portal vein. The minipigs were then euthanised with an overdose of sodium pentobarbital followed by exsanguination. The entire gastrointestinal tract was removed, and the small intestine and colon sections were tied off to keep contents in place while measuring the length. Liver, kidney and heart weights were recorded, and tissue samples from the right medial liver lobe were frozen immediately for fat analysis. Urine samples were collected by removing the urinary bladder and direct puncture to determine pH at room temperature with a pH meter and a sample was stored at –80°C for further analysis. Backfat thickness was measured by ultrasound scanning (MyLabTM Five VET, Biosound Esaote, Inc.) with a 6–18 MHz linear probe. Measurements were taken in the area of the longissimus dorsi muscle over the last rib while the animal was in a hanging position. The distance from the skin to the last layer of fat was measured at each recording and exported for calculation.
Blood samples taken at fasting and at slaughter were collected in lithium heparin, K3 ethylene-diamine-tetra acetic acid and K3 ethylene-diamine-tetra acetic acid/Aprotinin inhibitor (10 000 kIU/ml blood, Nordic Pharma Ltd.), centrifuged for 12 min at 3300 rpm (1220 rcf) at 4°C and plasma was aliquoted for analyses and stored at –80°C.
Analytical methods
All chemical analyses of the diets were performed in duplicate on freeze-dried samples and analysed as previously described(Reference Nielsen, Laerke and Theil10). Liver fat was determined based on Bligh and Dyer’s method(Reference Bligh and Dyer25). Briefly, liver samples were homogenised in double amount of methanol using an Ultra-Turrax homogeniser (IKA Labortechnik) in an ice bath. Homogenate (600 mg) was mixed with 1·0 ml water, 1·5 ml methanol and 1·0 ml chloroform, the mixture was shaken for 1 min and 1·0 ml water and 2·0 ml chloroform were added and shaken for 1 min. The mixture was centrifuged at 3000 rpm (1220 rcf) for 5 min to get phase separation and 2·00 ml of the lower chloroform phase was taken out, dried and the residue was weighed for determination of fat content.
Concentrations of glucose, fructosamine, lactate, NEFA, HDL, LDL, total cholesterol, TAG, albumin, aspartate transaminase, alanine transaminase and γ-glutamyltransferase in lithium heparin plasma were analysed using the ADVIA 1650 Chemistry system (Siemens Diagnostics) according to the manufacturer’s instructions (Siemens Diagnostics Clinical Methods for ADVIA 1650). Urinary glucose, creatinine and total protein analyses were conducted with the same system. Millipore MILLIPLEX MAP Human Metabolic Hormone bead panel kit (HMHEMAG-34K, Merck Millipore, Merck KGaA) was used to determine insulin, glucagon, C-peptide and ghrelin (active), glucose-dependent insulinotropic polypeptide (GIP) and total glucagon-like peptide-1 (GLP-1) in K3 ethylene-diamine-tetra acetic acid/Aprotinin inhibitor plasma. Cytokines (interferon γ (IFN-γ), IL-2, IL-4, IL-10, IL-12 and IL-18) in K3 ethylene-diamine-tetra acetic acid plasma were measured using a Millipore MILLIPLEX MAP Porcine bead panel kit (PCYTMAG-23K, Merck Millipore, Merck KGaA, Darmstadt, Germany). Both kits were run according to the manufacturer’s instructions on a Luminex MAGPIX system (Luminex Corporation).
RT-PCR was performed on liver, muscle and sAT to analyse gene expression (online Supplementary Table S1). In liver tissue, total RNA extraction was performed using the NucleoSpin RNA Plus kit (Macherey-Nagel GmbH & Co., KG.) according to the manufacturer’s instructions. Total RNA extraction from muscle and sAT was operated using TRI Reagent® Solution (Ambion, Applied Biosystems) based on the manufacturer’s guidelines. RNA transcription, cDNA synthesis and RT-PCR quantification were conducted as previously described(Reference Nielsen, Fredborg and Andersen26). Glyceraldehyde 3-phosphate dehydrogenase, β-actin and hypoxanthine phosphoribosyl transferase 1 were tested as potential housekeeping genes (HKG). Gene expression data were obtained as Ct values (cycle number for which logarithmic plots cross a calculated threshold) and used to calculate ΔCt values as the difference between Ct of the target gene and mean Ct of HKG. Liver glyceraldehyde 3-phosphate dehydrogenase exhibited changes with regard to DF and protein interaction, whereas sAT glyceraldehyde 3-phosphate dehydrogenase exhibited changes with regard to protein effect. As a result, mean of β-actin and hypoxanthine phosphoribosyl transferase 1 was used as HKG for liver tissue, whereas mean of β-actin and glyceraldehyde 3-phosphate dehydrogenase was used as HKG for muscle and β-actin were used as HKG for sAT. Relative gene expression was determined using the (1+efficiencies)–ΔΔCt method where ΔΔCt = ΔCttreatment – ΔCtLOFLOP. Results were reported as fold changes. C-reactive protein expression in muscle and sAT as well as muscle leptin receptor expression are not reported due to detection limit.
Calculations
Porcine obesity index was calculated as previously described(Reference Sebert, Lecannu and Kozlowski27):
 $${\rm{POI}}{\mkern 1mu} \left( {l/cm} \right) = \left( {\pi \times \left( {1/3} \right) \times BS \times \left( {Ab{r^2} + C{r^2} + Ab \times Cc} \right)} \right)/BS \times {10^3},$$
where BS, Abr, Cr, Ab and Cc are body size (length), abdomen radius, chest radius, abdomen circumference and chest circumference, respectively.
Body surface area was calculated as follows(Reference Swindle, Makin and Herron28):
 $$BSA\,{\rm{ }}\left( {{m^2}} \right) = 0\!\cdot\!121B{W^{0 \cdot 575}},$$
Weights of liver, heart and kidney and lengths of small intestine and colon at slaughter were calculated relative to BW (kg) at slaughter.
Values of fasting blood glucose (mm) and insulin (MIU/l) were used to calculate the homeostatic model assessment for insulin resistance (HOMA-IR) and β-cell function (HOMA-β) as previously described(Reference Levy, Matthews and Hermans29):
 $${\rm{HOMA}}{\rm\hbox{-}}{\rm{IR}} = \left( {{\rm{insulin}} \times {\rm{glucose}}} \right)/22\!\cdot\!5,$$
 $${\rm{HOMA}}{\rm\hbox{-}}\beta = 20 \times {\rm{insulin}}/\left( {{\rm{glucose}} -3\!\cdot\!5} \right).$$
Statistical analysis
The pig was regarded as the experimental unit. According to the power calculations for TAG and total cholesterol, 6–8 minipigs completing the study were expected to give sufficient statistical power (α < 0·05; β = 0·80). All data analyses were accomplished using the MIXED procedure of SAS (SAS Institute, Inc.) based on the normal mixed model:
 $${Y_{ijk}} = \mu + {\alpha _i} + {\beta _j} + {\left( {\alpha \beta } \right)_{ij}} + {t_k} + {\varepsilon _{ijk}},$$
where Y ijk is the dependent variable; μ is the overall mean; α i and β j are the fixed effects of DF level (i = LOF or HIF) and protein level (j = LOP or HIP); (αβ) ij is the interaction among fixed effects; t k is the random effect of block (k = 1, 2, 3 or 4) and ϵ ijk is the residual error. If an interaction was detected, we conducted a pairwise comparison with groups adjusted by multiple comparisons with Tukey–Kramer post hoc test. Values are presented as least square means with standard error of the means (sem). A log transformation was performed for HOMA-β, ratios of glucose:creatinine and protein:creatinine in urine at the end of experiment, urinary ratios of glucose:creatinine and protein:creatinine at baseline to obtain variance homogeneity and values of back-transformed data are presented with a 95 % CI. Pearson correlation of delta values for glucose in the portal vein and jugular vein against daily starch intake was performed by using GraphPad Prism 8.0 (GraphPad Software Inc.). Effects are reported significant when P < 0·05, while P < 0·10 was considered as a tendency. For the statistical analysis of anthropometric measurements block 2 was excluded due to absence of data.
Results
Diets, feed intake, body weight, morphometric and organ indices
The diets contained almost equal amounts of fat and gross energy as shown in Table 1. As planned, the crude protein content was 56 % higher in the two high-protein diets, and the DF content was approximately doubled in the two high-DF diets, it was also reflected in the relative energy contributions from protein and DF. The increase was in the form of NSP, AX, AXOS and Klason lignin due to the inclusion of enzyme-treated wheat bran in the high-DF diets. Along with the higher crude protein and DF, the starch content was lower: 150 g/kg DM in the HIFHIP diet compared with 344 g/kg DM in the LOFLOP diet.
The forty-three minipigs that for 20 weeks had been intervened by an energy-dense diet (diet LOFLOP) with baseline characteristics as in Table S2, increased their BW from 31·3 (sem 4·0) kg before the intervention to 46·8 (sem 5·4) kg after 8 weeks with no difference between the four diets (data not shown; P > 0·10). The daily feed intake recorded in weeks 22–28 showed a significant interaction between DF and protein (P = 0·038) with the lowest feed intake observed with high-fibre low-protein diet (Fig. 1). The daily weight gain as well as the gain per unit of feed intake was lower with the high-fibre diets (–20 %, P = 0·006; –11 %, P = 0·036) compared with low-fibre diets and higher with the high-protein diets (+36 %, P < 0·001; +31 %, P < 0·001) compared with low-protein diets (Fig. 1). At the end of intervention, there was no significant effect of dietary treatment on any of the morphometric measurements of the pigs either in length, chest circumference, abdomen circumference, porcine obesity index or body surface area and backfat thickness was also not significantly affected by either DF or protein levels (online Supplementary Fig. S1).

Fig. 1. Feed intake (A), daily weight gain (B) and weight gain per unit of feed intake (C) of Göttingen minipigs fed ad libitum during 8 weeks. Values are least-squared means with standard errors represented by vertical bars. Minipigs were regarded as the experimental units, n 10 for low-fibre low-protein diet (LOFLOP), n 10 for low-fibre high-protein diet (LOFHIP), n 12 for high-fibre low-protein diet (HIFLOP) and n 11 for high-fibre high-protein diet (HIFHIP). a,b Unlike letters are presented in the figure for the significant interaction (P < 0·05) after adjustment for multiple comparisons by the Tukey–Kramer post hoc test. Only significant P values are presented in the figure.
The relative weight (% of BW) of liver, heart, kidney and length (m/kg) of small intestine and colon as well as liver fat content at slaughter is shown in online Supplementary Fig. S2. The relative weight of the kidney was higher in the protein groups (0·20 v. 0·17 % of BW, P = 0·010), whereas none of the other responses was affected by dietary treatment.
Clinical parameters in fasting and non-fasting plasma
Plasma concentrations of clinical parameters in the fasting (jugular vein) and non-fasting state (jugular and portal vein taken at euthanasia) are shown in Table 2. At fasting, there were significantly higher plasma glucose concentrations with the high-protein diets compared with low-protein diets (6·9 v. 5·8 mm, P = 0·008), and an interaction of DF with protein in fructosamine (P = 0·022), but no difference between groups by pairwise comparisons. There were also higher NEFA concentrations (241 v. 161 μm, P = 0·015), higher albumin (44 v. 40 g/l, P = 0·018) and aspartate transaminase concentrations (28 v. 23 U/l, P = 0·043) with the high-protein compared with low-protein diets in fasting plasma. In the non-fasting samples, a borderline significant increase in LDL concentration was observed with high-protein diets in jugular (1·7 v. 1·2 mm, P = 0·054) and portal venous plasma (1·8 v. 1·3 mm, P = 0·049). Moreover, the higher protein content also resulted in significantly higher LDL:HDL ratios in plasma from both the jugular vein (0·88 v. 0·65, P = 0·015) and the portal vein (0·92 v. 0·67, P = 0·014) in the non-fasting state as compared with pigs fed the low-protein diets. For the other responses, no significant effects of dietary treatment were seen. Non-fasting plasma levels of glucose and lactate were not significantly changed by either DF or protein levels, but, surprisingly, glucose for the HIFHIP diet was higher in the jugular vein than the portal vein. Overall, the difference in glucose concentration between the portal and jugular vein was positively related to the intake of starch (r 0·494, P > 0·001, online Supplementary Fig. S3).
Table 2. Concentrations of clinical parameters in fasting (jugular vein) and non-fasting plasma (jugular and portal vein) in Göttingen minipigs fed diets low or high in dietary fibre and protein
(Mean values with their standard errors)
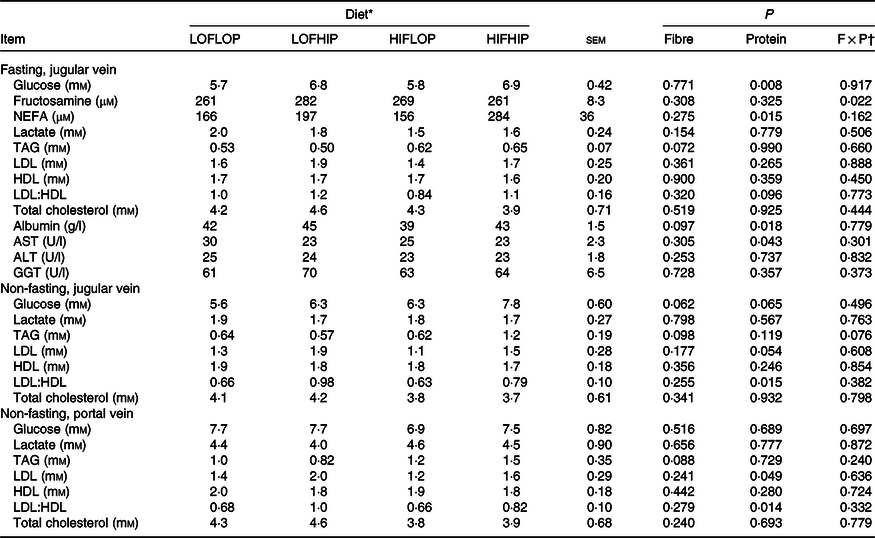
AST, aspartate transaminase; ALT, alanine transaminase; GGT, γ-glutamyl transferase.
* Minipigs were regarded as the experimental units, n 10 for low-fibre low-protein diet (LOFLOP), n 10 for low-fibre high-protein diet (LOFHIP), n 12 for high-fibre low-protein diet (HIFLOP) and n 11 for high-fibre high-protein diet (HIFHIP).
† F × P, interaction between fibre and protein level.
Fasting and non-fasting concentrations of plasma hormones and inflammatory cytokines
Fasting and non-fasting concentrations of hormones and inflammatory cytokines in plasma from the jugular vein are shown in Table 3. Fasting ghrelin concentrations were significantly higher with the high-dietary protein diets (28 v. 15 pg/ml, P = 0·008) but higher with the high-DF diets in the non-fasting state (21 v. 15 pg/ml, P = 0·036). At fasting, GIP concentrations were significantly lower (37 v. 60 pg/ml, P = 0·008) by the high-DF diets compared with low-fibre diets, whereas an interaction between DF and protein was observed in the non-fasting state (P = 0·009) with significantly higher values of the LOFLOP diet than the other three diets. The high-DF diets induced a borderline significant increase in fasting levels of total GLP-1 (P = 0·053), while diets with high protein content tended to increase it in the non-fasting state (P = 0·055). The C-peptide concentrations in non-fasting plasma were higher when the minipigs were fed the high-DF diets (60 v. 32 pg/ml, P = 0·011) and a tendency (P = 0·076) for higher concentrations with the high dietary levels of protein. There was no effect of diet on insulin concentrations, homeostatic model assessment for insulin resistance and HOMA-β in the fasting state, and only a tendency (P = 0·062) for a higher non-fasting concentration of insulin with high dietary protein content. High DF content gave rise to higher fasting concentrations of IL-12 (0·75 v. 0·59 ng/ml, P = 0·047) and IFN-γ (5·8 v. 4·3 ng/ml, P = 0·011) compared with low-DF diets, whereas an interaction between DF and protein was seen in fasting concentrations of IL-4 (P = 0·022) but with no differences between the groups by pairwise comparisons. In the non-fasting state, only IFN-γ levels were significantly higher with a high content of DF in the diet (2·3 v. 1·6 ng/ml, P = 0·001).
Table 3. Fasting and non-fasting concentrations of circulating hormones and inflammatory cytokines in Göttingen minipigs fed diets low or high in dietary fibre and protein
(Mean values with their standard errors; 95 % confidence intervals)

HOMA-IR, homeostatic model assessment for insulin resistance; HOMA-β, homeostatic model assessment for β-cell function; GIP, gastric inhibitory polypeptide; GLP-1, glucagon-like polypeptide; IFN-γ, interferon γ.
a,b Unlike superscript letters in a row are presented for the significant interaction (P < 0·05) after adjustment for multiple comparisons by the Tukey–Kramer post hoc test.
* Minipigs were regarded as the experimental units, n 10 for low-fibre low-protein diet (LOFLOP), n 10 for low-fibre high-protein diet (LOFHIP), n 12 for high-fibre low-protein diet (HIFLOP) and n 11 for high-fibre high-protein diet (HIFHIP).
† F × P, interaction between fibre and protein level.
‡ Values are back transformed after log transformation and are expressed as means with lower and upper 95 % confidence intervals.
Clinical parameters in urine at fasting and slaughter
In the fasting state, there was a significant interaction between DF and protein level in creatinine concentrations of the urine (P = 0·036) with LOFLOP having a significantly higher concentration than the two high-DF diets (Table 4). There was no effect of diet on urinary glucose and protein concentrations and glucose:creatinine and protein:creatinine ratios (P > 0·10) in the fasting state. At the non-fasting state, where urine was taken directly from the bladder at euthanasia, a high dietary protein content resulted in a significantly higher pH of the urine (5·6 v. 5·1, P < 0·001) and higher protein concentrations (85 v. 46 mm, P = 0·032) compared with the low dietary protein diets. An interaction of DF and protein was observed in protein:creatinine ratio (P = 0·048) with higher values of HIFHIP diet than the three other diets.
Table 4. Clinical parameter concentrations of urine collected at fasting and non-fasting state of Göttingen minipigs fed diets low or high in dietary fibre and protein
(Mean values with their standard errors; 95 % confidence intervals)

a,b Unlike superscript letters in a row are presented for the significant interaction (P < 0·05) after adjustment for multiple comparisons by the Tukey–Kramer post hoc test.
* Minipigs were regarded as the experimental units, n 10 for low-fibre low-protein diet (LOFLOP), n 10 for low-fibre high-protein diet (LOFHIP), n 12 for high-fibre low-protein diet (HIFLOP) and n 11 for high-fibre high-protein diet (HIFHIP).
† F × P, interaction between fibre and protein level.
‡ Values are back transformed after log transformation and are expressed as means (95 % confidence interval).
Relative gene expression of liver, muscle and subcutaneous adipose tissue
Biopsies were taken from the liver, muscle and sAT to study the relative expression of genes involved in carbohydrate and lipid metabolism, inflammation and transcription factors (Table 5). No effects were observed in gene expression in the liver except for an increase in the expression of fructose-bisphosphatase 1 with a high protein content of the diet (1·27 v. 0·96, P = 0·043). In muscle tissue, there were interactions between DF and protein in the expression of acetyl-coenzyme A carboxylase α (P = 0·020), PPARγ (P = 0·004) and TNF (P = 0·026), where the LOFHIP induced significantly higher expression of PPARγ than the other three diets in the post hoc analysis. In sAT, high DF content reduced the expression of fatty acid synthase (FASN) (0·70 v. 1·20, P = 0·035), whereas an interaction between DF and protein was seen in the expression of adiponectin receptor 1 (ADIPOR1) (P = 0·048), leptin receptor (P = 0·031) and PPARγ (P = 0·018) without differences between groups after adjustment for multiple comparisons.
Table 5. Gene expression of selected genes in liver, skeletal muscle and subcutaneous adipose tissue after dietary intervention in Gottingen minipigs
(Mean values and 95 % confidence intervals)

SLC2A5, solute carrier family 2 (facilitated glucose/fructose transporter) member 5, Glut5; SLC2A4, solute carrier family 2 (facilitated glucose transporter) member 4, Glut4; SLC2A8, solute carrier family 2 (facilitated glucose transporter) member 8, Glut8; HK1, hexokinase 1; FBP1, fructose-bisphosphatase 1; PFKM, phosphofructokinase, muscle; ACACA, acetyl-coenzyme A carboxylase α; ACLY, ATP-citrate lyase; FASN, fatty acid synthase; CCL5, C-C motif chemokine ligand 5/encodes RANTES; ADIPOR1, adiponectin receptor 1; LEPR, leptin receptor; LEP, leptin; ADIPOQ, adiponectin; CIDEC, cell death inducing DFFA like effector C; CRP, C-reactive protein, pentraxin-related.
a,b Unlike superscript letters in a row are presented for the significant interaction (P < 0·05) after adjustment for multiple comparisons by the Tukey–Kramer post hoc test.
* Minipigs were regarded as the experimental units, n 10 for low-fibre low-protein diet (LOFLOP), n 10 for low-fibre high-protein diet (LOFHIP), n 12 for high-fibre low-protein diet (HIFLOP) and n 11 for high-fibre high-protein diet (HIFHIP). Data are reported relative to LOFLOP.
† F × P, interaction between fibre and protein level.
Discussion
The current study intended to investigate the possible ameliorating effects of DF and protein on MetS biomarkers in an obese porcine model for childhood obesity(Reference Curtasu22). The daily feed intake for 6–9-month-old female minipigs is restricted to 300–400 g in order to prevent obesity(30). Although the low-protein diets in this study had slightly lower protein content than recommended standard diet (11 v. 13 %), the daily protein intake of these growing minipigs was covered with the at libitum feeding pattern (104 g with the low-protein diets v. 39–52 g with the standard diet). Obesity was induced in the model by feeding a high-fat high-fructose diet (diet LOFILOP), and after 20 weeks, the pigs were on average approximately twice as heavy as Göttingen minipigs fed according to manufacturers’ recommendations (31 v. 16 kg at 7 months of age)(30). The heavy fat accumulation created a preclinical stage with increased fasting glucose, signs of insulin deregulation and mild signs of liver inflammation (online Supplementary Table S2). Similar effects have been found in other studies with Göttingen minipigs(Reference Curtasu22,Reference Larsen, Rolin and Wilken31,Reference Christoffersen, Golozoubova and Pacini32) .
In the current 8-week intervention period with diets varying in DF and protein, the minipigs continued to gain weight although at a different rate depending on the dietary composition. Thus, the pigs fed the diet high in DF and low in protein consumed less feed and, consequently, gained less weight than the pigs on the other diets. The lower feed intake of the high-DF low-protein diet and the contrasting effects of DF and protein on weight gain are most likely related to: first, a lower nutrient digestibility, modified nutrient absorption and influence of DF on satiety(Reference Yu, Ke and Li9,Reference Nielsen, Laerke and Theil10) ; and second, positive influence of high protein on growth and modest influence on satiety. In earlier epidemiologically studies(Reference Hernandez-Alonso, Salas-Salvado and Ruiz-Canela33,Reference Halkjaer, Olsen and Overvad34) , a positive effect of high protein in particular of protein of animal origin on weight gain(Reference Halkjaer, Olsen and Overvad34), has also been observed presumably reflecting that the protein quality plays a crucial role. It should be noted that the low-DF low-protein diet used during development of obesity(Reference Curtasu22) and continued to be used in one of the dietary treatment (LOFLOP) in the current intervention study was specifically designed to provide a reduced protein content in order to redirect energy from lean tissue accretion to adipose tissue storage in this way diminishing muscle mass for glucose regulation(Reference Fisher, Scheffler and Kasten35). These aspects have to be taken into consideration when evaluating the effects of the high-protein diets on several biomarkers. For instance, the concentrations of albumin and aspartate transaminase in plasma are most likely a reflection of changed protein catabolism and turnover rates in the liver with a high dietary protein intake(Reference Thalacker-Mercer and Campbell36) rather than a marker for the MetS(Reference Adilah, Liew and Redzwan37). To support this view, relative organ weight(30), liver fat(Reference Fisher, Scheffler and Kasten35) and plasma inflammatory cytokines(Reference Curtasu22) were found to be in the normal range.
While we can expect the digestibility to be lower with the high-DF diets because of the insoluble nature of DF making it resistant to microbial degradation(Reference Nielsen, Laerke and Theil10,Reference Mudgil and Barak38) , there are also indications of satiety induced by gut hormones with DF. GIP was significantly reduced by high DF both at fasting and at non-fasting but with significantly higher levels during non-fasting than fasting. GIP stimulates insulin secretion in a manner related to the absorption of especially glucose and fat(Reference Baggio and Drucker39). The lower GIP level with high-DF diets and higher GIP level with the low-DF low-protein diet is without doubt a reflection of the influx of glucose being higher for the latter than the former diet. The GLP-1 level also showed borderline increase with the high-DF diets at the fasting stage, indicating an effect of DF on satiety after overnight fasting; the effect most likely being caused by the slower absorption of nutrients(Reference Warrilow, Mellor and McKune40) and possibly also triggered by fasting levels of SCFA being released from slowly fermented DF(Reference Müller, Hernández and Goossens41). GLP-1 increases rapidly after a meal and plays a key role in the regulation of insulin secretion and sensitivity thereby reducing post-meal glucose concentrations and improves β-cell proliferation(Reference Wang, Liu and Chen42). Overall, although no significant change was observed in insulin sensitivity with high DF at the fasting state, GLP-1 secretion induced by a possible slower nutrient absorption could potentially be protective against β-cell exhaustion. In contrast to GIP and GLP-1, the results on ghrelin diverge from the general understanding that DF can suppress ghrelin concentrations and thereby reduce the feeling of hunger(Reference Papathanasopoulos and Camilleri43) as the non-fasting level ghrelin was higher in the high-DF diets without influencing either feed intake or weight gain. A previous study with high-DF diets also demonstrated that satiety feeling may be unrelated to the ghrelin response and did not affect the following food intake(Reference Hartvigsen, Gregersen and Laerke6). It has also been found that an AX-enriched meal increases serum ghrelin levels in healthy human subjects with normal glucose tolerance(Reference Möhlig, Koebnick and Weickert44). However, given the ad libitum feeding pattern and expected delayed nutrient absorption with high DF, increased ghrelin levels could also occur earlier in the low DF groups, and as a result, there was no overall influence on either feed intake or weight gain.
We have previously shown that an AX-rich diet did not change postprandial glucose responses of pigs but induced a lower postprandial peak in insulin in portal vein, hepatic vein and mesentery artery compared with a low-DF Western-style diet(Reference Ingerslev, Theil and Hedemann45). In the present study, we did not see any effect of the high-DF diets on either glucose or insulin, which is in line with a study with human subjects with normal glucose tolerance where an AX-rich diet was found not to influence glucose or insulin responses(Reference Möhlig, Koebnick and Weickert44). Although we did not observe significant changes in insulin concentrations, we found higher non-fasting levels of C-peptide with the high-DF diets, which may be an indicator of improved secretory function of pancreatic β-cells. However, the higher level of C-peptide occurred without neither homeostatic model assessment for insulin resistance nor HOMA-β being influenced by DF. Of note, in our comparisons between species, it needs to be acknowledged that there are indications that C-peptide may have different functions in minipigs and humans(Reference Christoffersen, Golozoubova and Pacini32,Reference Chen, Zeng and Xu46) .
During the progression of obesity in this juvenile model, we did not observe any relationship between obesity development and IL-12 and IFN-γ (Reference Curtasu22). After 8 weeks of dietary interventions, however, elevated concentrations of IL-12 in the fasting state and IFN-γ in the fasting and non-fasting state were observed in pigs fed the high-DF diets. These results are in contrast to our expectations but generally in agreement with a recent study where it was concluded that the diet high in DF from enzyme-treated wheat bran did not affect low-grade inflammation(Reference Rakvaag, Fuglsang-Nielsen and Bach Knudsen47). The reason for lack of effect is most likely that the degree of inflammation is much less at obesity than under a pathogen infection where DF have been found to have immunomodulatory effects by reducing IL-12, IFN-γ and TNF-α production(Reference Bermudez-Brito, Faas and de Vos48). Moreover, the MetS, especially the systemic inflammation, has been strongly associated with general and central obesity(Reference Schmidt, Weschenfelder and Sander49), the absence of significant changes in obesity markers such as obesity index, backfat thickness and liver fat in the current study corresponded with the lack of effect on most inflammatory biomarkers except IFN-γ. The rationale of measuring at fasting and non-fasting is that inflammatory cytokines have been reported to change in response to a meal(Reference Polakof, Rémond and Rambeau50).
The two high-protein diets caused higher fasting glucose concentrations, a tendency for higher urinary glucose concentrations and a tendency for higher non-fasting insulin, GLP-1 and C-peptide concentrations but no differences in fasting insulin. The higher fasting glucose level is presumably caused by gluconeogenic amino acids including branched-chain amino acid, as indicated by the higher concentration of glucose in the jugular than the portal vein and higher urine pH at non-fasting. Although high branched-chain amino acid content of whey protein has shown insulionotropic effects in a short-term study(Reference Nilsson, Stenberg and Frid18), the long-term effects are contradictory(Reference Rietman, Schwarz and Tome51), and a positive association between high circulating branched-chain amino acid and obesity was found in our previous study(Reference Curtasu22), which may have detrimental effects on glucose and lipid homoeostasis of obese minipigs(Reference Polakof, Remond and David52). The increased expression of liver fructose-bisphosphatase 1, the rate-limiting enzyme in gluconeogenesis, on the high-protein diets is probably also related to a higher gluconeogenesis as also observed in young subjects with newly diagnosed T2D(Reference Chung, Hsia and Chacko53). Other studies have shown that high-protein diets, despite their beneficial effects on satiety, weight loss, and blood lipids, under certain conditions may modulate amino acid metabolic signature and be a factor in insulin resistance and T2D development(Reference Rietman, Schwarz and Tome51,Reference Hession, Rolland and Kulkarni54) . Moreover, a human intervention study with the same type of diets did not induce a higher GLP-1 response with high-protein diets(Reference Nielsen55), whereas this was the case when whey protein was provided as a pre-meal in an acute study(Reference Bjornshave, Holst and Hermansen19). The difference in response to protein in the current and the 12-week human intervention study(Reference Nielsen55) on GLP-1 compared with acute studies(Reference Bjornshave, Holst and Hermansen19,Reference Veldhorst, Nieuwenhuizen and Hochstenbach-Waelen56) could indicate that whey protein elicit responses by different mechanisms when provided acutely compared with a chronic intake.
Neither whey protein nor DF influenced total cholesterol in plasma but whey protein increased non-fasting LDL and the LDL:HDL ratio. A higher fasting NEFA concentration was also observed when feeding the high-protein diets. Combined these data indicate an unfavourable progression towards dyslipidaemia when feeding the high-protein diets. In a recent 12-week intervention study with human subjects with abdominal obesity, it was found that whey protein in combination with a low-DF diet reduced total fasting cholesterol, whereas high DF had the opposite effect(Reference Rakvaag, Fuglsang-Nielsen and Bach Knudsen16).
Obesity-driven insulin resistance in white adipose tissue, liver and skeletal muscle is the primary cause of T2D and is linked to obesity-associated metabolic abnormalities such as dyslipidaemia and inflammation(Reference Longo, Zatterale and Naderi57). Therefore, we explored how DF and protein interventions would affect the expression of key regulatory genes involved in carbohydrate and lipid metabolism, inflammation and transcription factors in liver, muscle and sATs. We observed an increased relative gene expression of PPARγ in muscle tissue in the LOFHIP group, which potentially can be linked to impaired insulin sensitivity. PPARγ plays an important role in regulating insulin action in skeletal muscle(Reference Park, Ciaraldi and Abrams-Carter58), and mRNA and protein expression of PPARγ has been found to be higher in muscle tissue of humans with severe insulin resistance(Reference Park, Ciaraldi and Abrams-Carter58,Reference Loviscach, Rehman and Carter59) . These data also corroborate the higher fasting glucose concentrations and tendency for higher non-fasting insulin concentrations in high-protein diets. It appears that DF may attenuate the detrimental effect of protein as increased gene expression of PPARγ was only found in diet with high protein and low DF content.
The high-fibre low-protein diet induced a significantly elevated expression of leptin receptor in the adipose tissue, the signalling pathway through which leptin controls energy balance(Reference Friedman60). This may suggest improved responsiveness to leptin and potentially be associated with the reduced feed intake and weight gain in this particular group. A lower leptin receptor mRNA abundance in the sAT has been associated with morbid obesity when compared with lean human subjects and strongly correlated with insulin sensitivity(Reference Seron, Corset and Vasseur61). A previous study also found that leptin receptor overexpression in adipose tissue of leptin receptor transgenic mice could reduce BW and fat deposition(Reference Wang, Orci and Ravazzola62). As a central enzyme involved in lipid biosynthesis, FASN gene expression in adipose tissue has been associated with visceral fat accumulation and impaired insulin sensitivity(Reference Berndt, Kovacs and Ruschke63). In our study, however, the relative expression of FASN was suppressed significantly by the high DF content, which potentially can explain the lower weight gain and improved non-fasting C-peptide concentrations in the high DF groups.
Our study has several strengths but also some weaknesses. First, we performed a randomised long-term ad libitum intervention study with well characterised and controlled diets. Second , our sample size based on the power calculation was sufficient to allow a reliable detection of changes in metabolic biomarkers. Third, we present very comprehensive clinical parameters both at non-fasting and fasting. Fourth, we use innovative ingredients including whey protein hydrolysate as protein source and enzyme-related wheat bran as DF source. The study, however, also has limitations that need to be acknowledged. First, we cannot exclude that the growth of animals may have masked the effects of DF and protein; thus, further studies are needed to clarify whether DF and high protein can synergistically affect the MetS in an adult obese model with stable weight. Second, a lean control group of pigs feeding on a regular diet was not included as the primary purpose of this study was to investigate the effects of DF and protein on obesity. Third, since whey protein and enzyme-treated wheat bran were the only protein and fibre source used to increase dietary protein and DF levels, we cannot conclude whether the effects were induced by the specific sources or by the levels of protein and DF, and further studies on other DF and protein sources are needed. Moreover, in this paper, we have only presented mRNA data and protein expression of the regulatory genes were not analysed. Since mRNA expression is not always correlated with protein expression as well as with the activation or function of corresponding proteins, the gene expression findings need to be interpreted with caution and warrant further studies.
In conclusion, the present study demonstrates that an 8-week dietary intervention with DF and protein did not improve glucose and insulin response directly in an obese minipig model. However, we demonstrated that a diet enriched with DF from enzyme-treated wheat bran reduced weight gain and had a potential beneficial effect on β-cell secretory function but without effects on lipid biomarkers. Diets enriched in whey protein hydrolysate tended to increase post-meal insulin levels and several markers related to lipid and carbohydrate metabolism in an unfavourable way. In contrast to our hypothesis, a combination of high- or low-DF and -protein diets did not show a synergistic effect on insulin sensitivity, postprandial lipaemia, metabolic or inflammatory biomarkers associated with the MetS as it was also found in a recent human intervention study(Reference Nielsen55) and concluded in a recent review on the impact of DF consumption on insulin resistance and the prevention of T2D(Reference Weickert and Pfeiffer15).
Acknowledgements
The authors thank Winnie Østergaard, Lisbeth Märcher, Stina Greis Handberg, Kasper Vrangstrup Poulsen, Søren Krogh Jensen, Anette Møjbæk Pedersen and Elsebeth Lyng Pedersen and staff at the animal facility for excellent technical assistance. The authors thank Leslie Foldager for data consultation. Whey protein hydrolysate was kindly provided by Arla Foods Ingredients Group P/S. Wheat bran was delivered by Lantmännen and enzymatically heated by DuPont Industrial Bioscience. The work was financially supported by Innovation Fund Denmark (4105-00002B) and industrial partners involved in the MERITS (Metabolic Changes by Carbohydrate and Protein Quality in the Development and Mitigation of Metabolic Syndrome) project. Y.T.X. acknowledges scholarship from China Scholarship Community.
This work was supported by grants from the Innovation Fund Denmark – MERITS (4105-00002B).
K. E. B. K., H. N. L. and M. S. H. conceived and designed the research; M. V. C., H. N. L., and M. S. H performed the animal experiments; H. N. L. and Y. X. analysed the data; P. K. T. provided data consultation; Y. X. wrote the paper; all co-authors contributed to draft review.
The authors declare that there are no conflicts of interest.
Supplementary material
For supplementary material referred to in this article, please visit https://doi.org/10.1017/S0007114520003141


