


Introduction
Knowledge of the local mechanical properties of materials at high strain rates is pivotal for understanding the deformation and failure behavior of materials under a wide range of conditions, such as forming, cutting, piercing, machining, etc. Nanoindentation is often the method of choice for performing local mechanical measurements, but in its traditional form it is rarely used above strain rates of ∼0.1 s−1. Although a great deal of recent research and development has been aimed at achieving higher indentation strain rates [Reference Zehnder, Peltzer, Gibson and Korte-Kerzel1, Reference Phani and Oliver2, Reference Guillonneau, Mieszala, Wehrs, Schwiedrzik, Grop, Frey, Philippe, Breguet, Michler and Wheeler3, Reference Wheeler, Dean and Clyne4, Reference Somekawa and Schuh5, Reference Zehnder, Bruns, Peltzer, Durst, Korte-Kerzel and Möncke6, Reference Beake, Smith and García7, Reference Kermouche, Grange and Langlade8, Reference Wheeler and Gunner9], several critical technical and theoretical issues must still be overcome before instrumented indentation testing can be used routinely to provide reliable high strain rate measurements. The remaining challenges involve both the capability of the testing systems to acquire precise, meaningful data at very high rates and how the data should be reduced to account for a variety of phenomenon that are not observed in conventional nanoindentation testing, e.g., the influence of measurement and control time constants [Reference Phani and Oliver2].
Several different approaches to achieving high strain rate nanoindentation have recently been reported [Reference Zehnder, Peltzer, Gibson and Korte-Kerzel1, Reference Phani and Oliver2, Reference Guillonneau, Mieszala, Wehrs, Schwiedrzik, Grop, Frey, Philippe, Breguet, Michler and Wheeler3, Reference Wheeler, Dean and Clyne4, Reference Somekawa and Schuh5, Reference Zehnder, Bruns, Peltzer, Durst, Korte-Kerzel and Möncke6, Reference Beake, Smith and García7, Reference Kermouche, Grange and Langlade8, Reference Wheeler and Gunner9]. Guillonneau et al. have had great success using a system based on piezoelectric displacement actuation along with a special piezo-based force transducer to increase the rate at which reliable data can be obtained [Reference Guillonneau, Mieszala, Wehrs, Schwiedrzik, Grop, Frey, Philippe, Breguet, Michler and Wheeler3]. With this new system, indentation strain rates of up to 103 s−1 have been achieved with a Berkovich indenter, placing the measurements in the ballistic range. A second attractive approach to conducting high strain rate nanoindentation was recently presented by Phani and Oliver [Reference Phani and Oliver2]. They showed that by increasing the data acquisition rate of a conventional nanoindenter into the 100-kHz range and conducting step-load nanoindentation tests in which the influences of damping and inertia on the force transmitted to the specimen can be properly accounted for by direct measurement of the indenter velocity and acceleration, indentation strain rates as high as 104 s−1 can be achieved during the small depth indentation of soft metals.
One important issue with the high strain rate techniques is that they are often difficult to combine with two of the more common measurement techniques used in conventional nanoindentation testing: (i) constant strain rate testing (CSR) and (ii) continuous stiffness measurement (CSM). CSR is used to maintain the indentation strain rate  $\dot{\varepsilon } = {{\dot{h}} \over h}$ at a constant value as the indenter penetrates the material to ever increasing depths h. In a material in which the hardness is independent of depth, i.e., a monolithic material in which there is no indentation size effect, the indentation strain rate, and rate of loading, $\dot{P}$, are related through:
 $$\dot{\varepsilon } = {{\dot{h}} \over h} = {{\dot{P}} \over {2P}}\quad ,$$
where P is the instantaneous load [Reference Lucas and Oliver10]. For load-controlled testing systems, as are common in commercial nanoindentation systems, a constant indentation strain rate can thus be achieved by maintaining  ${{\dot{P}} \over P}$ constant. From Eq. (1), it is apparent that the load (P)—time (t) and displacement (h)—time (t) relations for CSR loading are as follows:
 $$P\left( t \right) = A \cdot {{\rm{e}}^{2\dot{\varepsilon } \cdot t}}\quad ,$$
 $$h\left( t \right) = B \cdot {{\rm{e}}^{\dot{\varepsilon } \cdot t}}\quad ,$$
where A and B are material constants. Note that these strain rate definitions apply to sharp, geometrically self-similar indenters, like the Berkovich triangular pyramid commonly used in nanoindentation testing. For indentation with other indenter geometries such as spheres or flat punches, different definitions of strain rate based on normalizing the indenter velocity by the contact radius rather than the contact depth may be more appropriate (see for instance, Bower et al. [Reference Bower, Fleck, Needleman and Ogbonna11], Ginder et al. [Reference Ginder, Nix and Pharr12], or Feldner et al. [Reference Feldner, Merle and Göken13]).
Over the years, CSR testing has proven to have significant advantages over the more common constant load-rate scheme (CLR). For instance, the latter yields rather unreliable hardness measurements on fine-grained metals because they are usually strain rate sensitive [Reference Maier, Schunk, Göken and Durst14, Reference Durst and Maier15]. In contrast, CSR has proven very useful in measuring strain rate sensitivities by means of strain rate jump tests [Reference Maier, Durst, Mueller, Backes, Höppel and Göken16].
CSR is almost inevitably combined with the CSM technique, which provides the stiffness data required for the evaluation of the hardness and Young’s modulus by the Oliver–Pharr method. This is because CSM is well suited for accessing these data under CSR conditions, although the alternative—which consists in measuring the stiffness from unloading from peak force—amounts to evaluating the hardness at a varied strain rate [Reference Leitner, Maier-Kiener and Kiener17]. With CSM, a small oscillation is imposed on the force (or displacement) loading signal applied to the indenter, whereas a lock-in amplifier is used to measure the amplitude and phase of the displacement (or force) signal at the same frequency [Reference Hay, Agee and Herbert18]. Introduced by Pethica and Oliver in the late 1980s [Reference Oliver and Pethica19, Reference Pethica and Oliver20], CSM has proven especially important for investigating the properties of graded samples and thin film coatings [Reference Han, Saha and Nix21, Reference Li and Vlassak22, Reference Merle, Nicholson, Herbert and Göken23], as well as for local measurements of the strain rate sensitivity [Reference Feldner, Merle and Göken13, Reference Maier, Durst, Mueller, Backes, Höppel and Göken16, Reference Alkorta, Martinez-Esnaola and Sevillano24] and the creep stress exponent [Reference Lucas and Oliver10, Reference Ginder, Nix and Pharr12, Reference Maier, Merle, Göken and Durst25]. However, it has recently been shown that significant issues in using the CSM technique are to be expected at high indentation strain rates, due to what has been deemed “plasticity error” [Reference Merle, Maier-Kiener and Pharr26]. This will be discussed in greater detail in the next section.
In this work, we explore how some of the inherent limits in high strain rate nanoindentation testing can be extended through a careful knowledge of the dynamics of the testing system. Experimental results are presented that show that without any modification of a commercial system, there are ways to potentially increase the range of strain rates by about an order of magnitude, while maintaining the full capabilities offered by CSR and CSM testing. The methods are described in detail and applied to a material that exhibits a strong strain rate sensitivity at room temperature—a Zn22Al superplastic alloy.
Strain rate limitations in the CSM method
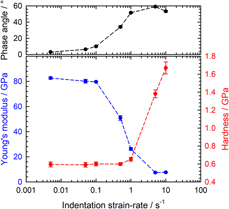
Recent experimental work has revealed that there is a significant flaw in CSM stiffness evaluation when the measurement is performed at a very high penetration rate [Reference Merle, Maier-Kiener and Pharr26]. As detailed in the “Methodology > Modeling the CSM plasticity issue” section, it has been shown that the stiffness measured at high strain rates with the CSM technique is subject to errors caused by the onset of plastic deformation during the small force or displacement oscillation that enables the CSM testing [Reference Merle, Maier-Kiener and Pharr26]. This problem is most pronounced in materials with a high elastic modulus-to-hardness ratio, E/H, tested at small CSM oscillation frequencies and small oscillation amplitudes [Reference Merle, Maier-Kiener and Pharr26]. An example is shown in Fig. 1 for a coarse-grained aluminum sample (E/H = 140). Using standard CSM techniques with an oscillation frequency f = 110 Hz and an RMS displacement oscillation amplitude Δh RMS = 2 nm, the data in the figure show that Young’s modulus measured for this material is correct up to indentation strain rates of about 0.1 s−1, but then dramatically decreases. The upper diagram reveals that this decrease is accompanied by an increase of the phase angle to values much greater than 10°, a tell-tale sign that plasticity error has affected the measurements [Reference Merle, Maier-Kiener and Pharr26]. Curiously, at the point at which the modulus begins to decrease, the hardness initially remains unaffected (see Fig. 1). This can be understood from the way in which the hardness is computed from the CSM measured parameters. Assuming that the contact area of the indenter A c is adequately described by a perfect area function ( ${A_{\rm{c}}} = 24.56h_{\rm{c}}^2$ for a Berkovich indenter), the CSM hardness is computed from the stiffness, S, and load, P, using the following equation:
 $$H = {P \over {{A_{\rm{c}}}\left( {{h_{\rm{c}}}} \right)}} \approx {P \over {24.56{{\left( {h - \varepsilon {P \over S}} \right)}^2}}}\quad ,$$
where ε is an indenter dependent constant with a value close to 0.75 for the Berkovich indenter [Reference Oliver and Pharr27]. Close inspection of the relation shows that the hardness, thus, depends more strongly on the indentation depth than the stiffness, provided the stiffness is approximately correct. However, at higher strain rates, the strong underestimation of the stiffness due to large plasticity error leads to more severe underestimation of the contact depth h c, and an associated increase in the hardness. In Fig. 1, the hardness increase initiates at a strain rate of about 1 s−1, which is an order of magnitude larger than the breakdown in Young’s modulus. Even though materials with a smaller E/H ratio than the coarse-grained aluminum will experience this transition at a higher strain rate, it is clearly an issue for high strain rate hardness characterization and a major impediment to strain rate sensitivity measurements, which are very sensitive to small variations in hardness.

Figure 1: Apparent Young’s modulus and hardness of a coarse-grained aluminum sample from standard CSM tests evaluated by the Oliver–Pharr method in the depth interval 2000–3000 nm. The measurements were performed with a KLA InForce1000/iMicro system using the standard harmonic parameters f = 110 Hz and Δh RMS = 2 nm.
To determine the limiting strain rate for valid CSM measurements, it is necessary to quantify the CSM plasticity error as has been addressed in an approximate way in Ref. Reference Merle, Maier-Kiener and Pharr26. Based on the refined semi-empirical model described in section “Methodology > Modeling the CSM plasticity issue”, it is possible to predict the maximum indentation strain rate yielding a plasticity error of less than 5% for the measured stiffness, i.e., a value that would have a negligible effect on the measured hardness and modulus [see Eq. (6)]. Results for the commercially available G200 and iMicro nanoindentation systems are shown in Fig. 2. As shown in the figure, there are important differences in these two machines regarding the frequency and amplitude of the displacement oscillation used for CSM testing. The plot shows that for typical metals with a ratio E/H = 150, CSR indentation testing can be safely performed up to indentation strain rates of up to 0.02 s−1 for the G200 and 0.1 s−1 for the iMicro, which correspond well with the parameters recommended by the manufacturers. However, Fig. 2 also shows that caution is warranted when measurements are to be performed at higher strain rates.
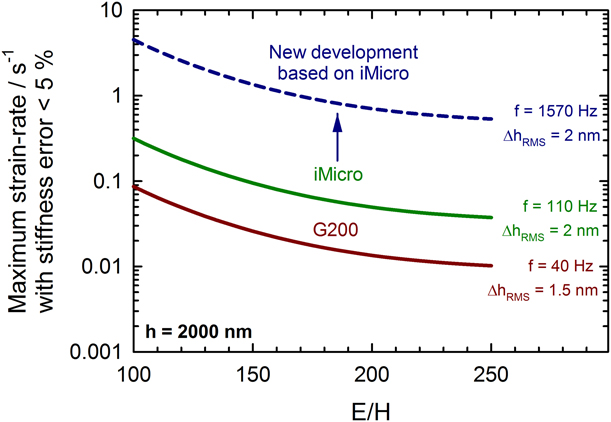
Figure 2: Prediction of when strain rates will be unaffected by plasticity error at a typical depth of h = 2000 nm. The data are plotted as a function of the elastic-to-plastic ratio, E/H, based on the semi-empirical Eq. (6) and an assumed error in stiffness of no more than 5%. The red and green curves correspond to the commercial indentation platforms used for this study. The assessment was made under the assumption that the default harmonic parameters of the machines are used. Higher strain rates might be achievable with optimized parameters.
A method for extending the range of strain rate for CSM testing
An attractive workaround for accessing higher strain rates with CSM measurements is to increase the harmonic frequency of the CSM signal, which results in increasing the measurable strain rates by a similar amount (compare the green and blue curves in Fig. 2). This is generally a safer strategy than increasing the harmonic displacement amplitude, Δh harm, which under many circumstances would only exchange the CSM plasticity error for the CSM dynamic unloading error [Reference Pharr, Strader and Oliver28], also resulting in an underestimation of the stiffness.
Unfortunately, there are valid reasons why manufacturers do not offer commercial products operating at such high frequencies. One of them is related to the machine compliance and damping corrections applied to the raw signal, which are premised on the assumption that the indenter column behaves like a 1D simple harmonic oscillator (see Ref. Reference Hay and Herbert29). Unfortunately, this assumption breaks down at frequencies significantly higher than the natural frequency of the system (and/or at very high contact stiffnesses). Furthermore, the 1D harmonic model does not take into account other resonant deformation modes of the column, sample, and stage that can be triggered by high-frequency oscillations.
To examine the errors in contact stiffness measurements at high frequencies, a series of nanoindentation experiments was performed on a Zn22Al sample indented to three different depths (or loads), thus producing three distinct contact stiffnesses. Results are shown in Fig. 3(a). At each depth, the apparent contact stiffness was measured as a function of the oscillation frequency using a harmonic displacement oscillation of 2 nm (RMS) and sweeping the frequency from 1 to 2000 Hz using an iMicro testing system with an InForce50 actuator. Figure 3(a) shows that the contact stiffness is correct (error < 5%) and independent of the applied load up to a frequency of about 300 Hz, corresponding to twice the natural frequency of the system (157 Hz). However, at higher frequencies, the errors in stiffness are generally much greater and quite variable, presumably due to the secondary resonant frequencies mentioned previously. Furthermore, and more problematic, the three curves for different indentation sizes and contact stiffnesses do not overlap, meaning that the error on stiffness depends on the indentation size or applied load. For this reason, stiffness measurements at dynamic frequencies greater than a few multiples of the natural frequency should be viewed with caution, if not totally avoided. Curiously, however, the data in Fig. 3(a) clearly show that there are a few specific frequencies, or “sweet spots”, at which the stiffness error is small (<5%) and independent of the contact stiffness. An example of a particularly strong sweet spot at 1570 Hz is shown in Fig. 3(b). The sweet spots presumably originate when errors of opposite sign due to secondary resonances and/or 1D model breakdown cancel each other almost perfectly. Obviously, where sweet spots occur is dependent on the dynamics of the testing machine, but they can be verified by repeating the frequency sweep conducted on several different samples. With the iMicro/InForce50 system used for the current tests, the highest accessible sweet spot was found at 1570 Hz, and this frequency was selected for all further tests, starting with fused silica. The good agreement with measurements at the reference harmonic frequency (110 Hz) visible in Fig. 4(a) confirms the validity of the new approach. In detail, the measurement at 1570 Hz results in a small overestimation of the elastic modulus (up to 4%) at an indentation depth < 100 nm. Figure 4(b) reveals that this corresponds to a small deviation of the S2/P signal from its theoretically constant value (of approximately 665 GPa for Berkovich indentation on fused silica), which hints at an imperfect machine compliance correction at very low load. Anyway, the deviation is small and affects only a limited depth range, which is hardly relevant for practical applications. If needed, it could be further minimized by performing a new tip area calibration at 1570 Hz. Figure 4(a) also evidences a higher scattering in modulus than at the reference harmonic frequency, which is a consequence of a noisier CSM signal. If needed, this could be improved by slightly damping the CSM feedback control. Deeper than 200 nm, the experimental values are perfectly in line with the reference data and the noise level is more moderate, so that measurements can be carried out unreservedly.
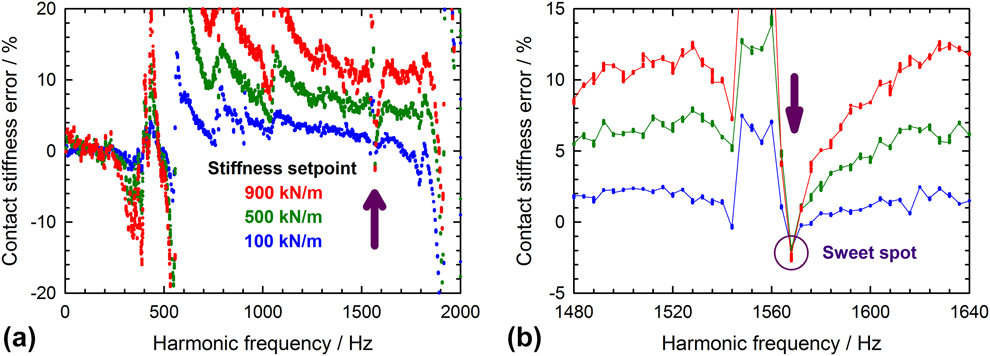
Figure 3: Error in stiffness due to the imperfect correction for resonant and machine-related effects: (a) Full calibration, which was measured by sweeping the harmonic frequency while in contact with a Zn22Al sample and maintaining a constant stiffness. (b) Close-up of a stiffness-independent “sweet spot” at 1570 Hz, which is specific to the testing system and actuator head used for these measurements (InForce50).
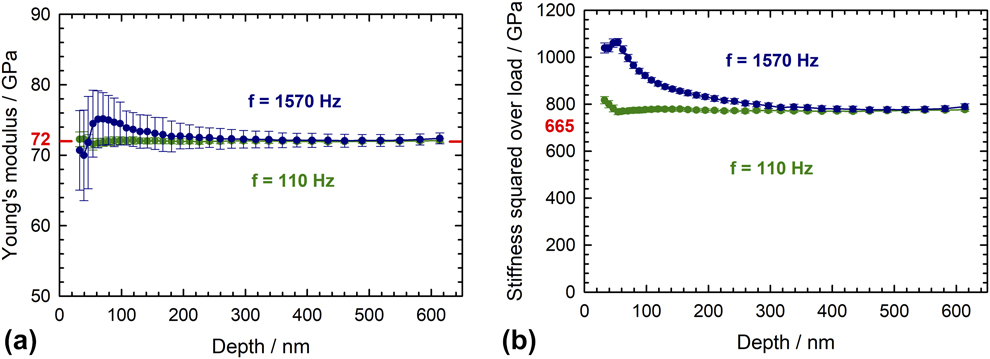
Figure 4: CSR measurements on fused silica at the harmonic frequencies of 1570 Hz (sweet spot) and 110 Hz (reference): (a) Young’s modulus (b) ratio between contact stiffness squared and load. All other parameters were kept to the standard values of the iMicro. At least 17 tests were performed at each frequency.
Application to the measurement of strain rate sensitivity in Zn22Al
The “sweet spot” and much higher than normal harmonic oscillation frequency at which the testing system is well-behaved allows for the measurement of strain rate sensitivity of materials, m, at much higher strain rates. In this study, strain rate jump testing [Reference Maier, Durst, Mueller, Backes, Höppel and Göken16]—which consists of a rapid succession of CSR sequences—was applied to a series of Zn22Al superplastic alloys with three different mean grain sizes [Reference Feldner, Merle and Göken30]. The outcome of all tests is summarized in Fig. 5(a), where the measurements have been made at indentation strain rates up to 10 s−1. While the peak in strain rate sensitivity in the strain rate range 10−3 to 10−1 s−1 corresponds to expectations for this superplastic alloy [Reference Feldner, Merle and Göken30], there is a further increase commencing at about 1 s−1 which is probably not real but caused by plasticity error. Indeed, it is expected that the strain rate sensitivity should continuously decrease down to zero in the regime III deformation mode [Reference Feldner, Merle and Göken30]. At first inspection, there is no suggestion that the corresponding hardness data are flawed, as Fig. 5(b) does not show an obvious increase in hardness as was observed in aluminum (see Fig. 1). However, a closer inspection of the experimental data revealed that the strain rate sensitivity measurements are only valid up to about 1 s−1 [see Fig. 5(c)] because at higher strain rates (jump around 5 s−1 and above), the phase angle increased to about 10°, suggesting the onset of CSM plasticity error. This critical value for the strain rate at which the plasticity error becomes significant is consistent with the prediction in Fig. 2 of about 4 s−1 for a material with an E/H ratio of 100. The stiffness underestimation causes a slight error in the hardness measurements, which results in a much larger error in the strain rate sensitivity values. This illustrates how demanding strain rate sensitivity measurements are. More importantly, however, we note that conducting experiments at the higher oscillation frequency of 1570 Hz succeeded in increasing the range of measurements to strain rates of about 1 s−1, about an order of magnitude higher than those that could be achieved at the standard oscillation frequency of 110 Hz.
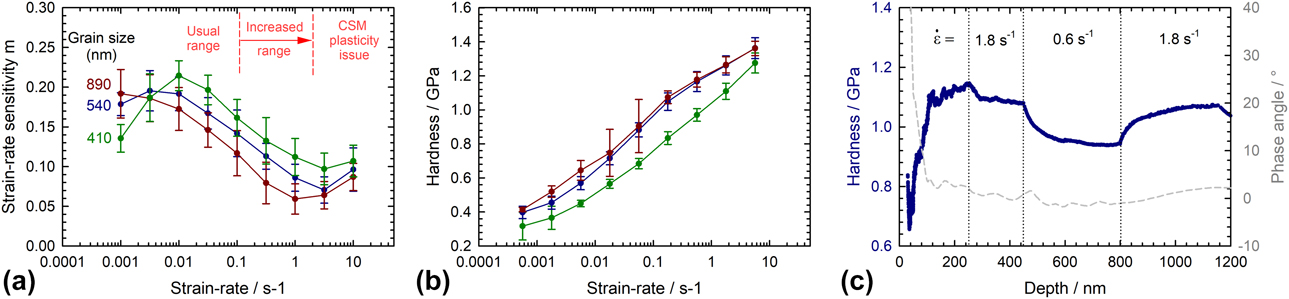
Figure 5: Nanoindentation strain rate jump testing for Zn22Al samples with different mean grain sizes: (a) Measured strain rate sensitivity m as a function of the applied strain rate. (b) Corresponding evolution of the hardness. (c) Typical strain rate jump test, performed at  $\dot{\varepsilon } \approx 1\;{{\rm{s}}^{ - 1}}$. Testing was performed with an InForce50 actuator at a harmonic frequency of 1570 Hz.
Discussion and conclusions
With CSM, accessing high strain rates is severely limited by the plasticity error reported in Ref. Reference Merle, Maier-Kiener and Pharr26. Its occurrence results in an overestimation of the hardness, which is generally milder than the underestimation of the Young’s modulus, but can nonetheless have very detrimental consequences. Because it scales with the applied strain rate, the error in hardness is especially critical for the evaluation of the strain rate sensitivity. Monitoring the phase angle appears to be a robust means of detecting and identifying such an error.
To extend the experimental strain rate range, a promising workaround consists of increasing the CSM harmonic frequency. With current testing systems, the existence of sporadic “sweet spot” frequencies not affected by secondary resonances provides opportunities for increasing the strain rate. As a proof of concept, an iMicro system equipped with an InForce50 head was successfully operated at 1570 Hz to perform valid CSR measurements on a superplastic alloy sample up to about 1 s−1, an order of magnitude improvement. At such intermediary penetration rates, inertial and damping effects are still negligible, so that relatively standard procedures can be used with conventional testing systems.
Pushing the envelope much further would require significant modifications to the testing hardware to develop new systems with much higher natural frequencies, through, e.g., reduction of the mass of the system. In addition, modifications might be needed to reduce the time constant of the CSM lock-in amplifier used for the measurement of the stiffness. Indeed, as shown in the “Methodology > The CSM time constant” section, higher time constants produce longer stiffness transients during measurements on graded samples or after steep strain rate jumps. At current strain rates of ≤1 s−1, a lock-in time constant of about 100 ms appears sufficient to limit the transients to a reasonable duration. However, this issue would be compounded at higher strain rates.
Methodology
Experimental procedures
Nanoindentation experiments were performed with an iMicro nanoindentation testing system (KLA Corporation, Oak Ridge, TN and Milpitas, CA), equipped with InForce50 and InForce1000 actuator heads. These measurements were compared with indentations made with a G200 nanoindenter (KLA), equipped with XP and DCM2 heads. The dynamic properties of the instruments, as measured from free oscillations in air [Reference Hay, Agee and Herbert18], are listed in Table I. Unless otherwise stated, the standard CSM time constants listed in the table were used.
TABLE I: Dynamic properties of the measurement heads used in combination with the G200 and iMicro nanoindentation platforms at Texas A&M University and Friedrich-Alexander-University Erlangen-Nürnberg (FAU).

The superplastic Zn22Al alloy specimens were prepared by melting 99.7 at.% purity Al and 99.9 at.% purity Zn using the eutectoid mass ratio Zn/Al = 78/22. The as-cast material was homogenized at 643 K for 12 h and water-quenched. The samples were annealed at 533 K for 0 min, 20 min, and 188 h, to vary the grain size. The surfaces were prepared for nanoindentation testing by grinding with a 1-µm diamond and polishing with an oxide polishing suspension (Struers AG, Willich, Germany). The coarse-grained aluminum specimen was a system standard provided with the iMicro by KLA.
Modeling the CSM plasticity issue
The CSM plasticity issue as described by Merle et al. [Reference Merle, Maier-Kiener and Pharr26] occurs when the underlying assumption that the great majority of deformation during a CSM oscillation cycle is elastic is broken. This happens whenever the rate of penetration of the indenter is not slow compared with the CSM oscillation. In that case, plastic deformation occurs toward the end of each oscillation cycle, when the load is raised to new high levels. As a result, the sample experiences intermittent plastic deformation, as shown in Fig. 6. This creates distortions in the displacement signal fed to the lock-in amplifier, which result in a systematic error during the evaluation of the harmonic amplitude, and this ultimately yields an underestimation of the contact stiffness and an overestimation of the measured phase angle. Although the physical origin of the stiffness measurement error is clear, predicting its magnitude is not so simple because it depends on the algorithms used to perform the measurements in the lock-in amplifier. A very rough assessment can be achieved by considering the respective slopes (equations in Appendix 2 in Ref. Reference Merle, Maier-Kiener and Pharr26) of the elastic–plastic and purely elastic parts of an individual CSM oscillation. If one were to measure the contact stiffness by performing a linear regression of the P–h data acquired over the duration of an oscillation, it follows that the stiffness underestimation ΔS would be as follows:
 $${\left. {{{\Delta S} \over S}} \right|_{{\rm{linear}}\;{\rm{regression}}}} = {{1 - \pi \cdot \tan \;\psi \cdot \alpha \cdot {H \over {{E_{\rm{r}}}}}} \over {{{4\Delta h \cdot f} \over {\dot{\varepsilon } \cdot h}} + 1}}\quad ,$$
where α is the pile-up coefficient, ψ the opening half angle of the indenter, f the harmonic frequency, Δh the harmonic amplitude, and E r the reduced elastic modulus defined in its normal way (see Ref. Reference Merle, Maier-Kiener and Pharr26). In actuality, experiments on a wide range of materials have shown that the stiffness underestimation by the CSM lock-in amplifier is not as high as predicted by Eq. (5), presumably because the measurement algorithms used by the lock-in amplifier mitigate the plastic yield issue better than a linear regression does. We, therefore, opted for a phenomenological approach, based on experimental data from the wide range of materials shown in Fig. 7. Noting that the experimental data and the asymptotic value of the model seem to converge for materials with very high E/H ratios, a semi-empirical description of the underestimation of the stiffness during CSM Berkovich indentation is given by the following equation:
 $${\left. {{{\Delta S} \over S}} \right|_{{\rm{CSM}}}} \approx {1 \over {{{4\Delta h \cdot f} \over {\dot{\varepsilon } \cdot h}} + 1}} \cdot {1 \over {{{\rm{e}}^{{{170 - {E / H}} \over {40}}}} + 1}}\quad .$$
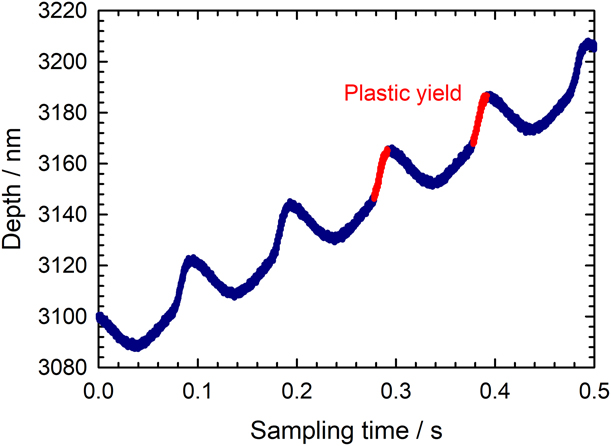
Figure 6: Experimental observation of cyclic plastic yield during indentation on coarse-grained aluminum with an iMicro/InForce1000 nanoindenter. The harmonic frequency was set to 10 Hz and the experimental data were recorded at 100 kHz acquisition rate. The red regions on the curves are periods in the oscillation cycle when the yield stress is exceeded and the material deforms plastically.
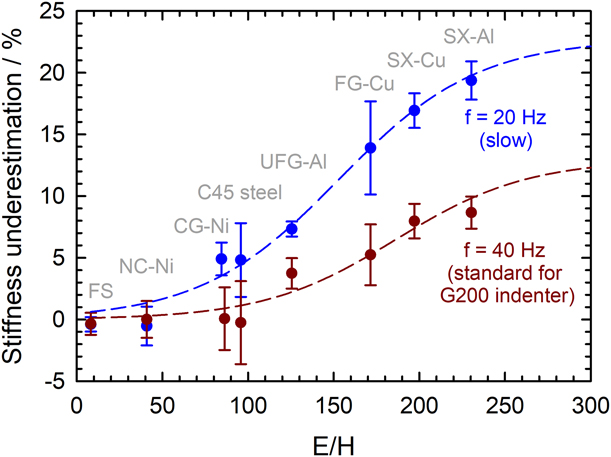
Figure 7: Stiffness underestimation by the CSM lock-in amplifier because of the plasticity issue. The measurements were performed on materials with different E/H ratios at approximately 2000 nm depth, running a Nanoindenter G200 at two different harmonic frequencies (and  ${{\dot{P}} \over {2P}} = 0.025\;{{\rm{s}}^{ - 1}}$, Δh RMS = 2 nm). The dashed lines correspond to the semi-empirical model in Eq. (6).
Note that caution should be exercised when using this equation because it is derived from data collected on a specific indentation platform type (G200 with XP head). Nonetheless, the order of magnitude of the prediction should be correct, and the equation is expected to be very accurate for materials with very high E/H ratios.
The CSM time constant
To date, the time constant associated with CSM measurements has not been scrutinized as much as the load and displacement time constants, which are not critical at the moderately high strain rates discussed here. The CSM time constant is defined as the duration of the signal integration performed by the lock-in amplifier. Large values have long been favored because they are very effective at improving the signal-to-noise ratio of the stiffness measurement. For instance, the 10-year-old G200 platform features a CSM time constant of 1 s, which is several orders of magnitude larger than for the force and displacement measurement time constants. Surprisingly, and as reported in a previous publication [Reference Merle, Maier-Kiener and Pharr26], the selected value of the CSM time constant hardly influences the stiffness measurements during standard CSR experiments on homogeneous samples. This is because the feedback control of the indenter usually excels at keeping the harmonic displacement constant during CSR indentation; whence, the stiffness calculation does not suffer from any time delay in the harmonic displacement measurement.
However, this does not hold true any longer when measurements are performed on heterogeneous samples or at strain rates far-off from the optimum for the feedback control, e.g., layered samples or strain rate jump tests performed on very strain rate–sensitive materials. In these cases, the harmonic displacement cannot be kept relatively constant during indentation, and the measured stiffness is in error as a consequence of the large time constant. Figure 8 shows an extreme case where both a transition in mechanical properties and the high velocity of the indentation prevent the feedback loop from keeping the harmonic displacement constant when large CSM time constants (≥1 s) are used. This results in significant fluctuations and errors in the measured stiffness and elastic modulus, which are largely avoided when the time constant is reduced to 100 ms. They would not be noticeable on modern indentation platforms, such as the iMicro, which uses an even smaller CSM time constant of only 50 ms.
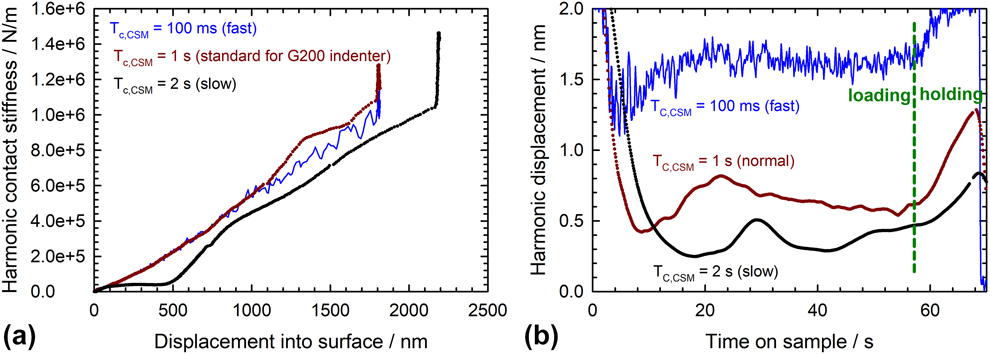
Figure 8: Effect of the lock-in time constant on the stiffness measurement during dynamic indentation of a 1 µm SiO2 film on Si at unusually high strain rate (G200 nanoindenter,  ${{\dot{P}} / {2P}} = 0.1\;{{\rm{s}}^{ - 1}}$, Δf = 40 Hz and Δh RMS = 2 nm): (a) Stiffness measurements showing oscillations for large time constants. (b) Corresponding harmonic displacement data evidencing an oscillation of the harmonic amplitude caused either by a change in mechanical properties from the film to the substrate and/or by the feedback loop not being optimized for the high penetration rate.
Acknowledgments
B.M. would like to express his deepest gratitude to Patrick Feldner for providing the Zn22Al samples, as well as to Zhiyuan Liang, Yvonne Dieudonné, and Christopher Walker for their kind support during his research stay at Texas A&M University. B.M. acknowledges funding from the German Research Foundation (DFG) through grant ME-4368/7-1. This research used resources from the Center for Nanoanalysis and Electron Microscopy (CENEM) and the Interdisciplinary Center for Nanostructured Films (IZNF) at Friedrich-Alexander University Erlangen-Nürnberg (FAU). WHH and GMP’s contributions to this work were supported by the U.S. Department of Energy, National Nuclear Security Administration, under Award No. DE-NA0003857.


 Open access