


Introduction
Over the last 25 yr, no weed has had a greater impact on cotton (Gossypium hirsutum L.) production systems in the United States than Palmer amaranth (Amaranthus palmeri S. Watson) (MacRae et al. Reference MacRae, Webster, Sosnoskie, Culpepper and Kichler2013; Vulchi et al. Reference Vulchi, Bagavathiannan and Nolte2022). Amaranthus palmeri emerged as the most problematic weed in cotton production systems in the early 2000s shortly after the widespread adoption of glyphosate-resistant (herbicide-resistant, or HR) cotton varieties in the U.S. Southeast (Webster et al. Reference Webster, Theodore, Robert, Webster and Nichols2012). While widespread adoption of HR cotton helped to catalyze increased area under conservation tillage, a reduction in the diversity of herbicide sites of action (SOAs) used to manage weeds occurred (Duke and Powles Reference Duke and Powles2008; Kniss Reference Kniss2018; Vulchi et al. Reference Vulchi, Bagavathiannan and Nolte2022). Because A. palmeri seed germination is stimulated and accelerated by light, and its reproductive and genetic characteristics maintain high levels of diversity, the reduction in both tillage and herbicide SOA diversity helped to create an ideal niche for the selection of resistance to glyphosate, which led to widespread colonization of similar cropping systems in the region (Jha et al. Reference Jha, Norsworthy, Riley and Bridges2010; Price et al. Reference Price, Schomberg, Culpepper, Nichols, Balkcom and Kelton2011; Roberts and Florentine Reference Roberts and Florentine2021; Ward et al. Reference Ward, Webster and Steckel2013). Within 7 yr of HR cotton adoption in the U.S. Southeast, cases of glyphosate-resistant A. palmeri were being reported, and resistance was confirmed in 2006 in the state of Georgia (Culpepper et al. Reference Culpepper, Grey, Vencill, Kichler, Webster, Brown, York, Davis and Hanna2006).
As reports of glyphosate-resistant A. palmeri became more ubiquitous, initial management recommendations to deal with glyphosate-resistant A. palmeri entailed the use of deep inversion tillage to bury seed (Aulakh et al. Reference Aulakh, Price, Enloe, Van Santen, Wehtje and Patterson2012, Reference Aulakh, Price, Enloe, Wehtje and Patterson2013; Price et al. Reference Price, Schomberg, Culpepper, Nichols, Balkcom and Kelton2011). While effective, this ability to “reset” the weed seedbank can only be practiced infrequently, as sequential tillage events may exacerbate A. palmeri infestations (Price et al. Reference Price, Schomberg, Culpepper, Nichols, Balkcom and Kelton2011). Furthermore, tillage adds to production costs and is a major contributor to soil erosion. While the use of diverse herbicide SOAs and newer HR cotton varieties have been promoted, A. palmeri populations have subsequently been confirmed to be herbicide resistant to eight SOAs, many of which are heavily relied upon in cotton production systems (Heap Reference Heap2022). Ongoing challenges with herbicide resistance in A. palmeri necessitate a transition to weed management systems that rely on varied and additional sources of weed mortality other than herbicides (Gamble and Price Reference Gamble and Price2021; Korres et al. Reference Korres, Burgos, Travlos, Vurro, Gitsopoulos, Varanasi, Duke, Kudsk, Brabham, Rouse, Salas-Perez and Sparks2019; Parminder et al. Reference Parminder, Chahal, Aulakh, Jhala, Price, Kelton and Sarunaite2016). To delay resistance and maintain the efficacy of herbicides, reductions in population size coupled with decreased selection pressure imposed on populations must be prioritized (Menalled et al. Reference Menalled, Peterson, Smith, Curran, Páez and Maxwell2016; Neve et al. Reference Neve, Norsworthy, Smith and Zelaya2011). The challenge of doing this while maintaining the economic and soil-related benefits of conservation tillage systems is considerable, given these systems’ reliance on herbicides in place of tillage (Chauhan et al. Reference Chauhan, Singh and Mahajan2012; Nichols et al. Reference Nichols, Verhulst, Cox and Govaerts2015).
To address this, researchers and farmers throughout the U.S. Southeast have increasingly experimented with cover crops within conservation tillage–cotton production systems to manage A. palmeri (Hand et al. Reference Hand, Nichols, Webster and Culpepper2019; Palhano et al. Reference Palhano, Norsworthy and Barber2018; Price et al. Reference Price, Monks, Culpepper, Duzy, Kelton, Marshall, Steckel, Sosnoskie and Nichols2016; Webster et al. Reference Webster, Scully, Grey and Culpepper2013; Wiggins et al. Reference Wiggins, Hayes and Steckel2015a, Reference Wiggins, McClure, Hayes and Steckel2015b). Cover crops are species of annual cereals and forage legumes that were initially used as a measure to decrease erosion and nutrient leaching (Ruis et al. Reference Ruis, Blanco-Canqui, Creech, Koehler-Cole, Elmore and Francis2019). Cover crops are established yearly after cash crop harvest in the fall and terminated with herbicide, often in combination with mechanical termination, before the subsequent year’s cash crop is planted. Cover crops add a layer of residue to the soil surface and have been shown to help suppress weeds primarily by reducing the quantity of light reaching the soil surface, acting as a physical barrier, and altering the soil environment by introducing allelopathic chemicals and by changing temperature and nutrient dynamics (Teasdale Reference Teasdale and Zimdahl2018).
Less studied and used are living mulches—annual or perennial plant species that differ from cover crops in that they remain alive, growing with the cash crop for at least part of the growing season (Bhaskar et al. Reference Bhaskar, Westbrook, Bellinder and DiTommaso2021; Hartwig and Ammon Reference Hartwig and Ammon2002; Paine and Harrison Reference Paine and Harrison1993). Herbicide or mechanical termination is used to create vegetation-free strips into which a cash crop is planted, while the interrow area is occupied with living plant species (Hartwig and Ammon Reference Hartwig and Ammon2002; Mohammadi Reference Mohammadi and Price2012; Westbrook et al. Reference Westbrook, Bhaskar and DiTommaso2022). Many of the same mechanisms that suppress weeds via cover crops apply to living mulches, but perennial living mulch species create an even less hospitable environment for annual weed species, given the duration of interference that occurs between living mulch and weed (Bhaskar et al. Reference Bhaskar, Westbrook, Bellinder and DiTommaso2021; Mohammadi Reference Mohammadi and Price2012). While cover crops have been shown to be most effective at suppressing weed germination and seedling emergence, living mulch systems may alter the interrow resource environment significantly to limit the growth, development, and fecundity of weeds as well (Bhaskar et al. Reference Bhaskar, Westbrook, Bellinder and DiTommaso2021; Mohammadi Reference Mohammadi and Price2012; Teasdale Reference Teasdale and Zimdahl2018). Living mulches can also compete with the cash crop, reducing cash crop size and yield depending on drought susceptibility and growing conditions (Ziyomo et al. Reference Ziyomo, Albrecht, Baker and Bernardo2013).
Given the potential for cover crops and living mulches to contribute to the challenge of sustainably managing A. palmeri, we sought to answer the following questions: Are there relative differences in the ability of cover crops or a living mulch species to target vulnerabilities in the life history of A. palmeri? How do cover crop and living mulch species differ in their ability to regulate the abundance (plants m−2), biomass (g plant−1), and fecundity (seeds plant−1) of this weed at various life-history stages? What are the ramifications of changes to abundance and size on reproductive output and demographic processes that may affect subsequent production years?
Materials and Methods
Experimental Design and Site Information
The experimental site was established at the J. Phil Campbell Research and Education Center in Watkinsville, GA (33.8693°N, 83.4499°W) in the fall of 2019. Plots were arranged in a randomized complete block design with four replicates. Plot sizes were approximately 11 m by 16.6 m and remained in the same location from study establishment through the end of the study in fall of 2021. Treatments in this study included (1) a bare ground control (BG); (2) a leguminous annual cover crop, crimson clover (CC); (3) an annual cereal cover crop, cereal rye (CR); and (4) a leguminous perennial living mulch, white clover, which will be referred to as a “living mulch” (LM). Soils at the site were a Cecil sandy loam (fine, kaolinitic, thermic Typic Kanhapludults). The site had previously been in no-till production, with the most immediate prior crop being cotton.
Cover Crop and Fertility Management
In 2019, the entire experimental area was chisel plowed and disked on October 3. The area was cultipacked before planting on October 15. To understand the potential benefits and trade-offs among cover crop practices in a cotton-cropping system, an experiment was established in the fall of 2019 using two annual cover crop species, cereal rye (Secale cereale L. ‘Wrens Abruzzi’) and crimson clover (Trifolium incarnatum L. ‘Dixie’); a perennial living mulch species, white clover (Trifolium repens L. ‘Durana®’); and a bare ground control under no-till conditions. The study described in this paper, nested within that larger experiment, was developed to quantify differences among treatments with respect to A. palmeri population dynamics (Supplementary Figure S1). As such, this experiment was conducted so that herbicide was used solely to terminate cover crops or living mulch biomass before cash crop planting and not at any point as a source of mortality to manage A. palmeri. This may be particularly relevant, given the almost complete loss of efficacy for certain herbicide SOAs in controlling this weed. More so, this allowed us to evaluate the inherent ability of these different cover crop and living mulch species to regulate A. palmeri populations at various life-history stages. All treatment species were planted using a 2-m 606NT Great Plains no-till drill (1525 E. North Street, Salina, KS 67401), with a row spacing of 19 cm at a rate of 22 kg ha−1 (CC), 112 kg ha−1 (CR), and 22 kg ha−1 (LM) on October 18. In the establishment year (2019), the entire area was cultipacked again after planting based on best management practices information from Sanders et al. (Reference Sanders, Andrews, Saha, Vencill, Lee and Hill2017). In 2020, CC and CR were planted on November 24 in the same manner. Given that LM is a perennial, replanting was unnecessary. All treatments were managed as no-till after the initial establishment of the experiment. Soil samples were taken on October 18, 2019, to determine initial P, K, and pH levels. On November 14, 2019, fertilizer (450 kg ha−1, 0-15-30) and agricultural lime (1,000 kg ha−1) were applied to the entire experimental area to attain P and K levels of 45 and 140 ppm and a pH of 6.2. On April 9, 2020, and April 21, 2021, CC and CR plots were mechanically terminated with a 2-m-wide roller-crimper with a chevron pattern. Roller-crimping was performed when CR was in the early dough growth stage, and CC was in the flowering (full-bloom) growth stage. On April 16, 2020, soils were sampled to determine the need for additional fertilization based on the cotton yield goal of 840 kg ha−1. The entire experimental area was fertilized (400 kg ha−1 of 0-0-60) on May 6. In 2021, soils were sampled on May 17 to determine P, K, and pH levels for that season’s cotton production. Based on these results, the entire experimental area was fertilized (560 kg ha−1, 0-20-20) on June 6.
Nitrogen (N) management differed across treatments. All treatments were managed based on the cotton yield goal of 840 kg ha−1 with an associated N requirement of 67 kg ha−1. In both years, urea-ammonium nitrate (UAN) was applied at the pinhead square stage of cotton development (BBCH 51; Munger et al. Reference Munger, Bleiholder, Hack, Mess, Strauss, van den Boom and Weber1998). This occurred on July 16, 2020, and July 22, 2021. This quantity was provided by adding UAN relative to the N mineralization (credit) or uptake (debit) of the different cover crop treatments. In both years, BG plots were fertilized with 67 kg ha−1 UAN. Fertilization rates for CC and CR treatments were determined by taking four 0.25-m2 quadrat biomass samples before cover crop termination on April 8, 2020, and April 20, 2021. Sampling followed UGA guidelines for the use of the Cover Crop Nitrogen Availability Calculator, which approximates N credits and debits for different cover crop and tillage systems (Gaskin et al. Reference Gaskin, Cabrera, Kissel and Hitchcock2019). In 2020, CC and CR plots received 22 and 67 kg ha−1 UAN, respectively. In 2021, CC and CR plots received 0 and 67 kg ha−1 UAN, respectively. LM plots received no N fertilizer in either year of the study. Previous work within corn (Zea mays L.)–LM systems in Georgia indicated the potential for cotton crop N demands to be met solely through mineralization of both above- and belowground biomass of the LM through the growing season (Andrews et al. Reference Andrews, Sanders, Cabrera, Saha and Hill2018).
Herbicide Management
All postemergence herbicide applications were made to the entirety of the experimental area, excluding the area in which demographic measurements were taken. Applications were made with a three-point hitch cone sprayer or a CO2-powered backpack sprayer in rows containing demographic subplots to minimize equipment traffic. These areas were clearly marked with flags and were avoided during herbicide applications. Unless otherwise stated, all herbicide applications were either broadcast applied over BG, CC, and CR plots or applied in 25-cm bands sprayed in the crop row at a spacing of 90 cm for LM plots using a water carrier volume of 187 L ha−1. On November 26, 2019, due to high observed densities of the winter annual weeds dead nettle (Lamium purpureum L.), mouse-ear chickweed [Cerastium fontanum Baumg. ssp. vulgare (Hartm.) Greuter & Burdet; syn.: Cerastium vulgatum L.], and ivy-leaf speedwell (Veronica hederifolia L.), 2,4-DB was broadcast applied over all plots at a rate of 1.5 kg ae ha−1. No herbicide was applied in the fall of 2020. On April 14, 2020, and April 22, 2021, after CC and CR cover crops had been roller-crimped, glyphosate was applied at a rate of 2.52 kg ae ha−1. On May 13, 2020, and May 25, 2021, at 1 d before planting, paraquat was applied at a rate of 0.71 kg ai ha−1. On June 8, 2020, and June 18, 2021, glyphosate was applied postemergence at 1.26 kg ae ha−1. This was followed on July 20, 2020, and July 29, 2021, with a layby (postemergence-directed) application of glyphosate plus carfentrazone applied at a rate of 1.26 kg ai ha−1 + 7 g ai ha−1.
Cotton Management
On May 14, 2020, and May 26, 2021, the cotton cultivar ‘DG 3615 B3XF’ was planted at a rate of 87,500 plants ha−1 with a row spacing of 90 cm. All treatments were planted with a John Deere 7300 MaxEmerge2 (Deere & Company, One John Deere Place, Moline, IL 61265) with row cleaners. Plot size allowed for 12 rows of cotton within each treatment plot. All plots were provided with supplemental irrigation, when necessary, to meet weekly irrigation totals recommended by UGA Extension guidelines (Whitaker et al. Reference Whitaker, Culpepper, Freeman, Harris, Kemerait, Perry, Porter, Roberts, Shurley and Smith2018). Mepiquat chloride (N,N-dimethylpiperidinium), a commonly used growth regulator, was applied in season based on UGA Extension guidelines (Whitaker et al. Reference Whitaker, Culpepper, Freeman, Harris, Kemerait, Perry, Porter, Roberts, Shurley and Smith2018). In 2020, BG, CC, and CR plots received 37, 25, and 50 g ai ha−1 mepiquat chloride on July 27 and August 12 and 27, respectively. In 2020, LM plots received no growth regulator. In 2021, BG, CC, and CR plots received 37 g ai ha−1 mepiquat chloride on July 28. No growth regulator was applied to the LM plots on this date. On August 23, all treatment plots received 50 g ai ha−1 mepiquat chloride. On October 26, 2020, and October 22, 2021, a harvest aid was applied to all plots based on UGA Extension guidelines (0.84, 2.1, 26 + 13 g ai ha−1 of tribuphos [S,S,S-tributyl phosphorotrithioate], ethephon [(2-chloroethyl)-phosphonic acid], thidiazuron [N-phenyl-N′-1,2,3-thiadiazol-5-ylurea] + diuron [3-(3,4-dichlorophenyl)-1,1-dimethylurea], respectively).
Weed Demographic Measurements and Modeling
After cover crops were planted in the fall of 2019, A. palmeri was seeded in 3 m by 3 m subplots, within each plot, at a density of approximately 25,000 seeds m−2 based on a 1,000-seed weight of 0.34 g. Our experimental site was selected due to a complete lack of background population of the weed of interest. This allowed us to introduce and accurately assess the population dynamics of an artificially generated population of A. palmeri. To generate an initial population, A. palmeri seed was harvested from a local population of mature plants at the Iron Horse Research Farm in Watkinsville, GA (33.72675 N, 83.30167 W) in early October 2019. Following a procedure adapted from Bertucci et al. (Reference Bertucci, Bartley, Jennings, Monks and Jackson2020), mature female plants were stripped of terminal and axillary flowers. This material was air-dried at an ambient temperature of approximately 21 C for approximately 2 wk on greenhouse benches. The seeds and chaff were hand and machine threshed, using a combination of repurposed textured rubber mats and a Humboldt soil grinder (Humboldt Manufacturing, 875 Tollgate Road, Elgin, IL 60123). Material was sieved between hand and machine threshing to remove large pieces of chaff. After threshing, the remaining material was cleaned using a compact Oregon seed blower (Hoffman Manufacturing, 2397 NW Kings Boulevard, Corvallis, OR 97330). An initial germination assay was performed on the harvested seed by taking ten 1,000-seed lots from the cleaned seed and placing those within petri dishes between moist filter paper at ambient room temperature (25 C). Germination was monitored approximately every 3 d, and the filter paper was rewetted until a week passed without germination. Based on this, germinability was determined to be approximately 95%.
In the first year of the study, subplots were established with a 0.6-m-wide drop seeder on October 23, 2019, using a mixture of sand and weed seed to ensure uniform distribution of the weed seed within the established subplot. The germinable seedbank, the fraction of surviving nondormant seeds from which seedlings may emerge over the course of the season, was determined by taking twenty 2.5-cm-diameter soil cores to a depth of 5 cm in each subplot of the experiment on May 25, 2020, and May 27, 2021. Soil cores were manually broken apart and spread over 5 cm of sterile media within a 25 cm by 50 cm plastic tray at 1 d after collection. Flats were kept in a greenhouse and watered daily. Amaranthus palmeri seedlings were counted on a weekly basis over a 12-wk period. The sum of all seedling counts was used to determine the size of the germinable seedbank (seeds m−2) for each experimental unit.
In-field seedling recruitment was monitored within a 2 m by 2 m area within each subplot across all 16 plots. Seedling counts were initiated approximately 1 wk after planting (WAP) and were conducted approximately every 2 wk until 9 WAP for a total of five measurement time points. This was initiated on May 21, 2020, and June 3, 2021. Work has shown that upward of 85% of A. palmeri seedlings emerge from mid-May through early August, suggesting that monitoring seedling emergence over this extended period should provide a reliable estimate of the total seedling population (Jha et al. Reference Jha, Norsworthy, Riley and Bridges2010). Seedling counts were made using colored toothpicks placed at the base of each counted plant to quantify emerged seedlings. These toothpicks were used to mark previously emerged plants from subsequent emergence cohorts and allow for tracking of cohorts. A 1-m2 gridded quadrat, divided into one hundred 10 cm by 10 cm cells using colored cable was used to help guide seedling counts for measurements at 1, 3, and 5 WAP for all treatments. At 7 and 9 WAP seedling measurements, where larger, earlier-emerged seedlings had grown large enough to prevent the use of the gridded quadrat, any emerged seedlings not already marked by toothpicks were counted.
Adult plants were harvested over a weeklong period, on a per-rep basis, beginning on October 5, 2020, and October 12, 2021. Adult plants were carefully removed from each subplot using handheld serrated sickles and counted. Adult plants were placed into 113-L yard waste bags and air-dried for approximately 2 wk at ambient temperature (25 C). Plants were removed from the bags, and female plants were then threshed using the same process as that described earlier, with the exception being that plants were processed by replicate and treatment (n = 16). Distinct seed lots were established in this way. A small subsample (1 g) was removed from each seed lot and counted to determine 1,000-seed mass. This was used to determine fecundity for each subplot. Amaranthus palmeri seed from each experimental unit was returned to the respective demographic subplots by hand broadcasting them on December 9, 2020, for 2021 measurements.
The data described above were used to quantify A. palmeri at various life-history stages and calculate the effect of our experimental treatments on life-history transitions from the seedbank to seedling (recruitment, r) and seedling to adult plant (survival, s), as well as the reproductive capacity of adult female plants, (fecundity, f). These demographic parameters can be plainly described as the number of seedlings per seed (recruitment), plants per seedling (survival), and seeds per plant (fecundity) (Figure 1). Following the approach taken by Heggenstaller and Liebman (Reference Heggenstaller and Liebman2006), who adapted a single-cohort model from Cousens and Mortimer (Reference Cousens and Mortimer1995), our goal was to quantify differences in weed population dynamics under different cover crop treatments by using a simple model that “relates weed population density at the end of the growing season to weed population density at the beginning of the season as a function of rates of cumulative seedling recruitment (r), seedling survival (s), plant fecundity (f)” (Heggenstaller and Liebman Reference Heggenstaller and Liebman2006). This is expressed as:
 $${N_{{\rm{EOS}}}} = {N_{{\rm{BOS}}}} - {N_{{\rm{BOS}}}}\left( r \right) + {N_{{\rm{BOS}}}}\left( {r \times s \times f} \right)$$
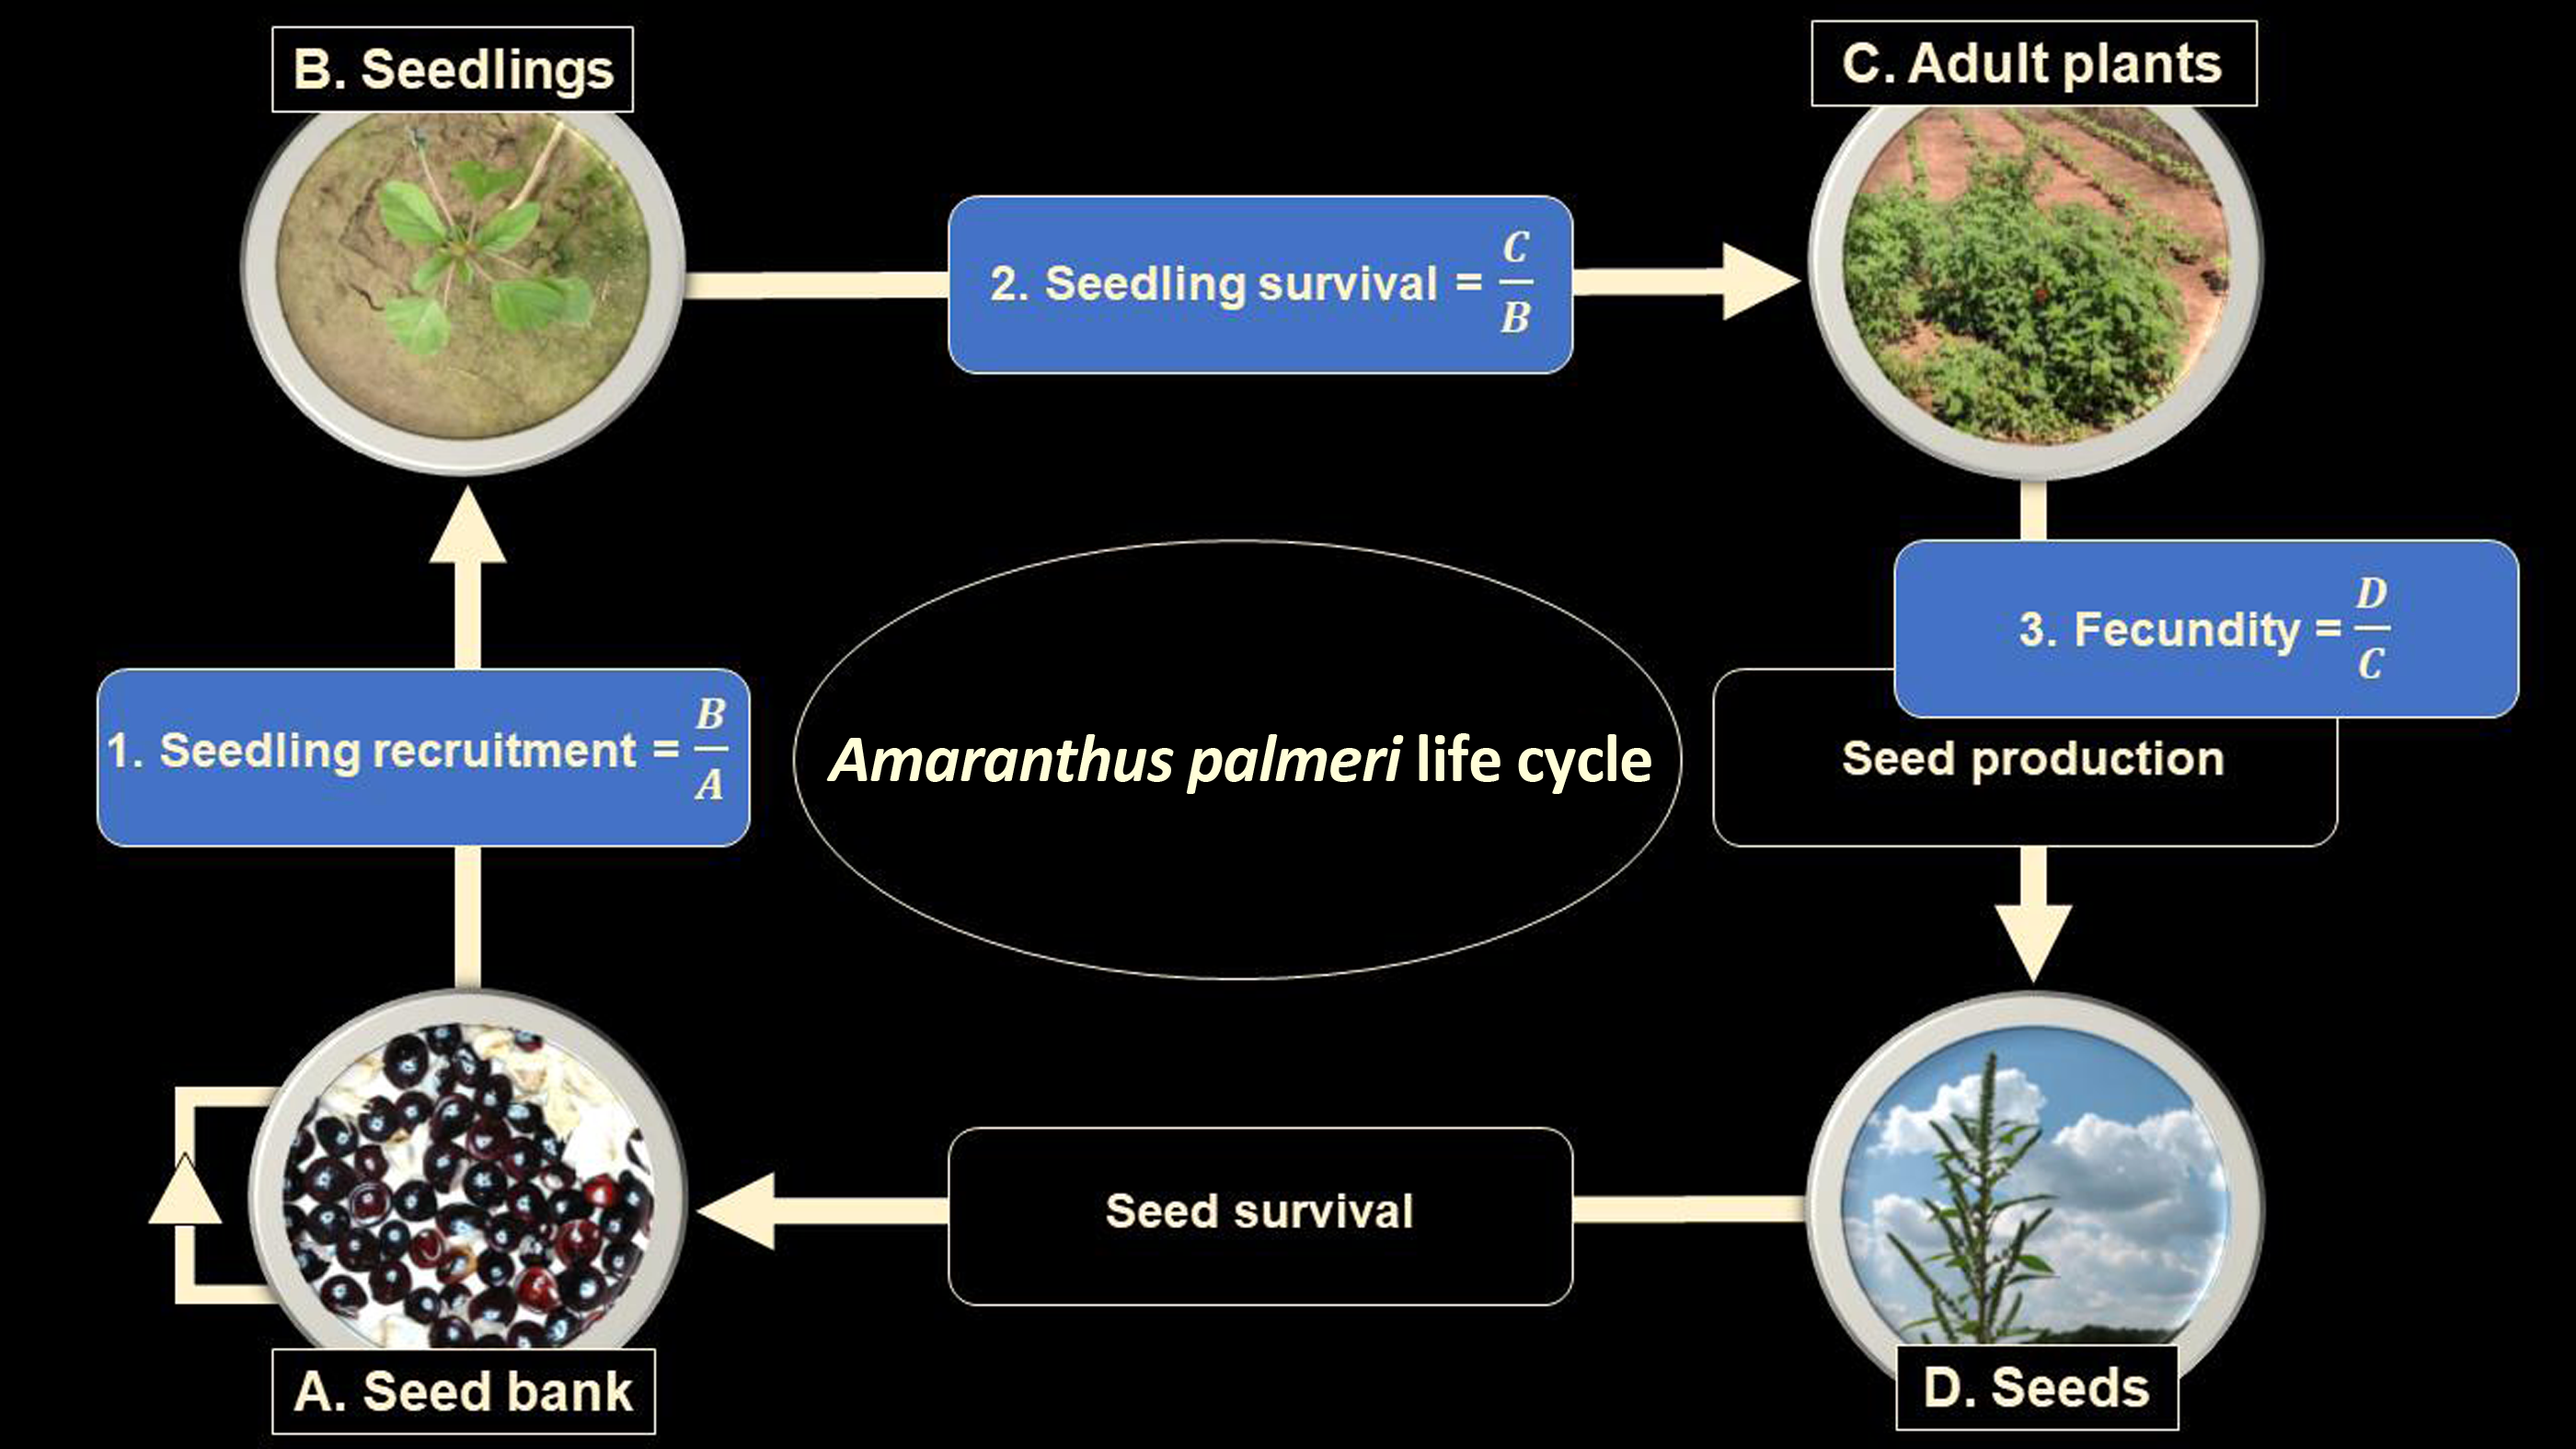
Figure 1. Visual model of Amaranthus palmeri life cycle. Measurements (A–D) were used to calculate life-history parameters (blue rectangles, 1–3) and a Δ value (not shown; see Equation 2).
Dividing this entire equation by the number of individuals at the beginning of the season (N BOS) provides an estimate of the annual change in population size from the beginning to the end of the season. The resulting quotient can be understood as the number of new seeds added to the population at the end of the season relative to each seed added to the population at the beginning of the season (N EOS/N BOS). This annual rate of population change (Δ) is expressed as:
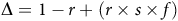 $$\Delta = 1-r + \left( {r \times s \times f} \right)$$
This simple model has its limitations. As mentioned in Heggenstaller and Liebman (Reference Heggenstaller and Liebman2006), Δ does not account for seed losses due to microbial decay, reduced germinability due to aging, and granivory from both vertebrate and invertebrate sources, all of which can contribute to seed losses. Additionally, A. palmeri is a dioecious species, producing separate male and female plants (Ward et al. Reference Ward, Webster and Steckel2013). Fecundity rates in this study were calculated from seeds produced on adult female plants. While sex ratios (female:male) and synchrony around anthesis can certainly impact fecundity, and therefore demographic trajectories, recent work suggests that under non–water limiting conditions, such as those in which this study was conducted, sex ratios in populations of A. palmeri do not significantly differ from 1:1 (Reinhardt Piskackova et al. Reference Reinhardt Piskackova, Reberg-Horton, Richardson, Jennings, Franca, Young and Leon2021). Quantifying this response was not one of the goals of this work and has no bearing on the calculations of the annual rate of weed population change used in this study.
Measurement of Explanatory Variables (Cover Crop Biomass, Light Transmission, and Soil Moisture)
As mentioned earlier, previous work suggests that cover crops may suppress weeds by creating a physical barrier (impeding emergence), altering the quantity of light reaching the soil surface (reducing requirements for germination), and changing soil temperatures (reducing soil temperature below that required for germination) (Teasdale Reference Teasdale and Zimdahl2018). To account for the effects of these variables, we measured aboveground biomass of each treatment at planting (Table 1), as well as light transmission (Figure 2) and soil temperature over the course of the growing season. Aboveground treatment biomass for all treatments was assessed on May 15, 2020, and May 26, 2021, by removing four 0.25-m2 quadrat samples along a transect within each plot. These were dried at 85 C for 3 d and weighed. For both light transmission and soil temperature measurements, four measurements (two intrarow and two interrow) were made in an area directly adjacent to our weedy subplot area over five time points within each season. Sampling occurred adjacent to weedy subplots to avoid the confounding effect of the weed canopy over the course of the season. To estimate light transmission to the soil surface for each treatment seasonally, a ceptometer (ACCUPAR LP-80, Meter group, 2365 NE Hopkins Court, Pullman, WA 99163) was used every 2 wk starting 1 wk after cotton planting (WAP) and ending 9 WAP. These began on May 21, 2020, and June 3, 2021. Measurements were made between 10 AM and 2 PM by taking an ambient reading and then by either placing the ceptometer at soil level or sliding it under the cover crop or living mulch residue. Soil temperature measurements were initiated at the same time and followed the same temporal pattern. A soil-moisture meter (TDR FieldScout 350, Spectrum Technologies, 3600 Thayer Court, Aurora, IL 60504) was fit with 5-cm probes and used to record soil temperature at that depth. Ambient air temperature data were extracted as growing degree days (GDDs) via the UGA weather network (www.georgiaweather.net) from the nearest weather station (approximately 100 m distance from the study). GDDs were calculated using a base temperature of 10 C, which has been established as the lower threshold for growth for A. palmeri (Jha et al. Reference Jha, Norsworthy, Riley and Bridges2010; Table 2).
Table 1. Amaranthus palmeri biomass for bare ground (BG), crimson clover (CC), cereal rye (CR), and living mulch (LM) treatments in 2020 and 2021 at cover crop termination. a
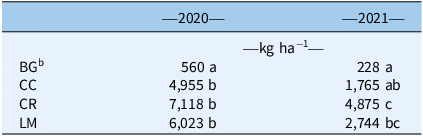
a Mean values within a column followed by the same letter are not significantly different; Tukey’s honestly significant difference (HSD; α = 0.05).
b BG biomass was native winter weeds where no cover crop was established.
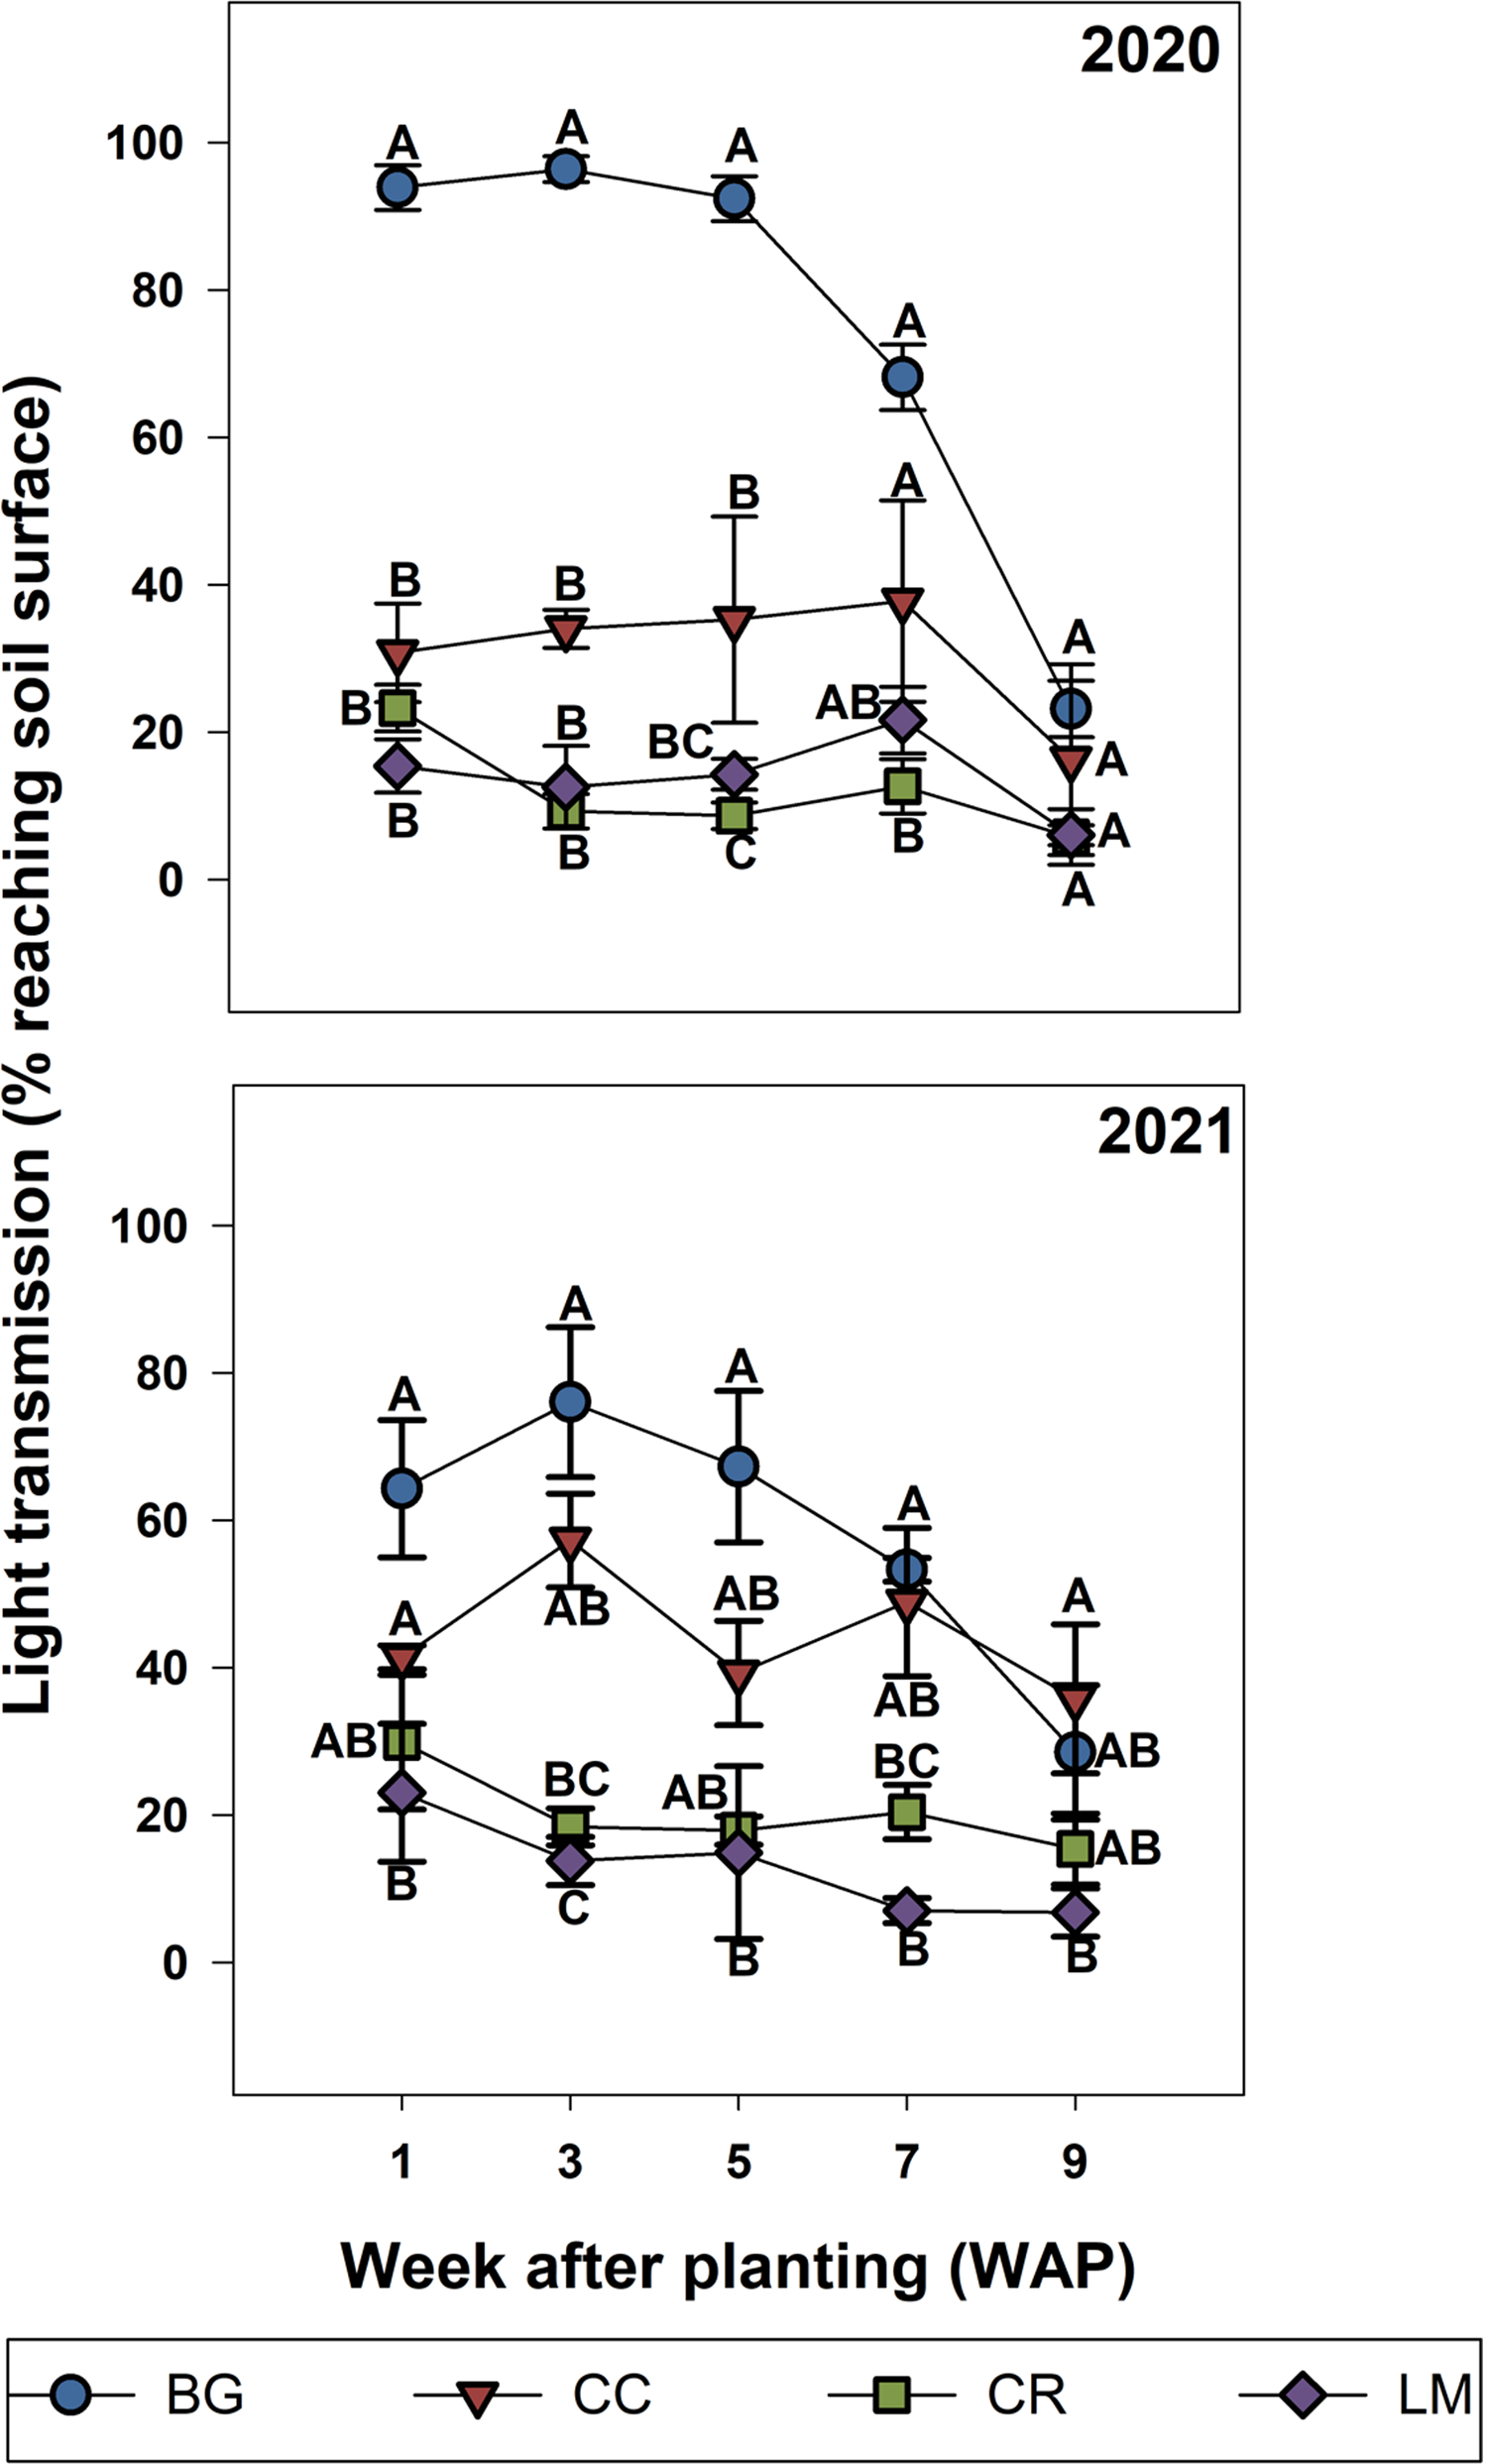
Figure 2. Light transmission (% reaching soil surface) for bare ground (BG), crimson clover (CC), cereal rye (CR), and living mulch (LM) treatments in 2020 and 2021. Relative transmission percentages were calculated based on Equation 3 and are detailed in the “Materials and Methods.” Standard error bars were calculated for the mean for each treatment, at each week after planting (WAP). Means with the same letter are not significantly different; Tukey’s honestly significant difference (HSD; α = 0.05).
Table 2. Accumulated monthly growing degree days (base 10 C) from May to October in Watkinsville, GA, USA, for 2020 and 2021 growing seasons.
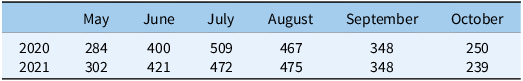
Source : UGA weather network (www.georgiaweather.net).
Statistical Analyses
All analyses were conducted using JMP 16 Pro (JMP v. 16, 100 SAS Campus Drive, SAS Institute, Cary, NC 27513). Aboveground treatment (cover crops and BG) biomass data were expressed on a kilogram per hectare (kg ha−1) basis (Table 1). All demographic parameters (recruitment, survival, and fecundity) were expressed as rates calculated from measurements of seedbank, seedling, and adult plant densities, as well as seed production per adult female plant. Adult plant density and weed biomass data were analyzed on square meter (m−2) and per plant (plant−1) bases. Data relative to the variables mentioned above were either log e or square-root transformed to meet the assumptions of normality. ANOVA was performed, considering year and treatment as fixed factors and replicate as a random factor using the standard least-squares procedure. Preliminary analyses indicated significant year-by-treatment interactions for most variables. Consequently, all analyses were conducted separately for each year. Treatment means are reported as least-square means and were separated using Tukey’s honestly significant difference (HSD) (α = 0.05).
Light transmission data were analyzed as the percentage of light reaching the soil surface under the cover crop by using the following equation:
 $${{\rm{Light}}\,{\rm{transmission}}\,{\rm{to}}\,{\rm{soil}}\,{\rm{surface}} = \left[ {1 - \left( {{{{{light\;at\;soil\;surface}}} \over {{{ambient\;light}}}}} \right)} \right] \times 100}$$
Light transmission and soil temperature data were both subjected to repeated-measures analysis in each year using a mixed model with means analyzed using Tukey’s HSD. The model included fixed terms for treatment, sampling location (interrow or intrarow), WAP, interactions therein, and a random term for replicate. A priori determined comparisons of treatment variables at each measurement timing (WAP) within each year were analyzed by sampling location.
Due to considerable variance, in-season (as opposed to cumulative) seedling recruitment data were transformed by dividing the quantity of emerged seedlings at a given time point over the sum of emerged seedlings over the entire season (percent in-season seedling recruitment). Within each year, the relationship between the percent in-season recruitment and WAP for each treatment was fit to a three-parameter logistic model,
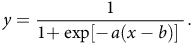 $$y = \!\!{\rm{\;}}{1 \over {1 \!+ \!\!{\rm{\;exp[}} \!- \!a(x - b){\rm{]\;}}}}.$$
where y is percent in-season seedling recruitment, a is growth rate, b is the inflection point (representing 50% of cumulative recruitment), and x is WAP (Ritz et al. Reference Ritz, Kniss and Streibig2015). An R2 nonlinear value was estimated for each curve based on the following calculation (Ritz et al. Reference Ritz, Kniss and Streibig2015):
 $${{\rm R}_{{\rm{nonlinear}}}^2 = 1-\left( {{\rm{residual \ sum \ of \ squares/corrected \ total \ sum \ of \ squares}}} \right)}$$
Mean and standard error values for the WAP (x) at which 50% recruitment (b) occurred were generated using the custom inverse prediction function, and the former were separated using Tukey’s HSD.
Results and Discussion
Aboveground Biomass, Light Transmission, and Soil Temperature
In 2020, aboveground biomass for all cover crop treatments was greater than the winter weed biomass from the BG treatment (Table 1). The mean value for aboveground biomass across all three cover crop treatments was 6,032 kg ha−1, while that of BG, which comprised the winter annual weeds mentioned earlier, was 560 kg ha−1. Greater biomass for all treatments in our first year was likely the result of an earlier planting date in the fall of 2019 relative to that of 2020 (October 15 vs. November 24). This earlier planting was informed by best management practices in Sanders et al. (Reference Sanders, Andrews, Saha, Vencill, Lee and Hill2017), whose work on LM system optimization using corn (Zea mays L.) as a cash crop highlighted the importance of an early planting to ensure proper stand establishment of the white clover cultivar (Durana®) being used. However, cotton maturity and harvest times do not allow for planting as early as is optimal for the region, whereas this is an option following early-harvested crops such as corn or soybean [Glycine max (L.) Merr.]. Given this, in 2020 aboveground biomass for our annual cover crop species (CC and CR) was closer to values in Webster et al. (Reference Webster, Scully, Grey and Culpepper2013), who measured multiple annual cover crop species at a lower latitude than our site, where milder winter temperatures and a faster accumulation of GDDs in the early spring allow for the production of considerable biomass. In 2021, CC and CR biomass production was similar to that reported in studies conducted within a lower latitude range (Palhano et al. Reference Palhano, Norsworthy and Barber2018; Price et al. Reference Price, Monks, Culpepper, Duzy, Kelton, Marshall, Steckel, Sosnoskie and Nichols2016). LM biomass was greater than that reported in studies conducted at the same site in previous years. This was true for the establishment year and first full year of growth and may be a result of greater initial seeding rates used in our study (Andrews et al. Reference Andrews, Sanders, Cabrera, Saha and Hill2018; Sanders et al. Reference Sanders, Andrews, Saha, Vencill, Lee and Hill2017).
In both years of the study, treatment by sampling time interactions for cotton interrow measurements of light transmission to the soil surface were significant. In both years, the quantity of light reaching the soil surface was greatest for the BG treatment, less for CC, and even less for CR and LM, which were almost identical to each other, over 9 wk of measurements after cotton planting (Figure 2). In 2020, this trend remained constant until 9 WAP, when light transmission to the soil surface was the same across all treatments, coinciding with canopy closure of the cotton crop (Figure 2). In 2021, light transmission to the soil surface for BG and CC treatments was equivalent up to until 7 WAP, but greater than CR and LM. In 2021, 9 WAP light transmission to the soil surface was the same across all treatments because of cotton canopy closure (Figure 2). These results are a direct reflection of the quantity (biomass) and quality (residue persistence) of aboveground biomass for each treatment. Analysis of intrarow data for 2020 indicated a treatment by sampling time interaction; however, means separations revealed differences in light transmission to the soil surface only at a singular time point (7 WAP), where BG and LM were greater compared with CC and CR (data not presented). At all other time points, light transmission to the soil surface was the same across treatments, and gradually decreased over the course of the 9 wk. For 2021, data analysis similarly indicated that light transmission to the soil surface decreased over the season (effect of time, WAP), but did not differ across treatments.
Aboveground biomass in the BG treatment consisted of several winter annual weed species that produced limited biomass and degraded rapidly due to a combination of senescence and the effects of burndown herbicide applications. This had a limited to zero effect on reducing light transmission to the soil surface. Given that underlying pedological, meteorological, and management (e.g., irrigation) conditions were relatively uniform across all treatments, differences in light transmission among the treatments may be explained by factors such as aboveground biomass, residue persistence, and plant life cycle for each cover crop (Thapa et al. Reference Thapa, Tully, Reberg-Horton, Cabrera, Davis, Fleisher, Gaskin, Hitchcock, Poncet, Schomberg, Seehaver, Timlin and Mirsky2022). This may explain measurements of greater seasonal light transmission to the soil surface in CC relative to CR treatments under the cover crop. Specifically, while aboveground biomass for these two species was equivalent in 2020, light transmission to the soil surface was greater in CC treatments. We posit that this is a result of having a lower relative C:N ratio and hence a faster rate of decomposition. Accordingly, low levels of light transmission in the CR treatment were associated with greater mean biomass, a residue having a greater relative C:N ratio, and a documented slower rate of decomposition over the course of the growing season (Thapa et al. Reference Thapa, Tully, Reberg-Horton, Cabrera, Davis, Fleisher, Gaskin, Hitchcock, Poncet, Schomberg, Seehaver, Timlin and Mirsky2022). According to Andrews et al. (Reference Andrews, Sanders, Cabrera, Saha and Hill2018), plant available nitrogen for CC and LM treatments was similar in the first 90 d after crop planting. This suggests that decomposition rates for these two species may be similar and that low transmission in the interrow of the LM treatment arose due to its perenniality rather than residue quality.
Intrarow light transmission was almost identical across treatments in both years, suggesting that the effects of management generated similar light environments under the cotton row over all treatments. As mentioned, the planter we used had row-cleaning units, a feature that moves residues away from the crop row to facilitate earlier crop emergence. Functionally, this may have duplicated the lack of residue in the BG treatment and the reduced quantity of residue present in the intrarow of LM (due to banded herbicide application) across all treatments (Supplementary Figure S2).
Cumulative GDD10 from May through October are presented in Table 2. These data were relatively uniform, by month, across both years of the study, peaking in July and August and decreasing after that time period until October. We did not find significant treatment by sampling time interactions in either year of the study for soil temperature (data not presented). Soil temperatures increased over the 9 wk of measurements in all treatments, following the trend described above. This was true under both inter- and intrarow areas. While optimal measurement of this parameter would have entailed the use of an in situ sensor, our measurement methodology and findings are similar to those of a cotton–cover crop study conducted in North Carolina, where the presence of a CR/CC mixture did not alter soil temperature relative to a BG treatment (Vann et al. Reference Vann, Reberg-Horton, Edmisten and York2018).
Seedling Recruitment
Seedling measurements were used to quantify both cumulative (% emerged at the end of the season) and in-season (50% emerged) recruitment rates. In 2020, cumulative recruitment rates differed between BG and all other treatments (Table 3). The untransformed cumulative recruitment rate for the BG treatment was approximately one order of magnitude greater than the rate averaged over the three treatments (0.192 vs. 0.022 seedlings seed−1). This amounts to a difference of 568 versus 66 seedlings m−2 for BG versus the mean of all other treatments (data not shown). In-season recruitment rates did not differ statistically across treatments in this first year of the study; on average, all treatments and the control reached 50% recruitment by approximately 3.8 WAP (Figure 3; Table 4).
Table 3. Rates of Amaranthus palmeri seedling recruitment, survival, fecundity, population change (Δ), and biomass for bare ground (BG), crimson clover (CC), cereal rye (CR), and living mulch (LM) treatments in 2020 and 2021. a
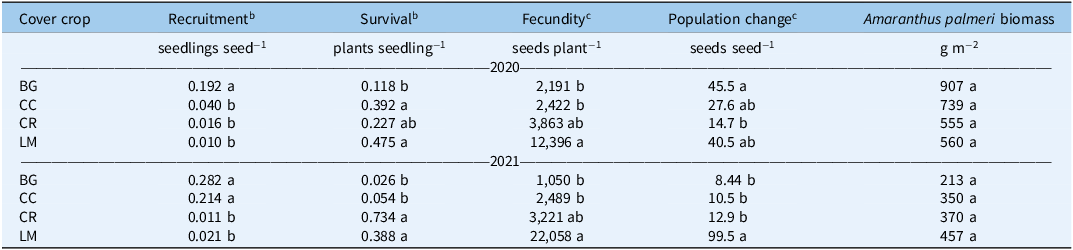
a Untransformed means are presented. Mean values within a column followed by the same letter are not significantly different; Tukey’s honestly significant difference (HSD; α = 0.05).
b Reported means separations are for square-root-transformed data using Tukey’s HSD (α = 0.05). Numerical data presented are non-transformed.
c Reported means separations are for log e -transformed data using Tukey’s HSD (α = 0.05). Numerical data presented are non-transformed.
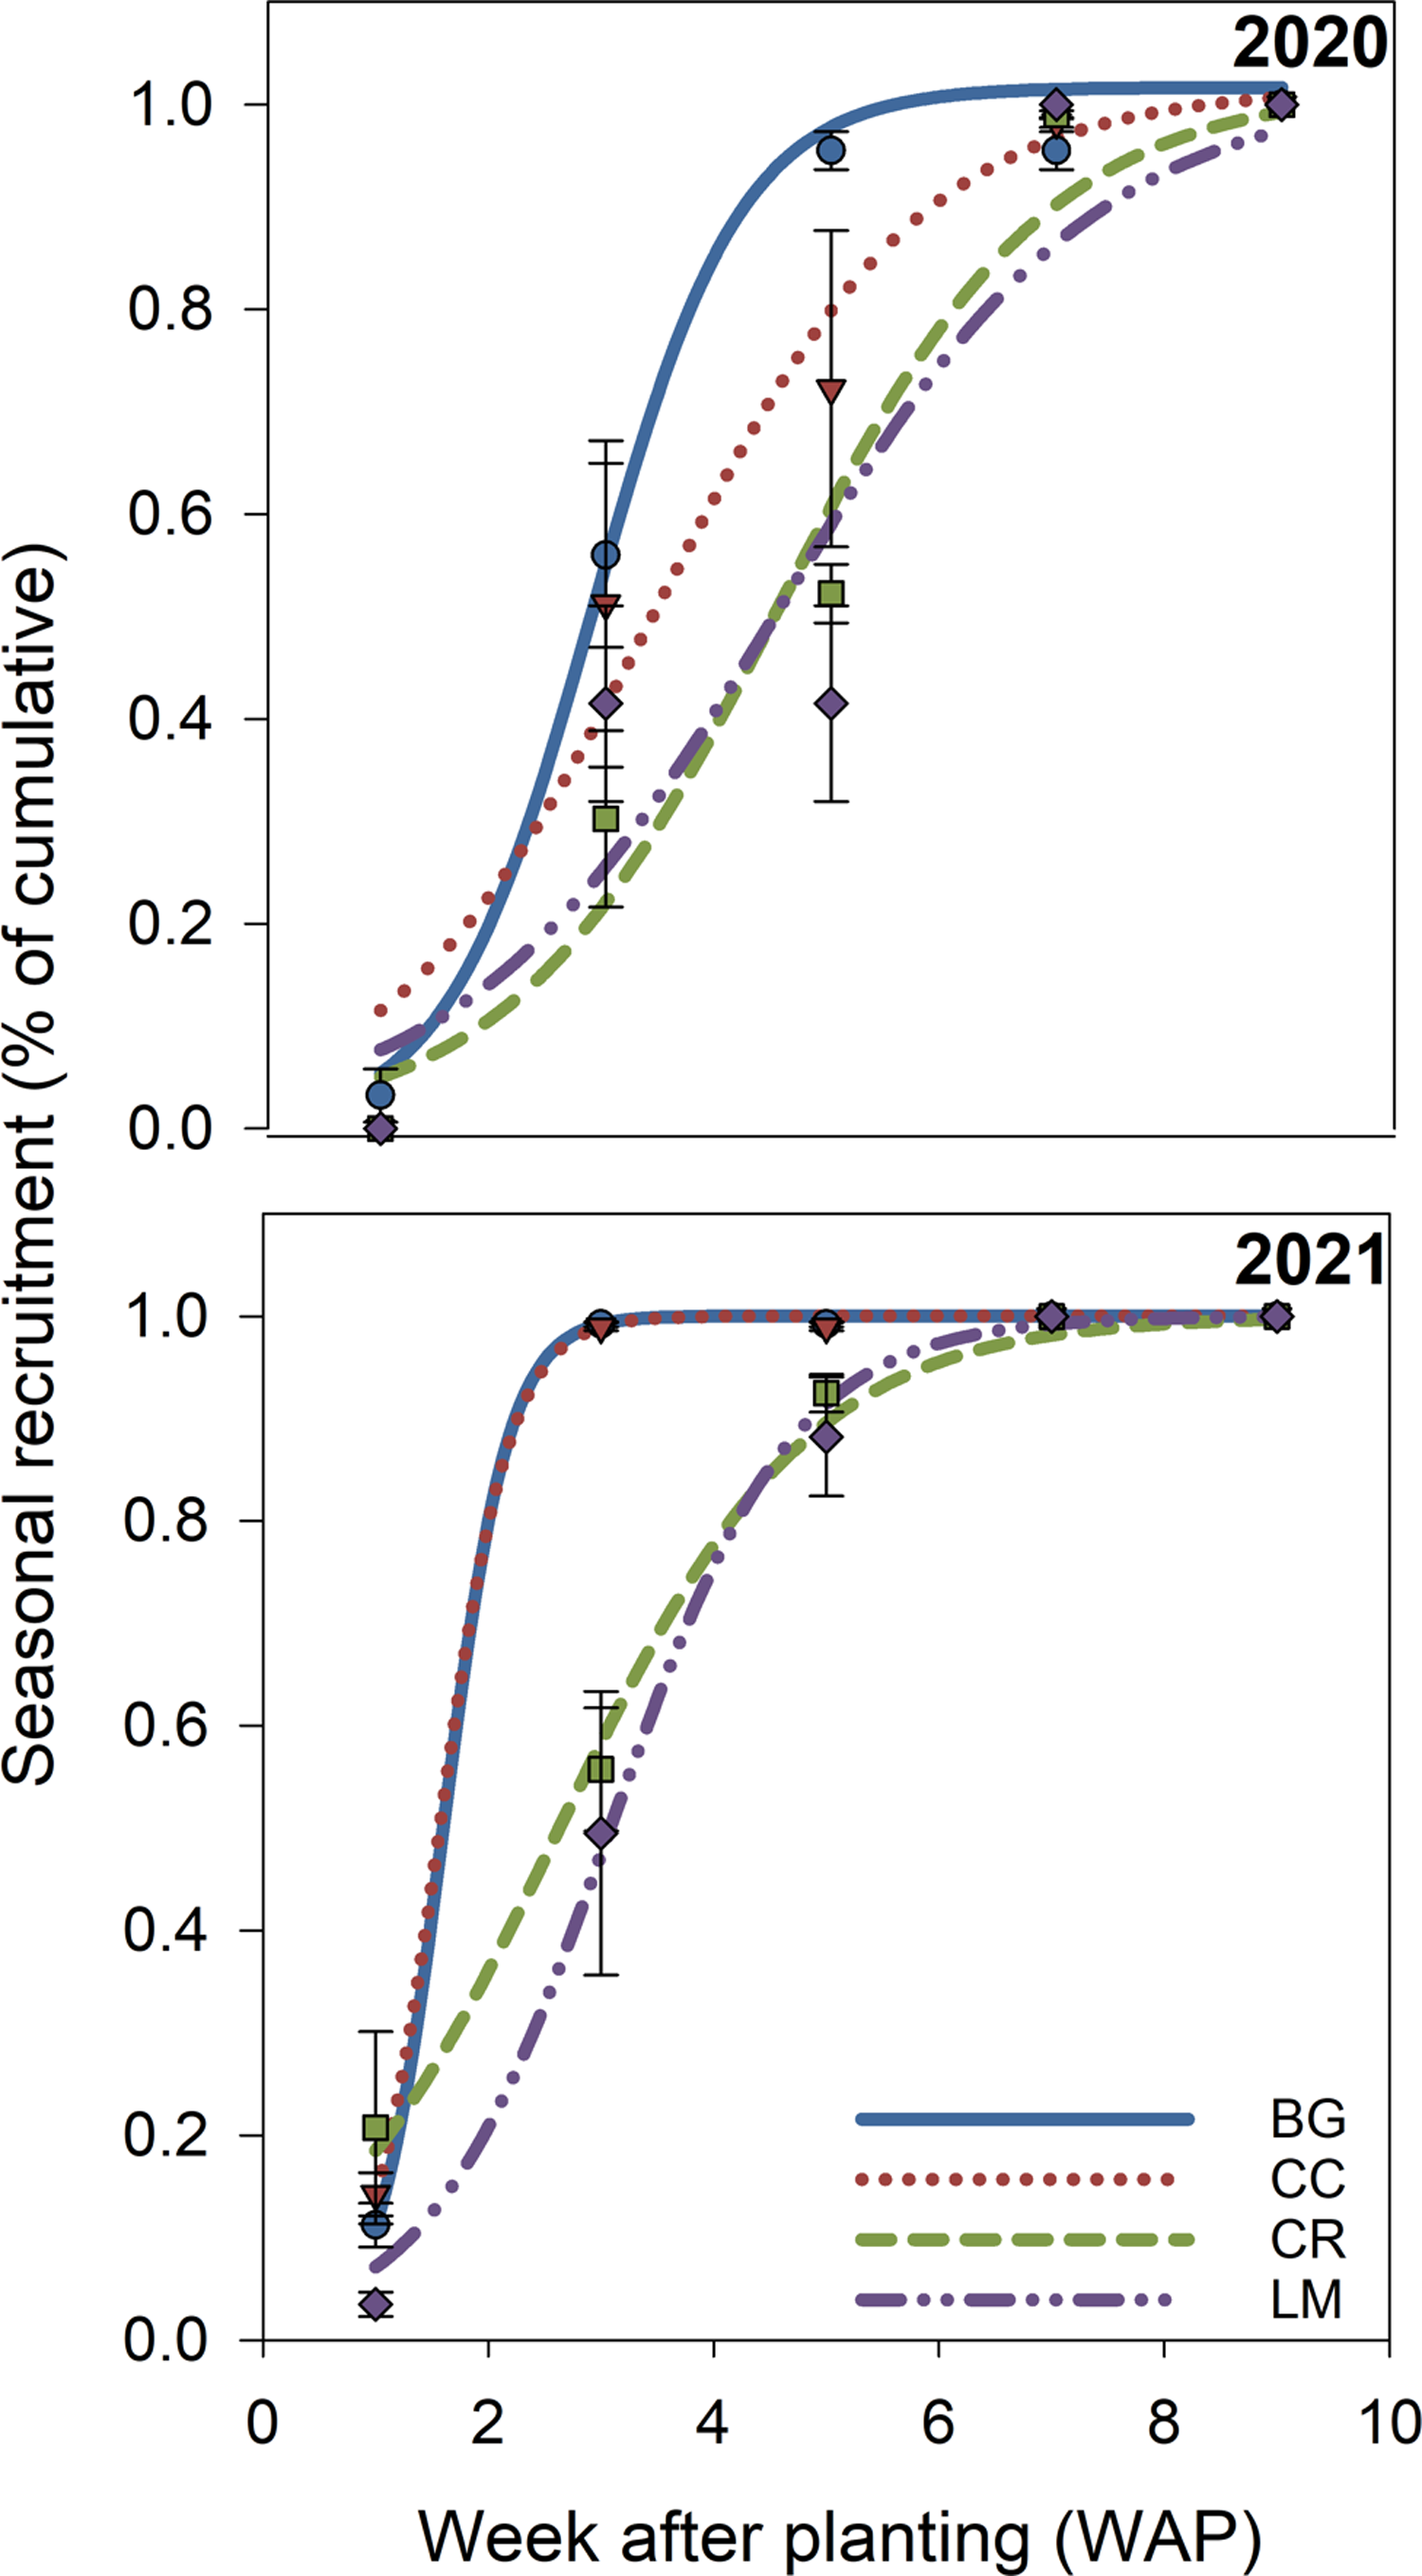
Figure 3. Modeled in-season recruitment rates (%) for bare ground (BG), crimson clover (CC), cereal rye (CR), and living mulch (LM) treatments in 2020 and 2021 over time (week after planting [WAP]). Model parameters for each treatment, in each year, are based on Equation 4 and are presented in Table 4. Points represent mean values at each measurement time and are presented with standard error bars.
Table 4. Inflection point (weeks after planting at which 50% recruitment occurs) mean and standard error (in parentheses) and R2nonlinear for bare ground (BG), crimson clover (CC), cereal rye (CR), and living mulch (LM) treatments in 2020 and 2021.a
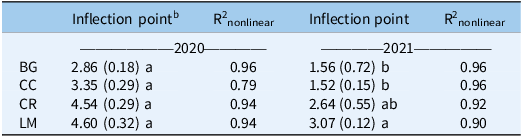
a Mean values within a column followed by the same letter are not significantly different; Tukey’s honestly significant difference (HSD; α = 0.05).
b Calculated based on Equation 5: R2 nonlinear = 1 – (residual sum of squares/corrected total sum of squares).
In 2021, cumulative recruitment rates were different between BG/CC treatments, and CR/LM treatments (Table 3). Untransformed differences, averaged over each mean separation grouping (BG/CC vs. CR/LM), were 0.248 and 0.016, representing an even greater magnitude of difference between cumulative recruitment rates as a function of treatment. This translates to a difference in cumulative emerged seedlings of 920 versus 26 seedlings m−2 between treatment groupings (data not shown). In-season recruitment rates only differed between BG/CC versus LM, where 50% emergence was delayed by approximately 1.5 wk for the latter; CR was not different from either BG/CC or LM (Figure 3; Table 4).
Light and temperature are important requisites for the germination and emergence of A. palmeri (Reinhardt Piskackova et al. Reference Reinhardt Piskackova, Reberg-Horton, Richardson, Jennings, Franca, Young and Leon2021; Ward et al. Reference Ward, Webster and Steckel2013). Differences in both cumulative and in-season seedling recruitment rates among treatments and between years were strongly related to these factors, and to the degree that these were attenuated by both the quantity and persistence of biomass. In 2020, cumulative recruitment rates were lower in all treatments relative to the control (Table 1). This occurred as a function of the quantity of biomass produced relative to the BG treatment and lower relative light transmission, variables that are inherently coupled (Tables 1 and 3). All treatments met a minimum biomass threshold to maintain sufficiently low light levels, and subsequently cumulative recruitment rates, at an equivalent level. With respect to annual cover crops, biomass quantity, regardless of species, has been shown to be a key factor in weed suppression, which supports the findings from our first year (Aulakh et al. Reference Aulakh, Price, Enloe, Van Santen, Wehtje and Patterson2012; MacLaren et al. Reference MacLaren, Swanepoel, Bennett, Wright and Dehnen-Schmutz2019; Nichols et al. Reference Nichols, Martinez-Feria, Weisberger, Carlson, Basso and Basche2020; Osipitan et al. Reference Osipitan, Dille, Assefa and Knezevic2018, Reference Osipitan, Dille, Assefa, Radicetti, Ayeni and Knezevic2019).
In the first year of our study, biomass values across all three treatments (CC, CR, and LM) were not different, which may have masked variability in residue quality/persistence. In the second year of our study, a later cover crop planting date (November 24 vs. October 15) resulted in significantly less CC growth (Table 1). Interrow light levels under CC were greater this year of the study, relative to both 2020 and to CR and LM treatments, suggesting that the quantity of aboveground biomass for CC in 2021 (1,765 kg ha−1) appears to have been below a threshold to have a suppressive effect on cumulative seedling recruitment compared with the BG control (Figure 2; Table 3). Conversely, in both years of the study, the reduced cumulative recruitment rates for CR and LM may be explained by consistently low interrow light levels sustained either through the presence of a terminated cover crop residue with adequate biomass and a slower decomposition rate (CR) or with living plant biomass that maintains high surface-area coverage through the growing season (LM) (Bhaskar et al. Reference Bhaskar, Westbrook, Bellinder and DiTommaso2021; Ruis et al. Reference Ruis, Blanco-Canqui, Creech, Koehler-Cole, Elmore and Francis2019).
In the second year of our study, the in-season recruitment rate was different only in the LM treatment (Figure 3; Table 4). Fifty percent recruitment was delayed by approximately 1.5 wk relative to BG, CC, and CR (Figure 3; Table 4). Light transmission did not differ between CR and LM (Figure 2), and soil temperature measurements did not differ among treatments in either year, which suggests that neither was a factor in explaining this delayed in-season recruitment pattern in LM. As such, we are unsure of the mechanism behind this pattern. It is possible that LM alters germination processes via changes to light quality, as opposed to quantity, or through allelochemical exudates, both of which we did not measure, but could affect seedling germination and emergence. While both phenomena have been summarized in review articles (Bhaskar et al. Reference Bhaskar, Westbrook, Bellinder and DiTommaso2021; Mohammadi Reference Mohammadi and Price2012), given the positive implications of our findings, further research is warranted.
Finally, differences in both cumulative and in-season recruitment rates were also moderated by cotton planting dates and thus measurement timing. While accumulated GDDs did not vary much between years and by month (Table 2), our measurements of emerged seedlings in 2020 began on May 21, while in 2021 they began on June 2. This difference amounts to an additional 50 GDDs that weed seedlings and seeds had experienced at the time of our 1 WAP measurement in 2021.
Seedling Survival
In 2020, untransformed seedling survival rates were lowest for BG (0.118), more for CR (0.227), and even more for CC (0.392) and LM (0.475) (Table 3). In 2021, these rates were lowest for BG (0.026) and CC (0.054) and highest for CR (0.734) and LM (0.388) (Table 3). Overall, these data portray an inverse relationship between survival and recruitment (Table 3). Seedling survival is influenced by resource availability, which is altered via intraspecific competition and other mortality factors such as herbivory, disease, and abiotic variables (Mohler Reference Mohler, Mohler, Liebman and Staver2004). This phenomenon, known as density-density mortality, is particularly salient in our study, given the absence of direct control measures (i.e., herbicide), which would otherwise serve as the primary source of seedling mortality.
While we did not measure the impact of other mortality factors on seedling survival, we did observe the presence of Disonycha glabrata (Coleoptera: Chrysomelidae), a native flea beetle, acting as a herbivore on A. palmeri seedlings. Amaranthus species, including A. palmeri, are hosts to this insect and can incur substantial damage to leaf surface area, particularly during juvenile life-history stages (Hemenway Reference Hemenway1968; Vorsah et al. Reference Vorsah, Dingha, Gyawaly, Fremah, Sharma, Bhowmik, Worku and Jackai2020). While we did not quantify the abundance of individuals within each treatment area, greater densities of D. glabrata were associated with larger patch sizes of A. palmeri. Based on Vorsah et al. (Reference Vorsah, Dingha, Gyawaly, Fremah, Sharma, Bhowmik, Worku and Jackai2020), the absence of ground cover (i.e., cover crop residue or living biomass) may reduce damage to host plants by altering the life cycle of D. glabrata, suggesting that cover crops and their indirect effects on A. palmeri abundance may discourage populations of this insect. While, to our knowledge, D. glabrata has not been explored as a potential biocontrol agent for A. palmeri, observations from our study suggest that it warrants further investigation, with consideration of trade-offs around its efficacy relative to cover crops.
Amaranthus palmeri Adult Plant Density, Biomass, and Fecundity
While the role of density-dependent mortality is evidenced by the inverse relationship between recruitment and survival rates (Table 3), surviving adult plant densities were proportional to cumulative seedling densities. For example, adult plant density was greatest for the BG treatment (67 and 27 plants m−2) and least for the LM treatment (9 and 10 plants m−2) in both years of the study, corresponding to the highest and lowest cumulative seedling densities in both years (data not shown) and associated cumulative recruitment rates (Figure 4; Table 3). While some nuance around adult plant density occurred with respect to CC and CR treatments between years, the relationship between cumulative seedlings and surviving adult plants is supported by strong correlations between these two parameters in both years of the study (R2 = 0.88, P < 0.001 in 2020, and R2 = 0.64, P < 0.001 in 2021) and is an established feature of population biology of annual plants, particularly annual weeds (Cousens and Mortimer Reference Cousens and Mortimer1995; White and Harper Reference White and Harper1970).
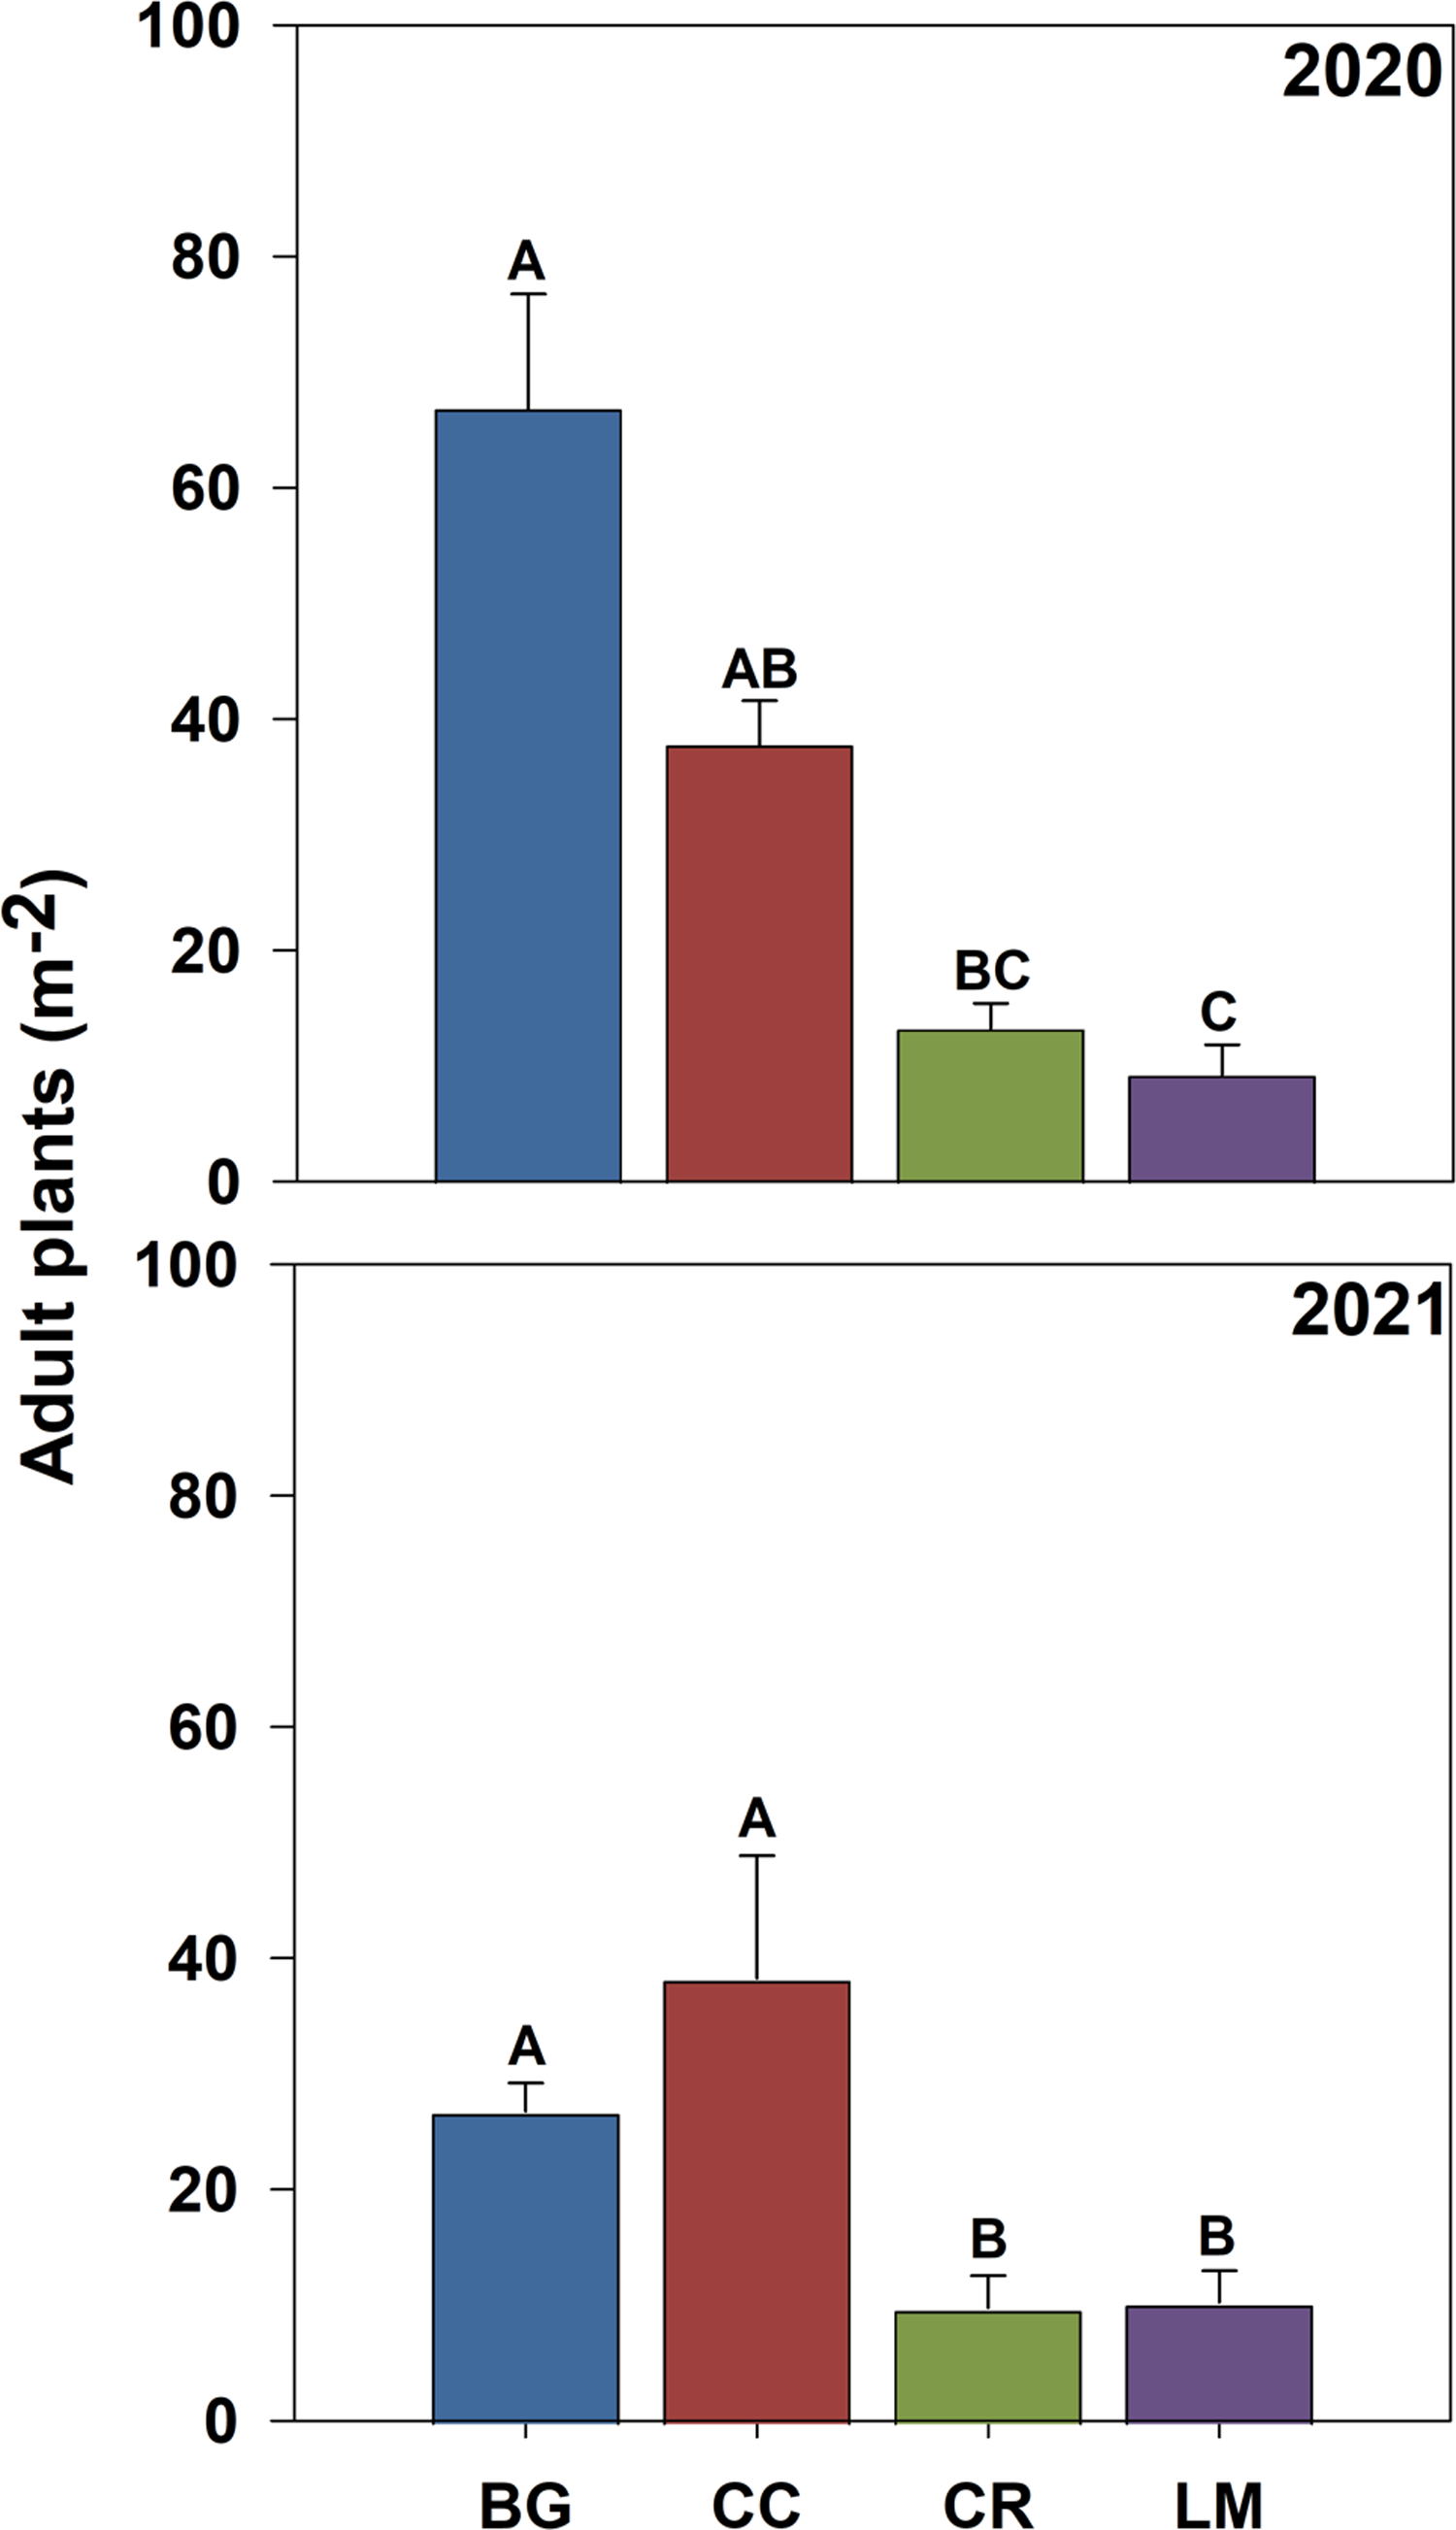
Figure 4. Adult Amaranthus palmeri plant density (m−2) bare ground (BG), crimson clover (CC), cereal rye (CR), and living mulch (LM) treatments in 2020 and 2021. Standard error bars were calculated for the mean for each treatment. Means with the same letter are not significantly different; Tukey’s honestly significant difference (HSD; α = 0.05).
Adult plant biomass (g m−2) did not differ across treatments (Table 3). The mean for biomass per square meter across all treatments was 690 g and 348 g in 2020 and 2021, respectively. Given management (i.e., resource) similarity across treatments, the lack of difference among treatments reflects the degree to which both density dependence and carrying capacity regulate total aboveground biomass production per unit area (Chu et al. Reference Chu, Maestre, Xiao, Weiner, Wang, Duan and Wang2008; Weiner et al. Reference Weiner, Stoll, Muller-Landau and Jasentuliyana2001). However, the allocation of aboveground biomass per plant did differ substantially (Figure 5). In both years, mean aboveground biomass per plant was greatest in the LM treatment (120 and 73 g) and smallest in the BG treatment (14 and 8 g), with CC and CR treatments having intermediate levels of aboveground biomass per plant in 2020 and 2021, respectively (Figure 5). Our results demonstrate that aboveground biomass allocation functions inversely to adult plant density (Bravo et al. Reference Bravo, Leon, Ferrell, Mulvaney and Wood2017, Reference Bravo, Leon, Ferrell, Mulvaney and Wood2018; Roberts and Florentine Reference Roberts and Florentine2021; Ward et al. Reference Ward, Webster and Steckel2013).
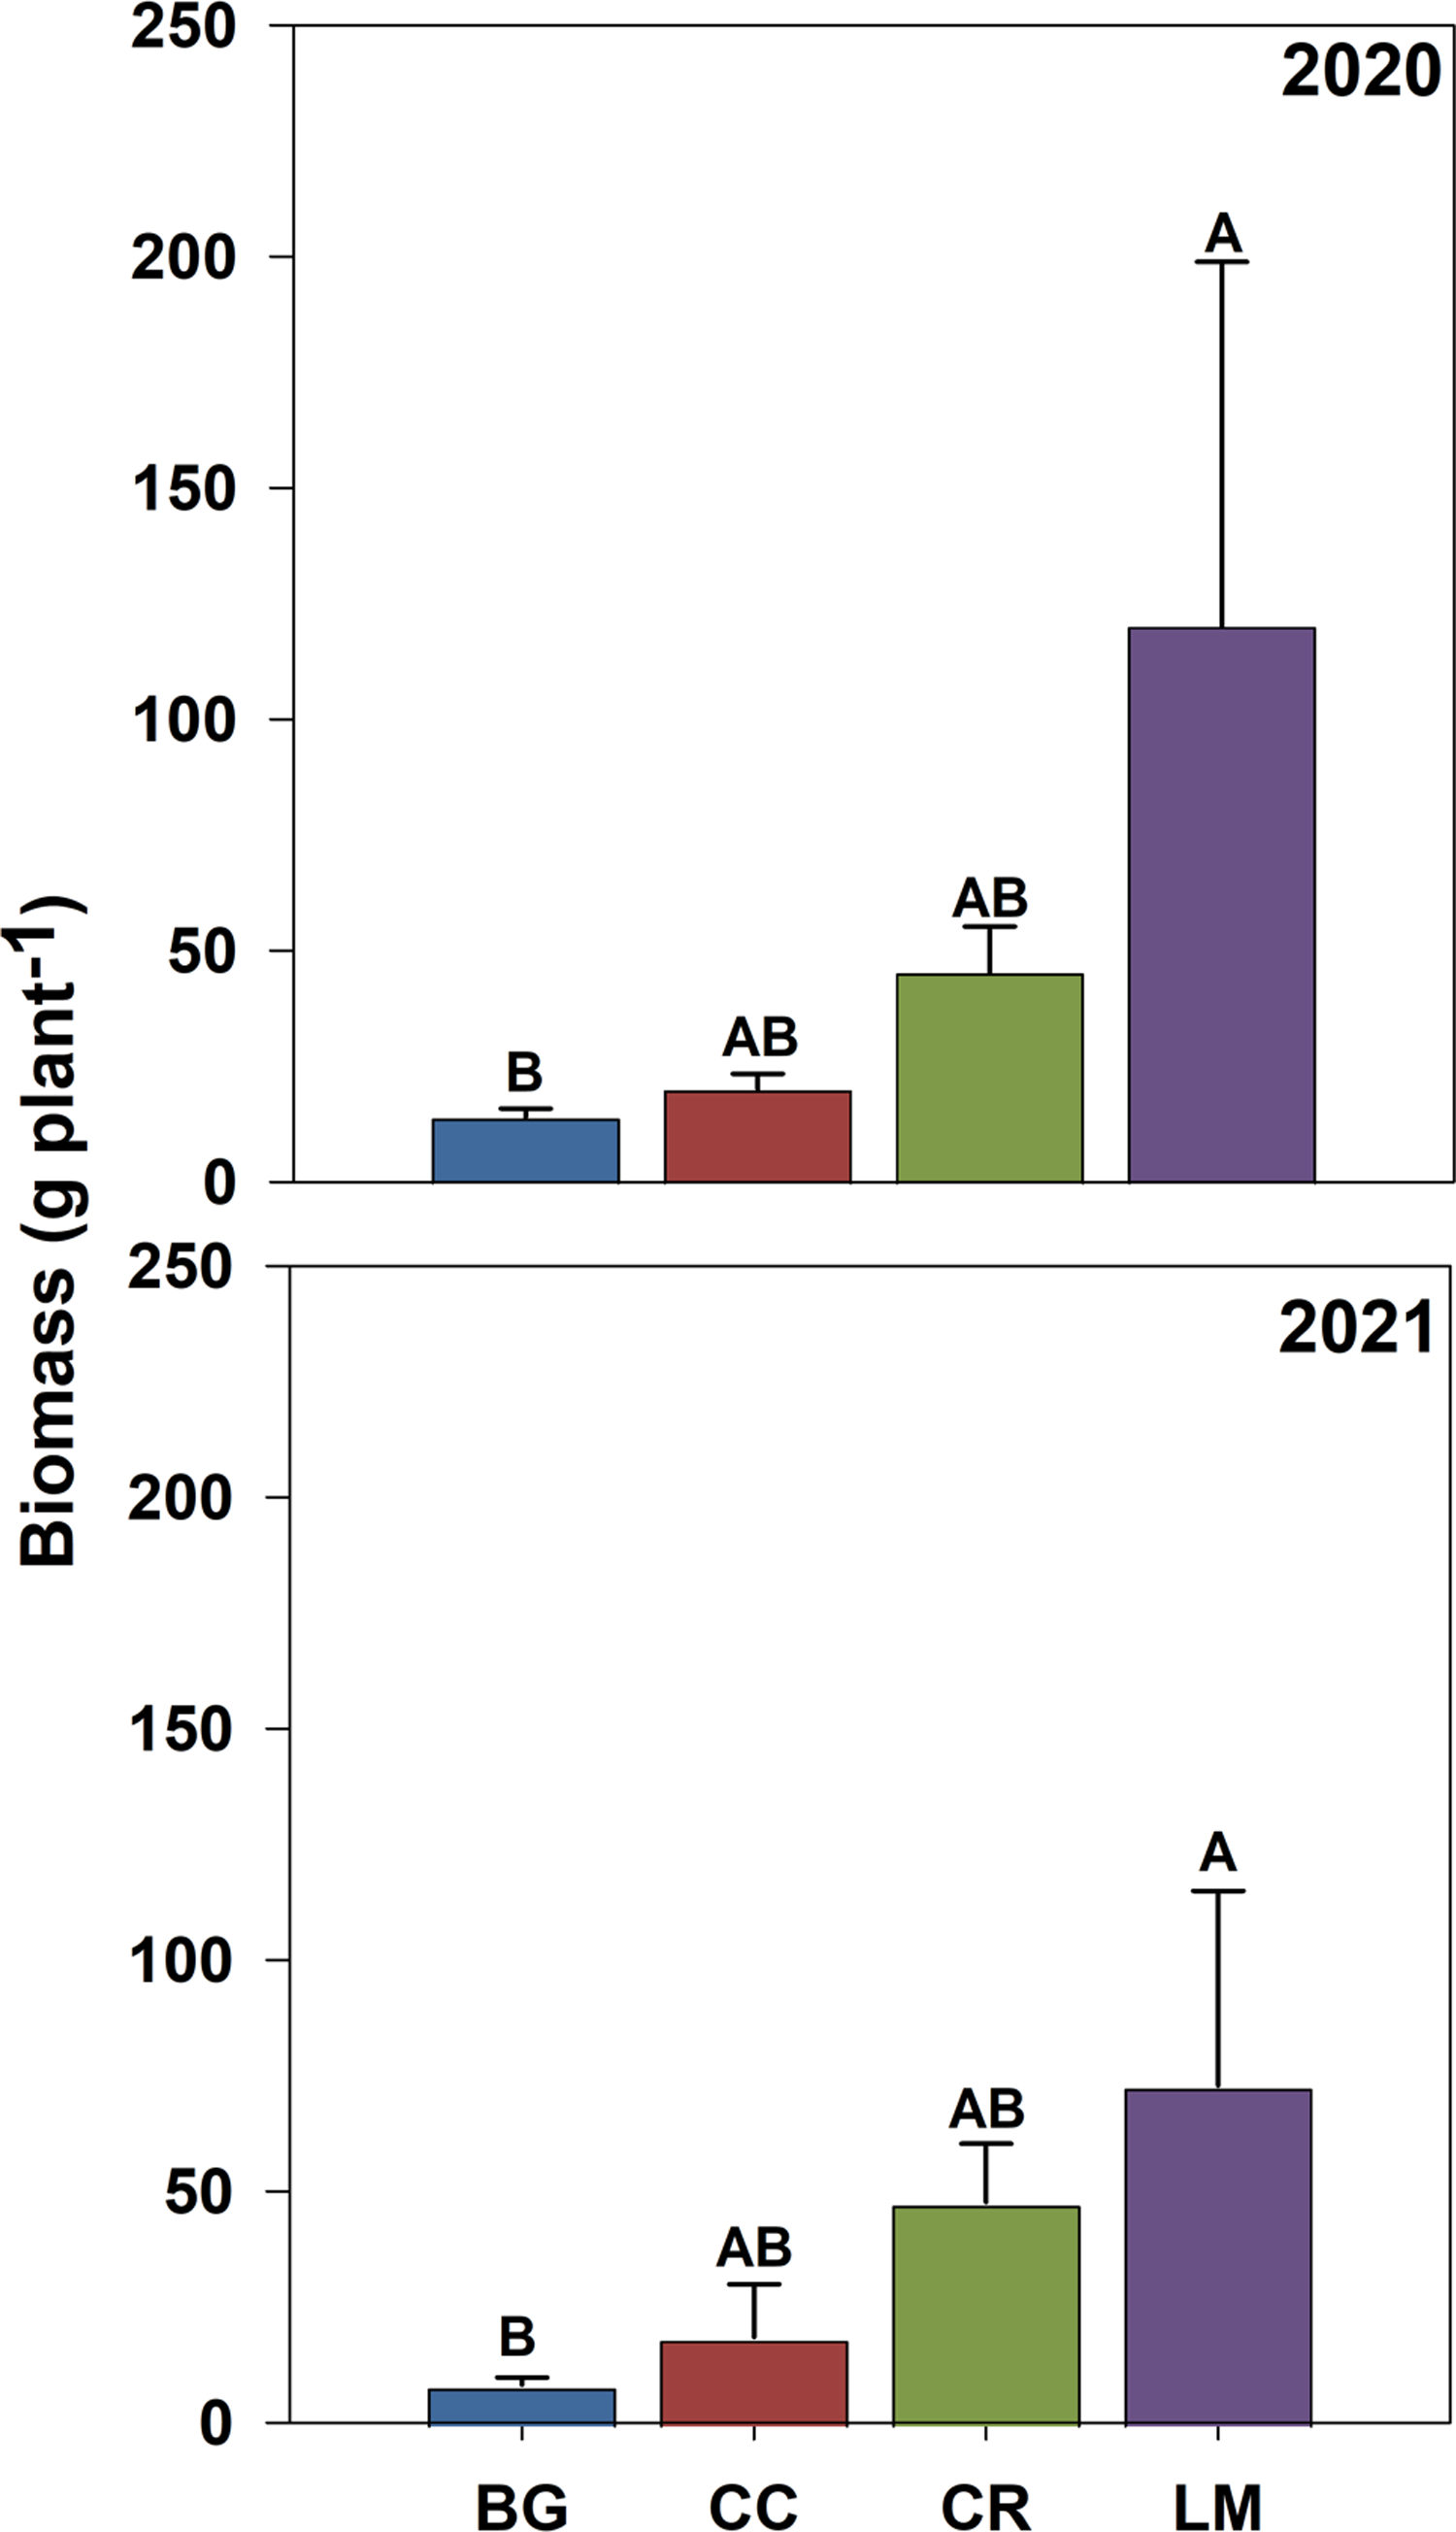
Figure 5. End-of-season biomass of Amaranthus palmeri (g plant−1) for bare ground (BG), crimson clover (CC), cereal rye (CR), and living mulch (LM) treatments in 2020 and 2021. Standard error bars were calculated for the mean for each treatment. Means with the same letter are not significantly different; Tukey’s honestly significant difference (HSD; α = 0.05).
Fecundity rates (seeds plant−1) followed the same pattern across treatments in both years of the study, with BG and CC treatments having the lowest, and LM having the greatest fecundity rates, respectively (Table 3). Fecundity rates can be tied directly to biomass per plant. Individual plants with greater biomass, particularly annuals in disturbed environments, tend to have greater fitness and therefore produce greater quantities of seeds (Weiner Reference Weiner2004). In both 2020 and 2021, the correlation coefficients between natural log (ln)-transformed fecundity and biomass per plant were 0.79 and 0.84 (P < 0.0001), respectively, supporting this phenomenon. Upstream effects of our cover crop treatments on initial seedling population size altered patterns of allocation and fecundity rates. However, fecundity was different between CR and LM treatments despite having the same quantity of surviving adult plants in both years (Figure 4; Table 3).
A similar study of cover crop and LM systems in corn production using the same LM species and cultivar documented sizable improvements for a suite of soil parameters relative to BG, CC, and CR treatments; these included rates of water infiltration, N mineralization, and labile carbon accumulation (Hill et al. Reference Hill, Levi, Basinger, Thompson, Cabrera, Wallace, Saikawa, Avramov and Mullican2021). The work of Hill et al. (Reference Hill, Levi, Basinger, Thompson, Cabrera, Wallace, Saikawa, Avramov and Mullican2021) highlights the potential for LM to generate soil-based legacy effects that could alter weed growth and reproductive output over time. While we cannot prove this based on our research, this could explain the 2-fold relative increase in fecundity rate for LM treatment plants in our second site-year (Table 3). Further research is needed to confirm whether this is indeed a consistent phenomenon and to describe the mechanism by which it may occur.
Annual Rate of Weed Population Change (Δ)
In 2020, the annual rate of population change was greatest for BG, lower for CC/LM, and lowest for CR (Table 3). The 2021 Δ values for plant population were the same across BG, CC, and CR, but greater in LM (Table 3). In both years, annual rates of population change for all treatments, regardless of intra-annual differences, were positive. In the absence of additional management tactics, we can expect continual additions of weed seed to the seedbank. In other studies, the addition of herbicide to the production system further reduces the population growth rate compared with the levels seen in our study and alters weed community composition trajectories from season to season (Oreja et al. Reference Oreja, Inman, Jordan and Leon2021, Reference Oreja, Inman, Jordan, Hardhan and Leon2022a, Reference Oreja, Inman, Jordan, Vann, Jennings and Leon2022b).
The annual rate of weed population change is a multiplicative function involving recruitment, survival, and fecundity (Equations 1 and 2). In our study, low rates of recruitment were associated with high rates of survival and fecundity, with the inverse also being true. As mentioned earlier, A. palmeri is remarkably plastic, and individual plants not controlled by herbicide or mechanical interventions are extremely efficient at producing large quantities of seed in the absence of intraspecific competition.
When dealing with a weed species such as A. palmeri, whose fecundity rates are potentially very high, population growth is unavoidable unless recruitment and survival rates are essentially driven to zero. This phenomenon has been demonstrated in a modeling study involving another species in the genus with similar characteristics, waterhemp [Amaranthus tuberculatus (Moq.) Sauer] (Liebman et al. Reference Liebman, Basche, Nguyen and Weisberger2021). In that work, requisite herbicide efficacy levels to reduce population growth even under a CR scenario were only marginally different from the BG scenario, indicating that despite the presence of a cover crop, the demographic trajectory of that weed species would increase if even a single female plant remained. This management reality of highly fecund weed species has been demonstrated clearly in Arkansas, where certain counties have implemented zero-threshold strategies (eliminating all seed-producing plants from a field) in order to reduce populations of HR A. palmeri (Norsworthy et al. Reference Norsworthy, Griffith, Griffin, Bagavathiannan and Gbur2014).
In both years of the study, recruitment and survival rates in CR and LM treatments remained small. However, despite reduced recruitment and survival in the CR and LM treatments, the fecundity of plants in these treatments was enough to maintain weed population growth similar to that in the BG and CC treatments. Yet despite heavy infestation levels, CR and LM maintained low levels of seedling recruitment in the second year of our study. While research was only conducted over a 2-yr period, this finding is promising. It suggests that certain annual cover crops and living mulches may improve weed suppression resiliency by maintaining relatively low levels of recruitment despite high seed inputs (Birthisel et al. Reference Birthisel, Clements and Gallandt2021; Grint et al. Reference Grint, Arneson, Arriaga, DeWerff, Oliveira, Smith and Werle2022). From a real-world standpoint, this could help farmers maintain small populations of A. palmeri despite potential escapes from previous seasons. While this idea is not well represented in the literature presently, we feel it has merit and is worthy of further inquiry. Longer-term annual cover crop and living mulch studies documenting seedbank and emergence data on both working farms and university research stations would be required to adequately test this hypothesis.
Our findings highlight the impact that certain annual cover crop and living mulch species can have in regulating the quantity of weed seedlings recruited from the seedbank. However, the continued need for judicious herbicide use to further reduce rates of recruitment, particularly survival, cannot be overstated. Sustainable management of A. palmeri requires an approach to weed management that integrates practices, maximizing the benefits of each while reducing their vulnerabilities. All of this will be particularly essential in cropping systems dealing with the presence of A. palmeri resistant to multiple herbicide mechanisms of action, as well as the evolving threat of metabolic resistance.
Supplementary material
To view supplementary material for this article, please visit https://doi.org/10.1017/wsc.2023.66
Acknowledgments
The authors would like to thank Cotton Incorporated for their support of this work through project no. 20-280. The authors would also like to thank Eric Elsner, Brooke Hale, JD Hale, and the rest of the members of the J. Phil Campbell Research and Education Center for their assistance with plot establishment and maintenance. Thanks to Logan Dyer, Jared Baker, Chad Hawkins, Sammy Zhang, Roberto Villanueva, Jon Markham, and Matthew Thibodeaux for their assistance in plot maintenance, data collection, and sample processing. No competing interests have been declared.


 Open access