


Changes in the eating behaviour of consumers could result in better public health because some chronic illnesses, such as diabetes, cancer or heart disease, could be caused by an unhealthy diet( Reference Kant1 ). Therefore, consumers should be motivated and enabled to adopt a more balanced and healthy diet. Consumers’ ability to correctly evaluate the healthiness of foods has been questioned, however. The question of how nutrition information should be designed and communicated to help consumers make healthier decisions has thus received much attention( Reference Cowburn and Stockley2 – Reference Hieke and Taylor4 ). Research suggests that front-of-package (FOP) labels may help consumers make healthier food choices( Reference Cowburn and Stockley2 ). However, a closer review of the literature reveals scant knowledge about how much FOP labels increase consumers’ ability to choose healthier products when confronted with realistic product information (e.g. complete FOP information, including brand names, food pictures and claims). In the present study, our aim is to examine whether a simple FOP label, such as a healthy choice label, enables consumers to make a better decision on which of the two products is healthier if they have all the information available at the point of purchase.
A number of studies have examined the impact of various types of FOP information on the perception about the healthiness of foods( Reference Borgmeier and Westenhoefer5 – Reference van Herpen, Seiss and van Trijp11 ). The labels and the tables used for communicating nutrition information differ in several aspects( Reference Cowburn and Stockley2 , Reference Hawley, Roberto and Bragg12 , Reference Hersey, Wohlgenant and Arsenault13 ). For example, the labels can be classified according to how directive they are( Reference van Herpen and van Trijp14 ). The non-directive nutrition table provides quantitative information about the nutrient content per 100 g of a food product. Directive labels, such as the ‘health tick’ or the ‘smart choice’ label, inform consumers the product to be chosen for a healthy diet. The impact of such directive labels has been investigated in various studies( Reference Borgmeier and Westenhoefer5 , Reference Hodgkins, Raats and Fife-Schaw8 , Reference van Herpen, Hieke and van Trijp10 , Reference van Herpen and van Trijp14 – Reference Scott and Worsley19 ) whose designs vary considerably. For example, in Borgmeier and Westenhoefer’s study( Reference Borgmeier and Westenhoefer5 ), the participants had to identify the healthier option in each of the twenty-eight food pairs. The food pairs belonged to different categories, and only three pairs from the grain/cereal/bread category were used. The authors found moderate impacts of the different label formats. Roberto et al.( Reference Roberto, Shivaram and Martinez18 ) used one high-sugar breakfast cereal. The FOP either had or did not have a smart choice label that provided information about the energy content per serving. This label had no impact on perceived healthiness, however. Hodgkins et al.( Reference Hodgkins, Raats and Fife-Schaw8 ) used another research approach, where the participants received information about the food type (e.g. pizza) and the nutrition table but none about the brand and no picture of the package. The nutrition information was combined with four different FOP labelling systems. This cited study found some small improvements for an objective understanding of some labelling systems.
Most of the reviewed studies suggest that FOP label schemes result in a more accurate evaluation of the healthiness of food products( Reference Hodgkins, Raats and Fife-Schaw8 , Reference van Herpen, Hieke and van Trijp10 , Reference Aschemann-Witzel, Grunert and van Trijp16 ). However, many of the studies lack ecological validity, and whether their results have practical implications is not fully clear. In some studies, the participants did not evaluate food products but only nutrition information( Reference Hieke and Wilczynski7 , Reference Hodgkins, Raats and Fife-Schaw8 ), which is not a realistic decision-making situation. In addition, the participants had to evaluate hypothetical nutrient profiles( Reference Jones and Richardson9 ), or even food products, with unrealistic nutrition data( Reference Hieke and Wilczynski7 ). In other studies, real products were used but were unbranded; therefore, important information that people may use in realistic decision-making situations was missing( Reference Borgmeier and Westenhoefer5 , Reference Gorski Findling, Werth and Musicus6 ). Some studies examined the impact of nutrition information on perceived healthiness( Reference van Herpen, Seiss and van Trijp11 ). The product selected as healthier in a direct comparison is more relevant than the perceived healthiness of a single product, however.
Most of the studies examining the effects of FOP labels discussed the representativeness of the sample of participants, but none of the studies paid attention to the representativeness of the stimuli (i.e. products). If researchers are interested in how consumers make decisions in their shopping environment, representative stimuli should be used( Reference Dhami, Hertwig and Hoffrage20 ). Even if people rely on simple heuristics (e.g. cereals with chocolate pieces are unhealthy), the decisions may be smart if the heuristic exploits the information in the environment where it is used( Reference Todd and Gigerenzer21 ). In other words, if an unrealistic decision set is used, as in the cases of most of the studies that we are aware, the results provide little information about whether an FOP label helps consumers select healthier products in a real environment. A realistic decision situation implies that participants choose from a set of alternatives that they may encounter in a real shop and that all alternatives belong to the same decision set (e.g. consumers do not substitute a soft drink with an apple). In some of the reviewed studies, the alternatives belonged to the same decision set but unbranded products were used( Reference Borgmeier and Westenhoefer5 ). At least one study used a broad set of alternatives belonging to the same decision set, but it did not fully describe the product selection process( Reference Aschemann-Witzel, Grunert and van Trijp16 ). Therefore, it remained unclear whether the participants could encounter all the selected products in one decision situation in real life.
In this study, we aimed to examine whether the participants would improve their ability to assess the healthiness of food products when a healthy choice label was introduced. To have a realistic product set, the participants had to compare the healthiness of a selection of cereals that could be found together in a grocery store. Our study’s representative design allowed the assessment of the effect of a healthy choice label when the participants had all the information about the products, similar to a real shopping situation.
Methods
Selection of products
The participants had to choose the healthier option for all possible pairs of the selected products. Therefore, a small but still realistic sample of products had to be chosen. The fourteen breakfast cereals offered in the convenience stores owned by a major Swiss retailer were chosen for the experiment (Table 1).
Table 1 Breakfast cereals presented in the choice tasks, including each brand, label and nutrient profile score
The nutrient profile score( Reference Rayner, Scarborough and Boxer22 ) has been used in various studies as a ‘gold standard’ for the healthiness of food products( Reference Bucher, Müller and Siegrist23 ). Therefore, we calculated each product’s nutrient profile score and used it to judge the correctness of the participants’ decisions regarding the healthiness of the cereals. The score increases with negative aspects, such as high amounts of fat, sugar and Na and decreases with positive ingredients, such as fibre and fruits. Thus, the higher the nutrient profile score, the less healthy the food is. The nutrient profile score is also used to identify less healthy foods for advertising control in the UK( Reference Lobstein and Davies24 ).
Labelling and nutrition table
Our goal was to examine whether a label that marked a healthy food product would help consumers correctly choose the healthy option. The criteria of the healthy choice label( 25 ) were used to determine the cereals that received the label. Based on the Choices Programme( 26 ), we tested whether the breakfast cereals had sufficient amounts of fibre (≥6·0 g/100 g) and no excessive amounts of saturated fat (≤3·0 g/100 g), Na (≤400 mg/100 g) and sugar (≤19·5 g/100 g). Since no such label currently exists in Switzerland, we designed the simple label shown in Fig. 1.

Fig. 1 Example of a comparison pair from the choice task. Participants saw unblurred pictures.
When consumers evaluate the healthiness of foods, they might check the nutrition table( Reference Visschers, Hess and Siegrist27 ), especially consumers with greater nutrition knowledge and interest( Reference Barreiro-Hurlé, Gracia and de-Magistris28 , Reference Visschers, Hartmann and Leins-Hess29 ). Thus, it is also of interest whether a healthy choice label results in better evaluations of the healthiness of food when the nutrition table is not shown to participants.
Procedure
We conducted an online experiment in which the fourteen cereals were presented in pairs (ninety-one paired comparisons), and the participants were asked to indicate which of the two cereals was healthier per paired item. The participants in all four groups were shown a picture of each FOP. Depending on the group, the following additional information was provided:
(1) control condition (no additional information),
(2) label condition (healthy choice label for the healthier product),
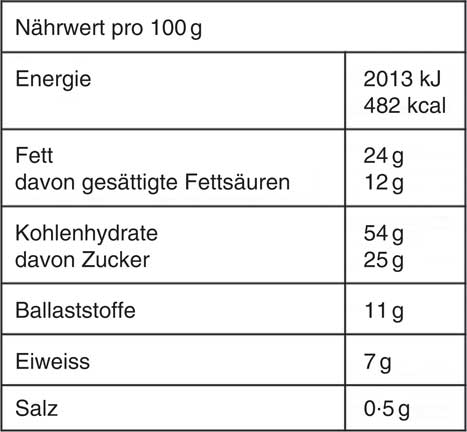
(3) table condition (nutrition table shown on demand, as depicted in Fig. 2) and

Fig. 2 Example of the nutrition information shown to participants assigned to two of the four conditions. For each cereal, information about energy, fat, saturated fat, carbohydrates, sugar, fibre, protein and sodium content was provided.
(4) combined condition (healthy choice label for the healthier product, nutrition table shown on demand).
The survey company randomly assigned the participants to one of the four conditions. (The survey software of the market research company randomly assigned the participants to one of the four groups. The randomisation was done in a way that age and sex were similar in all groups. To achieve the desired sample size of each group, additional people were invited in a second step. The survey company’s project manager and the participants were blinded to the experimental manipulation and the tested hypotheses.) Therefore, neither the participants nor the researchers could influence the participants’ assignments. The respondents were instructed to choose the product that, in their opinion, was healthier in all ninety-one possible product pairs. In the two conditions with the healthy choice label, before the task, the meaning of the label was explained with the following text: ‘based on scientific criteria, products that are especially healthy breakfast cereals are marked with the following label’. Each breakfast cereal product was shown in a photo (Fig. 1). The respondents who were assigned to either of the two conditions with the nutrition table could use a cursor to click on a box to see the nutrition information about both cereals (Fig. 2 shows a sample image of the nutrition information). The pairs were presented in the optimum order for paired comparisons, as defined by Ross( Reference Ross30 ). The product shown on the left or the right side of each pair was randomly determined.
To examine the consistency of the responses, five selected comparisons were repeated at the end. If two products were quite similar (e.g. a two-point difference in the nutrition profile score), the participants might not have shown consistent answers, but this was irrelevant because the cereals were almost equally healthy or unhealthy. Therefore, we randomly selected five test comparison pairs, with the requirement that the difference between the two products be at least four nutrient profile points.
After the choice task, the respondents filled in a questionnaire. First, they stated how often they consumed the breakfast cereals shown in the study. They then answered questions regarding their level of education and attitudes toward healthy eating.
Sample
The participants (German-speaking Swiss adults) were recruited from a market research company’s (Respondi) online panel by inviting them via email. The respondents received an incentive of 0·86 CHF (Swiss francs) (0·93 USD) for participation, which they could save for a larger incentive by participating in more surveys offered by Respondi. The quota sampling by sex and age group was applied.
This study was conducted according to the guidelines laid down in the Declaration of Helsinki. All procedures involving human subjects were examined by the ethics committee of ETH Zurich (EK 2018-N-28).
The required sample size was calculated, aiming at the detection of small effects. Therefore, for a value of 0·05, a power of 0·90 and an effect size between 0·10 and 0·15, a sample size of about 800 people was required( Reference Cohen31 ).
In total, 882 respondents completed the survey. The participants who finished it after less than half of the median time (Mdn = 15·34 min) were excluded (n 33) from the analyses. The respondents who showed low consistency in their choices (less than four identical answers for the five repeated comparisons) were also excluded (n 67). This resulted in a final sample of 780 participants (51·5 % female) with a mean age of 45 years. Of the sample, 8 % (n 66) had completed lower secondary or primary school, almost two thirds (66 %, n 511) had attended upper secondary vocational or business school, while one fourth (26 %, n 203) held a university or a college degree. Thus, the majority of the respondents had a higher degree of education, with a higher educational background than the general Swiss population, of which 18 % had a university or a college degree( 32 ). As shown in Table 2, the participants in the four conditions were comparable as expected (based on randomised allocation). (In the table/label combination condition, the percentage of the participants with a college/university degree was somewhat lower compared with the other three conditions. Therefore, the randomisation might not have worked as well as expected. We replicated all the analyses and included education as a factor. We did not find any significant condition ˟ education interactions. Therefore, the unequal level of education across the four groups had no impact on our results.)
Table 2 Recruited sample, number of excluded participants and demographics for each condition (Numbers and percentages; mean values and standard deviations)
Data analysis
The data were analysed using SPSS Statistics, version 23 (IBM). The correct choices were identified for each pair by comparing the nutrient profile scores of the two products. Thus, the cereal products with the lower nutrient profile scores were defined as the correct choices. Exceptions were made for comparisons of products that had a difference of 0 or 1 point (approximately 10 % of the total score). In these cases, the two products were classified as not different; thus, both choices were coded as correct. Both choices were considered correct in 15 % of the comparisons. We calculated the proportion of correct choices by each participant.
The respondents who were assigned to either the table condition or the combination condition could consult the nutrition tables if they wanted. Examining the nutrition tables could have increased the accuracy of their choices. Therefore, the association between the frequency of consulting the nutrition table and the number of correct decisions was calculated.
A healthy choice label could only be used if the healthiness of a product with a label was compared with that of a product without a label. Therefore, we were interested in the difference between the participants’ decisions if we focused on the comparisons where the label was more useful (i.e. one package had a label, and the other had none). We calculated the frequency of the correct choices for these thirty-three comparisons by each participant. To obtain the values for comparison, this frequency was also calculated for the two conditions without the label.
Not all errors are equally critical. If two cereals substantially differ in their nutrient profile scores, choosing the wrong cereal as healthier is a more severe mistake compared with the situation where two cereals do not differ very much. Therefore, we conducted an additional analysis in which each error was weighted by the difference in the nutrition score between the two cereals.
As the values were not normally distributed, we conducted Kruskal–Wallis tests to analyse the effects of the label and the nutrition table on the accuracy and the weighted accuracy score. To compare the different conditions, a pairwise comparison using rank sums was conducted( Reference Dunn33 ). We computed Spearman’s r correlation between the use of the nutrition table and both the accuracy and the weighted accuracy score, respectively.
Results
All of the selected cereals were reported to be consumed by some of the participants. The percentage of the participants who consumed a certain cereal at least a couple of times per year ranged between 14 and 58 .
Choice accuracy
The median proportion of correct choices was higher than chance in all conditions (Fig. 3). The accuracy was significantly affected by the condition (H(3) = 19·86, P < 0·001). The accuracy did not significantly differ between the conditions with the label (MdnLabel = 78 %, interquartile range (IQR) = 4 %) and without the label (MdnControl = 78 %, IQR = 6 %) (P = 0·060). The accuracy was significantly lower in the control condition than in the table condition (MdnTable = 78 %, IQR = 7 %) (P = 0·013) and the combined condition (MdnCombination = 79 %, IQR = 6 %) (P < 0·001). (Both the Mann–Whitney U test( Reference Mann and Whitney34 ) and the Kruskal–Wallis statistics( Reference Kruskal and Wallis35 ) test the hypotheses based on the rank information that one distribution is stochastically smaller than the other distribution(s). If the shapes of the distributions differ across the groups, one group can be stochastically larger though the medians of both groups have the same value.) Overall, the differences among the four conditions were small and not of practical relevance. The respondents’ choices were not significantly more accurate with a combination of both nutrition tables and labels compared with the healthy choice labels only (P = 0·063).
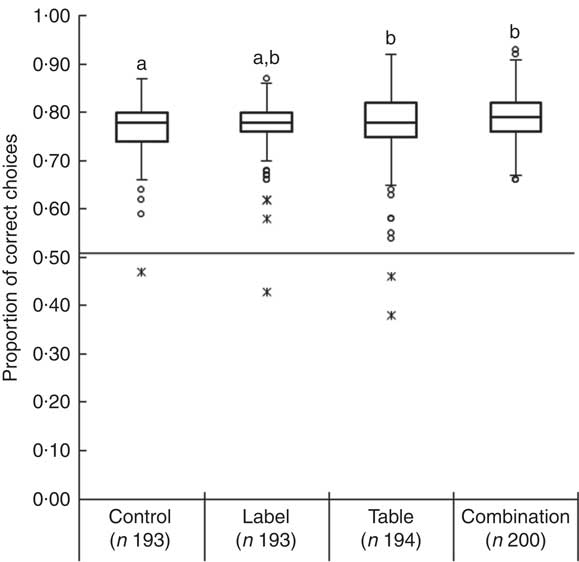
Fig. 3 Box plot of the proportion of correct choices in each condition (middle lines represent medians). a,bSignificant differences (P < 0·05).
The overall accuracy was significantly related to the frequency of the nutrition table consultation (r S 0·40, P < 0·001, 95 % bias-corrected and accelerated bootstrap interval (BCa CI 0·31, 0·48)).
We then focused only on the comparisons where one of the cereals had a label and the other had none. The median proportion of correct choices for these thirty-three comparisons was higher than chance in all conditions (Fig. 4). The accuracy was significantly affected by the condition (H(3) = 38·41, P < 0·001). The median accuracy was significantly lower in the control condition (MdnControl = 91 %, IQR = 9 %) than in the table (MdnTable = 94 %, IQR = 12 %, P = 0·004), the label (MdnLabel = 94 %, IQR = 12 %, P = 0·004) and the combined conditions (MdnCombination = 97 %, IQR = 9 %, P < 0·001). The accuracy was also significantly higher in the combination of both the nutrition table and the label than in the label (P = 0·035) and the table conditions (P = 0·036). The accuracy did not significantly differ between the respondent groups assigned to the healthy choice label and the nutrition table conditions. Overall, the differences among the four conditions were small and not of practical relevance.
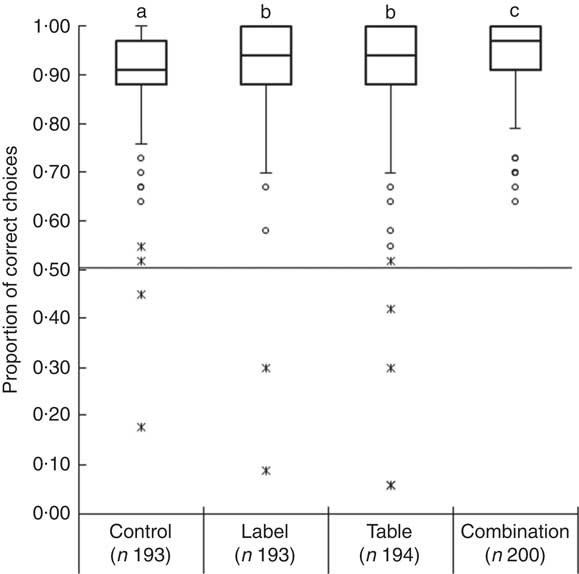
Fig. 4 Box plot of the proportion of correct choices for comparisons, including healthy choice options in each condition (middle lines represent medians). a,b,cSignificant differences (P < 0·05).
How severe are the errors made?
In the second step, the weighted errors were analysed. The median overall nutrient profile score (Mdn = 120 points) was relatively close to the lowest possible score of 0 point (if all ninety-one choices had been accurate) (Fig. 5). Nevertheless, the overall weighted scores were significantly affected by the condition (H(3) = 38·78, P < 0·001). The participants who were assigned to the label condition (MdnLabel = 123, IQR = 57) did not have a significantly lower weighted score than the participants in the control group (MdnControl = 134, IQR = 65, P = 0·22). The overall nutrient score was higher in the control condition than in the table (MdnTable = 114, IQR = 70, P < 0·001) and the combined conditions (MdnCombination = 109, IQR = 53, P < 0·001). The weighted score was significantly lower in the combined condition than in the label condition (P = 0·001) but not significantly different from the table condition (P = 0·40).

Fig. 5 Box plots of the overall nutrition score of choices made by respondents (middle lines represent medians). a,b,cSignificant differences (P < 0·05).
The frequent use of nutrition tables could result in choices with a lower weighted score. The weighted score was significantly related to the frequency of the nutrition table consultation (r S –0·48, P < 0·001, 95 % BCa CI –0·57, –0·39). The negative correlation indicated that the overall weighted score decreased with an increasing use of the nutrition tables. In other words, the participants who more frequently consulted the nutrition tables chose healthier cereals compared with those who looked less often at the nutrition tables.
Discussion
In many countries, people’s diets are not as balanced as they should be( 36 – 38 ). There are at least two possible reasons that do not exclude each other: consumers are not motivated to change their diets, or they lack the ability to choose healthier foods. It has been shown that consumers have a limited knowledge of nutrition( Reference Dickson-Spillmann, Siegrist and Keller39 – Reference Spronk, Kullen and Burdon42 ). Therefore, simple information, such as a healthy label, may be perceived as an effective way to enable consumers to select healthier products at the point of purchase. It should also be noted that in many situations, no elaborate nutrition knowledge is needed to make a healthier choice; simple heuristics may be sufficient for people to determine whether a food item is healthy. Of course, the use of simple heuristics may result in biased perceptions on foods( Reference Sütterlin and Siegrist43 ), but it may also lead to correct decisions if the cue used in the heuristic (e.g. sugar content) strongly correlates with the healthiness of the product( Reference Bucher and Siegrist44 ). The usefulness of simple heuristics (e.g. cereals with pictures of chocolates on their packages are unhealthy) depends on the characteristics of the choice environment (e.g. cereals with chocolate images on their packages are on average less healthy than other cereals).
To examine how well consumers can evaluate the healthiness of foods, the stimuli used should be representative of the decisions made by consumers at the point of purchase( Reference Dhami, Hertwig and Hoffrage20 , Reference Todd and Gigerenzer21 , Reference Gigerenzer45 ). In this study, we examined whether a healthy choice label would help consumers make better decisions in a realistic choice environment. The results of our experiment suggest that the participants could very well evaluate the healthiness of the cereals based on the information that could already be found on the cereals’ FOP. The participants who were assigned to the condition with the healthy choice label did not perform substantially better compared with the control group. We found that providing the nutrition tables slightly improved the participants’ performance, but adding healthy labels did not result in further improvement.
The healthy choice label can be used in a limited number of decision-making situations. If two cereals are marked with healthy choice labels, or neither of the two is labelled, the label cannot be used to select the healthier product. Even if only the decisions where the label could be used (one package with a label and the other without it) are analysed, the impact of the label is rather limited. The main reason for this finding is that the participants who are assigned to the control condition have already performed extremely well, and due to this ceiling effect, the impact of a label is restricted. The participants’ performance in the task is even more impressive if the errors are weighted by the difference in the nutrient profile scores of the two products. These weighted errors suggest that participants mainly make mistakes when they have to evaluate cereals with relatively similar scores but not when the products clearly differ in their nutrient profile scores.
Our study differed in two important aspects from previous studies that examined the impact of healthy choice labels on people’s health perception about foods( Reference Borgmeier and Westenhoefer5 , Reference Hodgkins, Raats and Fife-Schaw8 , Reference van Herpen, Hieke and van Trijp10 , Reference van Herpen and van Trijp14 – Reference Scott and Worsley19 ). We used a realistic choice set of products that could be found together in a store, and the participants were provided with the same information as they normally would have in a store, such as the brands of the cereals and the information shown on the FOP. We decided not to provide any price information because it would not be needed in evaluating the healthiness of cereals. Furthermore, we used an objective score (i.e. nutrient profile score) as the ‘gold standard’ that allowed the evaluation of the participants’ performance. Therefore, the present study provides information beyond that of past studies about the effect of a healthy choice label on consumers’ ability to choose healthy products.
Some possible limitations of the present study should be addressed. A crucial limitation is the investigation of only one product category (i.e. breakfast cereal). Future studies should examine whether similar results can be observed in other product categories (e.g. processed meat, snacks). Other shortcomings are related to using the Internet for data collection and the respondents receiving a token payment for their participation. Therefore, we had little control over how motivated the participants were in evaluating the healthiness of the cereals. If some less motivated people participated in the study, we might even have underestimated their ability to decide which product was healthier. The healthy choice label used in this experiment was new to the participants. Although we explained the meaning of the label, and the label itself was easy to interpret, we could not rule out that the participants’ lack of familiarity influenced the results. In this study, the data were collected using the Internet. Therefore, we could not rule out the inference that this study’s results offered a better prediction of the perceived healthiness of cereals in an online store compared with a brick-and-mortar store. The participants were also slightly better educated than the general Swiss population. This might also have influenced the observed results. Another drawback might be the low number of products with healthy choice labels. However, the reality is that only a small number of cereals found in many stores qualify for a healthy choice label. Should the composition of healthy/unhealthy cereals differ in another store or another country, the effect of a healthy choice label might vary. This issue is certainly an avenue for further research. Future studies should also examine whether similar effects can be observed for the traffic light or the Nutri-Score labels compared with the label used in the present study. We have also assumed that cereals with similar nutrition scores do not have significantly different health impacts.
Could this study’s results motivate the food industry to change its product packages, so that consumers would perceive the cereals as healthier? This case seems unlikely. The reason is that the FOP needs to be attractive not only to health-conscious consumers but also to purely hedonistic-oriented consumers. If chocolate pieces are shown on the FOP, this not only provides information about the sensory aspects of the cereals but is also a cue that can be used by consumers to assess the healthiness of the cereals.
The healthy choice label may not only provide information about the healthiness of a product but also remind consumers of the importance of choosing healthy products. Such an effect has been found in a study showing that traffic light labels on products can increase consumers’ awareness of healthy food( Reference Sonnenberg, Gelsomin and Levy46 ). Another positive effect of a healthy choice label could be its motivation for the food industry to improve the latter products’ nutritive content to justify the use of the label.
The present study shows that consumers perform well in evaluating the healthiness of cereals if the stimuli are selected to be representative of what consumers confront in a real purchase situation. In our study, the participants’ performance may be surprising, given that various studies suggest consumers’ limited nutrition knowledge( Reference Motteli, Barbey and Keller40 , Reference Parmenter and Wardle41 , Reference Parmenter and Wardle47 ). The findings are less surprising if the reader realises that people’s performance in a decision task is influenced not only by their ability but also by the characteristics of the decision situation. If the environment-specific cues (e.g. fruits in cereals) are correlated with the criteria that should be predicted (e.g. healthiness), the use of simple cues can result in smart decisions( Reference Todd and Gigerenzer21 , Reference Gigerenzer45 ).
The present research findings also have practical implications. If a healthy choice label does not substantially increase consumers’ ability to choose healthier foods, the value of such a label could be questioned. Nevertheless, a healthy choice label might have a priming effect (even if consumers’ abilities to choose healthy products are not enhanced) and could therefore increase consumers’ motivation to buy healthier products. A field experiment in an online shop would be a promising method to examine the effects of such a label on purchase behaviour. The present research results not only show that a healthy choice label does not increase consumers’ ability to make better decisions but also demonstrate the importance of representative research designs in examining consumers’ decision-making.
Acknowledgements
No funding for this study was obtained.
All authors contributed to the study design. G. A. L. directed the study and conducted the analysis. M. S. and G. A. L. wrote the article by incorporating critical inputs from C. H. All authors approved the final version of the article.
The authors declare no conflicts of interest.


