


Age-related cognitive decline is regarded as one of the most important public health challenges in the USA because of the rapidly growing population of older adults(Reference Harada, Natelson Love and Triebel1,Reference Anderson, Goodman and Holtzman2) . Diminished cognitive function compromises the quality of life and independence of later life and presents large societal and economic burdens(Reference Wiener and Tilly3–Reference Ahlqvist, Nyfors and Suhonen5).
To date, there are no effective means to alter the progression of age-related cognitive decline(Reference Shatenstein, Barberger-Gateau and Mecocci6). Therefore, the identification of strategies through which it can be prevented, minimised or delayed may help immensely in maintaining cognitive health across the adult life-span(Reference Shatenstein, Barberger-Gateau and Mecocci6,Reference Dominguez and Barbagallo7) . There is limited evidence that certain dietary patterns, including the Mediterranean(Reference Martinez-Lapiscina, Clavero and Toledo8,Reference Tangney, Li and Wang9) and Dietary Approaches to Stop Hypertension (DASH)(Reference Tangney, Li and Wang9,Reference Smith, Blumenthal and Babyak10) patterns, and a pattern combining aspects of both, the Mediterranean–DASH Intervention for Neurodegenerative Delay (MIND)(Reference Morris, Tangney and Wang11) dietary pattern, are associated with a slower age-related cognitive decline. These dietary patterns stress the importance of consuming plant-based foods such as fruits and vegetables. Bioactive components of these foods have also been widely explored for their potential neurocognitive benefits, particularly polyphenols such as flavonoids(Reference Spencer, Vauzour and Rendeiro12–Reference Beecher16).
Evidence from acute and short-term intervention studies on possible neurocognitive effects of flavonoid-rich foods is promising but limited by the brief duration of exposure(Reference Alharbi, Lamport and Dodd17–Reference McNamara, Kalt and Shidler24) and, thus, offer little understanding of the long-term benefits of flavonoids on age-related changes in cognitive health. On the other hand, available observational studies investigating the relation between flavonoids or flavonoid-rich food intake and changes in cognitive function have revealed inconclusive results. Yet, these existing observational studies have many notable limitations. These include the use of cross-sectional design, which precludes the establishment of a causal relationship between flavonoid intake and cognition(Reference Butchart, Kyle and McNeill25–Reference Kesse-Guyot, Fezeu and Andreeva29). Longitudinal studies of the relation between flavonoid intake and age-related cognitive changes also have limitations such as the lack of repeated assessments of flavonoid intake during follow-up(Reference Root, Ravine and Harper30–Reference Moreira, Diogenes and de Mendonca32), the utilisation of incomplete flavonoid databases(Reference Nooyens, Milder and van Gelder33) and the use of insensitive cognitive assessment tools such as the Mini-Mental State Examination (MMSE)(Reference Letenneur, Proust-Lima and Le Gouge31,Reference Moreira, Diogenes and de Mendonca32,Reference Kalmijn, Feskens and Launer34) . Therefore, existing evidence for the long-term association between flavonoid intake and age-related changes in cognitive function is similarly limited.
To address the shortcomings in our current understanding of the relationship between flavonoid intake and cognitive health, we undertook this study to examine the association between long-term intake of total and six classes of dietary flavonoids based on repeated dietary measures and decline in cognitive function using an extensive battery of neuropsychological (NP) tests assessed over a period of up to 15 years.
Methods
Study population
The Framingham Heart Study (FHS), a prospective cohort study designed to explore the risk factors associated with heart disease, started in 1948 with a total of 5209 individuals aged 28–62 years who were residents of Framingham, Massachusetts, USA(Reference Dawber, Meadors and Moore35). In 1970, the Framingham Offspring Study cohort was established consisting of the 5124 men and women who were offspring of the original cohort and their spouses(Reference Feinleib, Kannel and Garrison36). About every 4 years, this Offspring cohort completes a series of questionnaires, laboratory and cardiovascular tests, and undergoes a physical examination. Additionally, the cohort is closely monitored for various incident outcomes, including but not limited to CVD, stroke, diabetes, hypertension and dementia.
The present study utilised data derived from the Offspring cohort seventh (1998–2001), eighth (2005–2008) and ninth (2011–2014) study examinations. NP testing was initiated in the Offspring cohort as separately funded ancillary studies and was performed in conjunction with the seventh, eighth and ninth Offspring cohort exams. As the parent and ancillary study examinations were not conducted concurrently, it was possible for protracted time differences between these exams. Therefore, we assigned a 6-month lower cut-off and a 3-year upper cut-off for the length of time between any exam cycle and NP testing.
Figure 1 displays the flow diagram of our study participants. Our eligibility criteria included age ≥45 years at baseline, absence of dementia and attendance of at least two of the three study exams as a minimum of two exams were needed to establish change in NP tests. For participants free of dementia and aged ≥45 years at the seventh exam and attended the eighth and/or ninth exam, we used the seventh exam as their baseline exam. For those who did not attend the seventh exam, but did attend the eighth and ninth exams, we used the eighth exam as their baseline if they were aged ≥45 years and were free of dementia at this exam. Based on these criteria, there were 1918 eligible participants who contributed a total of 2868 observations. Of these observations, 196 were excluded because of an inability to impute BMI (n 2), having fewer than two valid dietary data points (n 136, as described below), or having mild cognitive impairment (MCI) at exams 5 or 6 (n 58, as described below). Our final sample comprised 2672 observations from 1779 eligible participants: 1527 observations in the seventh–eighth exam interval, 1054 in the eighth–ninth exam interval (893 individuals had observations included in both the seventh–eighth and eighth–ninth exam intervals), and 91 in the seventh–ninth exam interval. Participants who attended all three exams had two observations, whereas those who attended two exams had only one observation. We considered the rate of change in NP test scores between exams as the study unit of observation. This approach simplified the interpretation as there was large variability between participants for time between NP exams.

Fig. 1 Eligible Framingham Heart Offspring cohort study participants and observations, which represent the annualised change in NP tests between study exams
Flavonoid exposures
Dietary assessment
Dietary intakes of the participants were assessed at the fifth through the eighth Offspring cohort exam cycles using a validated semi-quantitative FFQ developed by Willett et al. (Harvard FFQ)(Reference Rimm, Giovannucci and Stampfer37). The FFQs were mailed to the participants before the examination, and the participants were asked to bring the completed questionnaire with them to their appointment. The FFQ consists of a list of 126 foods with a standard serving size and a selection of nine frequency categories ranging from ‘never or <1 serving/month’ to ‘≥6 servings/d’. Participants were asked to report their frequency of consumption of each food item during the last year. Participants could also add up to four additional foods that were important components of their diets but were not listed on the questionnaire. The FFQ also includes separate questions about use of vitamin and mineral supplements and type of breakfast cereal most commonly consumed. Intakes of food components, including both nutrients and non-nutrients, were computed by multiplying the frequency of consumption of each food item by the nutrient content of the specified portions.
The validity of flavonoid intake from the Harvard FFQ has not been directly evaluated, but the validity of food intake measurements based on a comparison between the FFQ and two 7-d diet records collected during the year time interval covered by the FFQ has been previously reported(Reference Feskanich, Rimm and Giovannucci38). This comparison revealed relatively high correlation coefficients between intakes from the FFQ and 7-d diet records for the major dietary sources of flavonoids in the Framingham Offspring cohort. These foods included red wine (0·83), orange juice (0·78), tea (0·77), oranges (0·76), apples/pears (0·70) and strawberries (0·38).
Validity of FFQ
An FFQ was judged as invalid if (i) reported energy intakes were <2510 kJ/d (<600 kcal/d) or >16 736 kJ/d (>4000 kcal/d) for women, and >17 573 kJ/d (>4200 kcal/d) for men; (ii) >12 food items were left blank; or (iii) participants had signs of significant cognitive decline (MCI) due to the concern of the accuracy of dietary reporting by individuals with evidence of cognitive impairment short of mild dementia. For this purpose, we defined MCI as performance falling below MMSE education-adjusted cut-off scores (score <22 for <7 years of education, score <24 for 8–11 years of education, score <25 for high school graduate, and score <26 for any education beyond high school)(Reference Downer, Fardo and Schmitt39). Any participant who had MCI at either exam 5 or 6 was excluded.
Characterising flavonoid intakes
The exposure of interest was the habitual intake of total and six principal flavonoid classes commonly consumed in the US diet, including flavanols, flavones, flavanones, flavan-3-ols, anthocyanins and flavonoid polymers, which were derived using the USDA flavonoid content of foods and the proanthocyanidin databases(40,41) . Intakes of individual flavonoid compounds were calculated as the sum of consumption frequency of each food multiplied by the content of the specific flavonoid for the specified portion size. To define the six flavonoid classes, we used the flavonoid classification of Cassidy et al. (Reference Cassidy, O’Reilly and Kay42). Total flavonoid intakes were calculated by the addition of intakes of all six flavonoid classes. Isoflavone intakes were not evaluated, as their habitual consumption in the US diet is very low(Reference Chun, Chung and Song43–Reference Nechuta, Caan and Chen45). We categorised our exposure into quartile categories of intake. Given the available evidence on the potential neurocognitive benefits of total flavonoids(Reference Letenneur, Proust-Lima and Le Gouge31,Reference Beking and Vieira46–Reference Devore, Kang and Breteler48) and the four flavonoid classes – flavanols(Reference Orhan, Daglia and Nabavi15,Reference Kesse-Guyot, Fezeu and Andreeva29,Reference Beking and Vieira46) , flavanones(Reference Alharbi, Lamport and Dodd17,Reference Lamport, Pal and Macready20) , flavan-3-ols(Reference Field, Williams and Butler19,Reference Scholey, French and Morris21) and anthocyanins(Reference Dodd18,Reference Whyte, Schafer and Williams22,Reference Whyte and Williams23,Reference Devore, Kang and Breteler48) – we considered these flavonoid classes as our primary exposures. As limited data are available on the possible protective cognitive effects of flavones and flavonoid polymers, they were considered as secondary exposures.
Neuropsychological outcomes
The outcome of this study was the annualised change in cognitive function as assessed by a battery of NP tests that target various cognitive domains. Table 1 displays the NP test battery administered to the Framingham Offspring cohort along with their associated cognitive domains(Reference Au, Seshadri and Wolf49). Our analyses comprised 13 commonly used NP tests to assess cognitive decline in the following eight cognitive domains: (i) verbal memory, (ii) visual memory, (iii) verbal learning, (iv) attention and concentration, (v) abstract reasoning, (vi) language, (vii) visuoperceptual organisation and (viii) global cognitive function. For cognitive domains represented by more than one NP test (verbal and visual memory, verbal learning, and attention and concentration), overall domain scores were calculated by averaging all of their associated NP test scores. The remaining NP tests (abstract reasoning, language and visuoperceptual organisation) each represented a unique cognitive domain. We also calculated a global cognitive function domain score by averaging all the individual scores from the aforementioned cognitive domains. As higher scores for the attention and concertation domain reflected poorer performance, we subtracted this domain score from the sum of other domains in creating the average. As each NP test score was scaled differently, we used z-scores to create standardised cognitive domain scores, which were calculated by subtracting each participant’s score on a given NP test from the overall mean score of our sample for that NP test divided by the sample standard deviation.
Table 1 Components of the neuropsychological (NP) test battery

WMS, Wechsler Memory Scale; WAIS, Wechsler Adult Intelligence Scale.
Covariates
We considered the following covariates as potential confounders in our analyses: age, sex, education (≤high school graduate, some or college graduate, >college graduate), prevalent stroke, hypercholesterolaemia, hypertension and diabetes, having at least one apo E ε4 (ApoE ε4) allele, BMI (kg/m2), current smoking status (smoking within the past year: yes/no), physical activity index (PAI) expressed in metabolic equivalents (Mets)(Reference Kannel and Sorlie50), total energy intake (TEI, kJ/d), overall diet quality (as assessed by the 2010 Dietary Guidelines Adherence Index, DGAI)(Reference Sauder, Proctor and Chow51), vitamin and mineral supplement use, and dietary intakes of non-nutritive sweetened beverages(Reference Pase, Himali and Beiser52) (servings per week), caffeine (mg/d), alcohol (g/d), n-3 fatty acids EPA and DHA (g/d) and lutein and zeaxanthin (mcg/d).
We defined stroke as having any of the following: atherothrombotic infarction of brain, cerebral embolism, intracerebral haemorrhage and subarachnoid haemorrhage(Reference Dufouil, Beiser and McLure53). Hypercholesterolaemia was determined by either taking cholesterol-lowering medication or having total cholesterol levels ≥5·2 mmol/l. Hypertension was defined as either taking blood pressure-lowering medication or having systolic or diastolic blood pressure ≥130 and/or ≥80 mmHg, respectively(Reference Muntner, Carey and Gidding54). Diabetes was assessed by any of the following criteria: (i) taking oral hypoglycaemic medication, (ii) insulin use, (iii) fasting blood glucose levels ≥ 7 mmol/l, (iv) non-fasting blood glucose levels ≥11·1 mmol/l.
In attempts to minimise missing covariate data in our analyses, we imputed the following continuous covariates: height, BMI and PAI. Height was imputed by bringing forward height data from the previous exam. BMI was imputed by using the available weight and imputed height data. PAI was imputed by determining the median PAI score of the sample who had available PAI data, stratified by gender, BMI, age and perceived health status, and applying those medians to participants with missing PAI data.
Statistical analyses
Main analyses
All data analyses were performed using SAS software (version 9.4; SAS Institute, Cary, NC). Our analyses focused on the standardised annualised change in the following eight cognitive domain scores: verbal and visual memory, verbal learning, attention and concentration, abstract reasoning, language, visuoperceptual organisation and the global function. The change in each NP test score was calculated for each participant as the difference between NP tests at two exam cycles with valid data. Further, we divided the change by the exam interval length (in years) to create the standardised annualised change. As the standardised annualised change was small across all cognitive domains, we multiplied it by 1000 to reduce the number of significant decimal points for the purpose of display in the tables. We used the standardised annualised change as our outcome to correct for the unequal time intervals between the exam cycles and to allow for missing the intermediate exam. To assess long-term flavonoid intake at each exam interval, we used the cumulative average of flavonoid intakes from Offspring exams 5 through 7/8. That is, for exam intervals 7–8 and 7–9, we used the cumulative average of flavonoid intakes from Offspring exams 5 through 7, and for exam interval 8–9, we used the cumulative average of flavonoid intakes from Offspring exams 5 through 8. Participants were required to have at least two valid FFQs to establish long-term/cumulative flavonoid intake. We categorised our exposures of interest, which included the cumulative average of total and six classes of flavonoids (flavanols, flavones, flavanones, flavan-3-ols, anthocyanins, flavonoid polymers) by quartiles of intake based on cumulative intake through each participant’s baseline.
Repeated-measures regression model (SAS PROC MIXED) was used to examine the longitudinal association between long-term total and each of the classes of dietary flavonoids and the standardised annualised change in the eight cognitive domain scores within exam intervals across the follow-up. Linear trend assessments across quartile categories of intake were performed using the median value of intake within each category treated as a continuous variable. We used baseline data for non-dietary covariates and cumulative average data for dietary covariates for each exam interval. To minimise missing categorical covariate data, ApoE ε4 and prevalent diabetes and hypercholesterolaemia included a third category for missing data. We used a nominal P-value of 0·05 to present our results, which was not adjusted for the number of associations that were tested. Dunnett’s correction for multiple comparisons was used to assess any significant differences between means of cognitive scores in the three higher quartile categories relative to those in the lowest intake category for the eight cognitive domains.
Our main analyses consisted of the following four models:
1. Model 1 (basic model): sex, age, education, TEI, ApoE ε4 and baseline measure of the cognitive domain score (i.e., the score at the beginning of exam interval).
2. Model 2 (clinical model): Model 1 covariates + BMI, prevalent stroke, diabetes, hypertension and hypercholesterolaemia.
3. Model 3 (lifestyle model): Model 1 covariates + PAI and smoking status.
4. Model 4 (dietary model): Model 1 covariates + overall dietary quality, vitamin and mineral supplement use and dietary intakes of non-nutritive sweetened beverages, caffeine, alcohol, n-3 fatty acids (EPA and DHA), and lutein and zeaxanthin.
Sensitivity analyses
In addition to our main analyses, we tested the potential effect modification of sex, age, ApoE ε4 and lag time between NP ancillary exams at which NP testing was performed and their corresponding clinical exams at which dietary information was collected.
Results
Cumulative flavonoid intake quartile category description (median (minimum, maximum)) of our sample (n 1779) at baseline across total flavonoids and six flavonoid classes is presented in Table 2. Table 3 displays the baseline characteristics of participants (n 1779) based on total and extreme quartiles of cumulative total flavonoid intake. Overall, the mean age (95 % CI) of the participants was 60·8 (60·4, 61·2) years, and 55·9 % were female. Participants were, on average, overweight, highly educated, moderately physically active and had a low prevalence of smoking, diabetes and stroke. However, they had a high prevalence of hypertension and hypercholesterolaemia and had, on average, moderate 2010 DGAI scores, a measure of overall diet quality. Relative to participants with lower intakes of total flavonoids, those with higher intakes were more likely to be women, highly educated and physically active, and to consume more calories and a higher-quality diet. They also smoked less and had a lower BMI.
Table 2 Cumulative flavonoid intake quartile category description for members of the Framingham Study Offspring cohort at baseline

Table 3 Age- and sex-adjusted baseline characteristics of participants based on total sample and extreme quartiles of cumulative total flavonoid intake
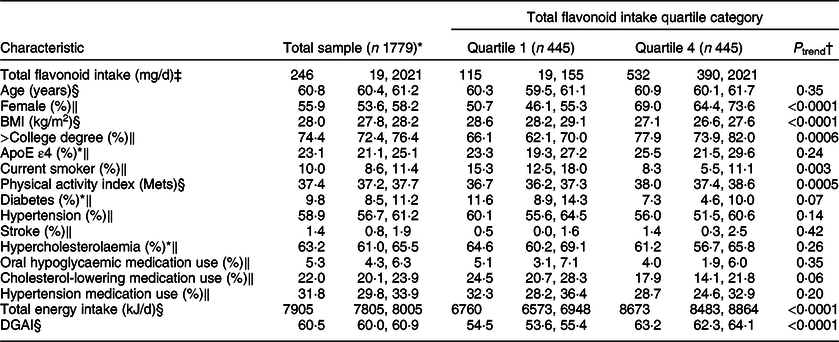
DGAI, Dietary Guideline Adherence Index.
* 37 missing ApoE ε4, 11 missing diabetes, 11 missing hypercholesterolaemia, 24 missing DGAI.
† P-values for the test of linear trend across extreme quartile categories of total flavonoid intake were based on linear regression models with the median intake of each extreme quartile category assigned to individuals with intake in that category, and this quartile median variable was used as a continuous measure in regression models.
‡ Values are medians; minimum and maximums in parentheses.
§ All values are age- and sex-adjusted (least-squares) means; 95 % CIs.
‖ All values are age- and sex-adjusted (least-squares) percentages; 95 % CIs.
Findings of the repeated-measures regression analyses relating long-term intake of total and six flavonoid classes to standardised annualised change in the eight cognitive domains were largely null, even at a nominal P-value of 0·05 (Tables 4a–h and online supplementary material, Supplemental Tables 1–8). Nominally significant trends towards a slower decline in cognitive function among those with the highest flavanol intakes were seen in at least three of the four statistical models of the following four cognitive domains: global function (Table 4a and online supplementary material, Supplemental Table 1), verbal memory (Table 4b and online supplementary material, Supplemental Table 2), visual memory (Table 4c and online supplementary material, Supplemental Table 3) and verbal learning (Table4d and online supplementary material, Supplemental Table 4). However, after Dunnett’s correction for multiple comparisons, the mean scores in the highest quartile category of flavanols was only significantly different from those in the lowest quartile category for verbal memory (Table 4b and online supplementary material, Supplemental Table 2; models 1–3) and visual memory (Table 4c and online supplementary material, Supplemental Table 3; models 1 and 2) cognitive domains. The same nominal significant trends were seen for flavan-3-ols in at least three of the four statistical models of the global, verbal, and visual memory cognitive domains. Yet, after Dunnett’s correction, relative to those in the lowest quartile category of flavan-3-ol intakes, the mean scores of those in the highest quartile category was significantly different only for the verbal memory (models 1–3) and visual memory (model 2) cognitive domains. As well, similar trends were observed for flavonoid polymers in all the four statistical models, and for total flavonoids in two of the four statistical models of visual memory cognitive domain. Yet, none of the visual memory scores in the upper quartile category means of these two flavonoid classes were significantly different from the means on the lowest intake quartile after Dunnett’s correction except for flavonoid polymers in model 2. None of the other flavonoid classes showed similar inverse trends for any of the eight cognitive domains.
Table 4a Mean annualised change in the standardised rate × 1000* of cognitive decline over a median follow-up of 11·8 years, across quartiles of total and six classes of flavonoid intake: global function cognitive domain†

* All values are mean least-squares annualised change in global function cognitive domain score multiplied by 1000; 95 % CIs.
† Of the total 2672 observations, there were 2255 complete data for global function cognitive domain.
‡ P-values for the test of linear trend across quartile categories were based on linear regression models with the median intake of each quartile category assigned to individuals with intake in that category, and this quartile median variable was used as a continuous measure in regression models.
§ Adjusted for age, sex, education, total energy intake, apo E ε4 and global function score at the beginning of the exam interval (model 1).
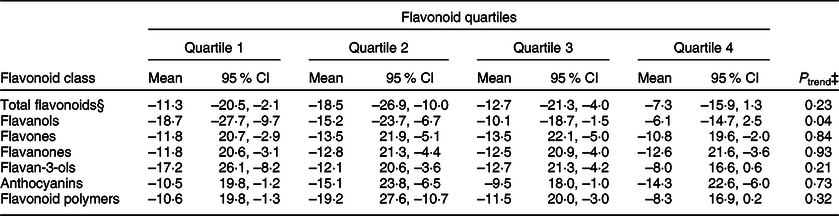
Table 4b Mean annualised change in the standardised rate × 1000* of cognitive decline over a median follow-up of 11·8 years, across quartiles of total and six classes of flavonoid intake: verbal memory cognitive domain†

* All values are mean least-squares annualised change in verbal memory cognitive domain score multiplied by 1000; 95 % CIs.
† Of the total 2672 observations, there were 2603 complete data for verbal memory cognitive domain.
‡ P-values for the test of linear trend across quartile categories were based on linear regression models with the median intake of each quartile category assigned to individuals with intake in that category, and this quartile median variable was used as a continuous measure in regression models.
§ Adjusted for age, sex, education, total energy intake, apo E ε4 and verbal memory score at the beginning of the exam interval (model 1).
‖ Significantly different from quartile 1 by Dunnett’s test (P < 0·05).
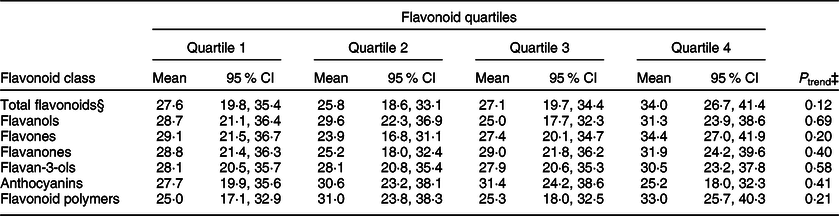
Table 4c Mean annualised change in the standardised rate × 1000* of cognitive decline over a median follow-up of 11·8 years, across quartiles of total and six classes of flavonoid intake: visual memory cognitive domain†

* All values are mean least-squares annualised change in visual memory cognitive domain score multiplied by 1000; 95 % CIs.
† Of the total 2672 observations, there were 2609 complete data for visual memory cognitive domain.
‡ P-values for the test of linear trend across quartile categories were based on linear regression models with the median intake of each quartile category assigned to individuals with intake in that category, and this quartile median variable was used as a continuous measure in regression models.
§ Adjusted for age, sex, education, total energy intake, apo E ε4 and visual memory score at the beginning of the exam interval (model 1).
‖ Significantly different from quartile 1 by Dunnett’s test (P < 0·05).
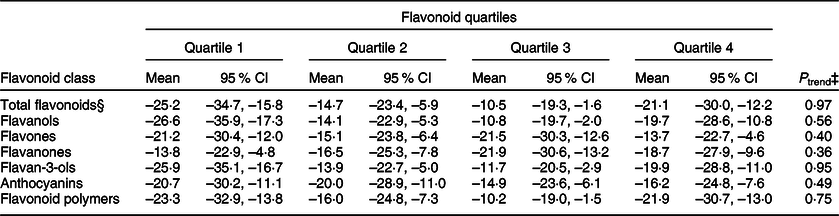
Table 4d Mean annualised change in the standardised rate × 1000* of cognitive decline over a median follow-up of 11·8 years, across quartiles of total and six classes of flavonoid intake: verbal learning cognitive domain†
* All values are mean least-squares annualised change in verbal learning cognitive domain score multiplied by 1000; 95 % CIs.
† Of the total 2672 observations, there were 2571 complete data for verbal learning cognitive domain.
‡ P-values for the test of linear trend across quartile categories were based on linear regression models with the median intake of each quartile category assigned to individuals with intake in that category, and this quartile median variable was used as a continuous measure in regression models.
§ Adjusted for age, sex, education, total energy intake, apo E ε4 and verbal learning score at the beginning of the exam interval (model 1).
Table 4e Mean annualised change in the standardised rate × 1000* of cognitive decline over a median follow-up of 11·8 years, across quartiles of total and six classes of flavonoid intake: attention and concentration cognitive domain†
* All values are mean least-squares annualised change in attention and concentration cognitive domain score multiplied by 1000; 95 % CIs.
† Of the total 2672 observations, there were 2491 complete data for attention and concentration cognitive domain.
‡ P-values for the test of linear trend across quartile categories were based on linear regression models with the median intake of each quartile category assigned to individuals with intake in that category, and this quartile median variable was used as a continuous measure in regression models.
§ Adjusted for age, sex, education, total energy intake, apo E ε4 and attention and concentration score at the beginning of the exam interval (model 1).
Table 4f Mean annualised change in the standardised rate × 1000* of cognitive decline over a median follow-up of 11·8 years, across quartiles of total and six classes of flavonoid intake: abstract reasoning cognitive domain†
* All values are mean least-squares annualised change in abstract reasoning cognitive domain score multiplied by 1000; 95 % CIs.
† Of the total 2672 observations, there were 2648 complete data for abstract reasoning cognitive domain.
‡ P-values for the test of linear trend across quartile categories were based on linear regression models with the median intake of each quartile category assigned to individuals with intake in that category, and this quartile median variable was used as a continuous measure in regression models.
§ Adjusted for age, sex, education, total energy intake, apo E ε4 and abstract reasoning score at the beginning of the exam interval (model 1).
Table 4g Mean annualised change in the standardised rate × 1000* of cognitive decline over a median follow-up of 11·8 years, across quartiles of total and six classes of flavonoid intake: language domain†

* All values are mean least-squares annualised change in language cognitive domain score multiplied by 1000; 95 % CIs.
† Of the total 2672 observations, there were 2602 complete data for language cognitive domain.
‡ P-values for the test of linear trend across quartile categories were based on linear regression models with the median intake of each quartile category assigned to individuals with intake in that category, and this quartile median variable was used as a continuous measure in regression models.
§ Adjusted for age, sex, education, total energy intake, apo E ε4 and language score at the beginning of the exam interval (model 1).
Table 4h Mean annualised change in the standardised rate × 1000* of cognitive decline over a median follow-up of 11·8 years, across quartiles of total and six classes of flavonoid intake: visuoperceptual organisation cognitive domain†

* All values are mean least-squares annualised change in visuoperceptual organisation cognitive domain score multiplied by 1000; 95 % CIs.
† Of the total 2672 observations, there were 2524 complete data for visuoperceptual organisation cognitive domain.
‡ P-values for the test of linear trend across quartile categories were based on linear regression models with the median intake of each quartile category assigned to individuals with intake in that category, and this quartile median variable was used as a continuous measure in regression models.
§ Adjusted for age, sex, education, total energy intake, apo E ε4 and visuoperceptual organisation score at the beginning of the exam interval (model 1).
An assessment of effect modification (interaction tests) of total and six classes of flavonoids by age and cognitive function based on all the eight cognitive domains indicated only seven nominally significant interactions between: (i) flavones, flavanones and flavan-3-ols and age on global function cognitive domain, (ii) flavones and age on verbal learning cognitive domain, (iii) both total flavonoids and flavonoid polymers and age on abstract reasoning cognitive domain, and (iv) flavonoid polymers and age on language cognitive domain (online supplementary material, Supplemental Table 9). However, further examination with age-stratified analyses (three age categories: 45–59, 60–69, 70+) showed no meaningful differences between the three age groups (data not shown). We observed no nominally significant interactions with sex (online supplementary material, Supplemental Table 9). Additionally, we only observed modest nominal significant interactions of ApoE ε4 with flavones on verbal memory (P < 0·01), abstract reasoning (P < 0·01) and language cognitive domains (P < 0·05) (data not shown). Likewise, nominal significant interactions of lag time were seen with total flavonoids (P < 0·04), flavan-3-ols (P < 0·01) and flavonoid polymers (P < 0·03) only on the visuoperceptual organisation cognitive domain (data not shown). Given the large number of interactions considered in our analyses (seven flavonoids × eight cognitive outcomes × four interactions = 224 tests), we did not consider any of these interactions to be informative.
Discussion
To the best of our knowledge, this is the most comprehensive and longest longitudinal study to date to examine the long-term relationship between flavonoid intake and age-related cognitive decline. We hypothesised that greater intakes of total flavonoids and four flavonoid classes (flavanols, flavanones, flavan-3-ols and anthocyanins) would be associated with improved maintenance of cognitive health with age based on prior observations. However, we observed only limited evidence among our 1779 participants of any beneficial associations between flavonoid intake, regardless of its class, and decline in cognitive function. Although we observed nominally significant inverse trends between higher intakes of flavanols and flavan-3-ols and cognitive decline across multiple cognitive domains (global function, verbal and visual memory), as well as between higher intakes of total flavonoids and flavonoid polymers on visual memory cognitive domain, and flavanols on verbal learning cognitive domain, none of these trends remained statistically significant after adjustment for the number of flavonoid classes and cognitive domains considered in these analyses. Some previous observational studies have demonstrated associations between higher flavanol and flavan-3-ol intakes and slower cognitive decline(Reference Kesse-Guyot, Fezeu and Andreeva29,Reference Root, Ravine and Harper30,Reference Moreira, Diogenes and de Mendonca32) , but flavonoid polymers have not previously been reported to be associated with changes in neurocognitive function.
Our null findings are in agreement with two prior longitudinal studies(Reference Nooyens, Milder and van Gelder33,Reference Kalmijn, Feskens and Launer34) , but are in contrast to four existing longitudinal studies that demonstrated protective cognitive effects of flavonoids and/or flavonoid-rich foods(Reference Root, Ravine and Harper30–Reference Moreira, Diogenes and de Mendonca32,Reference Devore, Kang and Breteler48) . With reference to the two null studies, Nooyens et al. (Reference Nooyens, Milder and van Gelder33) explored the relationship between dietary intake of flavonoids, as assessed by two FFQ assessments, and cognitive decline in healthy middle-aged (mean age 55 years) adults of the Doetinchem Cohort Study over a follow-up period of 5 years based on changes in four cognitive domain scores (global function, memory function, speed of cognitive processing and cognitive flexibility). No associations were observed between extreme quintiles of flavonoid intake and cognitive domains of global function, memory function and speed of cognitive processing; unexpectedly, higher flavonoid intake was associated with a greater decline in cognitive flexibility. Similarly, Kalmijn et al.(Reference Kalmijn, Feskens and Launer34) did not support a role for flavonoid intake, as measured by the cross-check dietary history method at two time-points, in the prevention of cognitive decline, as assessed by change in the MMSE score of participants in the Zutphen Elderly Study over 3 years of follow-up. As for the positive studies, Root et al.(Reference Root, Ravine and Harper30) found that across quintiles of intake, increased total flavanols was associated with less decline in total cognitive function (a summed score of three cognitive tests), over 6 years of follow-up in middle-aged US individuals (mean age 54 years) of the Atherosclerosis Risk in Communities study population. In contrast to our approach, their dietary intake data were measured at only one time-point that preceded the first cognitive function testing by 3 years. Additionally, they had minimal adjustment for overall diet quality. Another longitudinal study examining the relation between flavonoid intake and cognitive function among dementia-free French subjects of the Personnes Agees QUID cohort aged ≥65 years revealed that after 10 years of follow-up, individuals in the two highest quartiles of flavonoid intake experienced less cognitive decline, as assessed by change in the MMSE score, relative to those in the lowest quartile of flavonoid intake(Reference Letenneur, Proust-Lima and Le Gouge31). This study also utilised dietary data from one time-point (at baseline), used a less sensitive test of cognitive function (MMSE) and had no adjustment for diet quality. Moreira et al. examined the association between the consumption of chocolate, a flavan-3-ol-rich food, and cognitive decline in cognitively healthy Portuguese participants aged ≥65 over a median follow-up of 4 years. They found that dietary chocolate intake (yes/no), assessed at baseline, was associated with a lower risk of cognitive decline, as measured by change in the MMSE score, but only among subjects with low daily consumption of caffeine (average intake <75 mg/d)(Reference Moreira, Diogenes and de Mendonca32). Overall, diet quality was not accounted for in their analyses. Devore et al. prospectively evaluated the effects of long-term intakes of berries (strawberries and blueberries) and total and class-specific flavonoids on cognitive function, as assessed by two repeated assessments of three cognitive outcomes, in older women (mean age 74 years) of the Nurse’s Health Study over a period of 4 years(Reference Devore, Kang and Breteler48). The study demonstrated that, when comparing extreme categories of intake, higher consumption of berries, anthocyanins and total flavonoids were associated with slower rates of cognitive decline in the global composite score. In addition, higher intakes of blueberries and total flavonoids were also associated with slower rates of cognitive decline in both verbal memory composite score and telephone interview of cognitive status.
Although some of these studies might have been limited by the short follow-up period, a single dietary assessment measure and/or a less sensitive cognitive assessment test, these limitations would tend to underestimate the association between flavonoid intake and cognitive function. Therefore, it is unlikely that they are responsible for the discordant findings seen herein. Three out of four studies did not account for overall diet quality, a major confounder of the relationship between flavonoid intake and cognitive health, which might have positively biased their results; however, this is unlikely the cause of discrepancy with our findings as we did not observe any statistically significant associations prior to adjusting for diet quality. An important consideration in the failure to observe a relationship between flavonoids and cognitive health is that the effect of isolated flavonoid compounds may be relatively small and may be difficult to detect given the measurement error in the dietary and NP assessment tools, except in very large population samples. Therefore, a holistic dietary approach might be required to show any protective cognitive effects of flavonoids, as seen in studies exploring the neuroprotective effects of different dietary patterns that contain flavonoid-rich foods such as the Mediterranean(Reference Martinez-Lapiscina, Clavero and Toledo8,Reference Tangney, Li and Wang9) , DASH(Reference Tangney, Li and Wang9,Reference Smith, Blumenthal and Babyak10) and the MIND(Reference Morris, Tangney and Wang11), all of which have revealed promising results.
We sought to address many earlier limitations of studies assessing the long-term relationship between flavonoids and cognitive function through the use of a more inclusive approach. The strengths of our study include the prospective design, use of up to four dietary assessments of total and all six classes of flavonoids, utilisation of three repeated assessments of a sensitive battery of NP tests that target eight cognitive domains, incorporation of more complete flavonoid databases, adjustment of overall diet quality and intake of key dietary components that have been associated with cognitive function, exclusion of subjects with MCI because of possible effects on dietary reporting, and the relatively long follow-up time (median follow-up of 11·8 years). However, despite these strengths, we were not able to confirm the positive associations between flavonoid intake and cognitive decline seen in earlier longitudinal studies. Our study was limited in that we did not use the most recent 2018 version of the USDA flavonoid database, as it had not been incorporated into the Harvard FFQ database at the time the analyses were performed. Thus, the flavonoid content of some of the newly added foods was not captured. However, given that this represents only a small number of foods (including different types of olives and olive oils, additional data on blueberry varieties, updated and new data for cranberry and raspberry products), it was unlikely that this influenced the assessment of habitual dietary flavonoid intake. Further, the 2007 version of the USDA flavonoid database that was used for the current flavonoid content of the FFQ database is still considered a complete flavonoid database than those used in many of the earlier observational studies on flavonoids and cognition. Another potential limitation is that we assessed the overall mean change in cognitive domain scores, which might not capture the effect of flavonoid intake on individuals with the most extreme change in cognitive function. However, we explored the effect of total and six flavonoid classes on the prevalence of extreme MMSE score changes with the criterion being 0·5 unit loss in the MMSE score per year over a median of 11·8 years of follow-up, and did not see any significant associations (data not shown). Possible reasons for not showing any major effects with flavonoid intakes in those with extreme changes in cognitive function are the relatively young age of our study population at baseline (mean age 60·8 years), as only 19·3 % were ≥70 years, and the exclusion of participants with dementia. Moreover, lag time between the NP ancillary study visits and their corresponding routine clinical exams at which flavonoid intake data were obtained could have impacted our results. However, sensitivity analyses assessing the influence of lag time on study results did not show any significant impact. A final limitation is the generalisability of our results as all participants of the FHS Offspring cohort were white and of European descent.
In summary, the notion that flavonoids may exert long-term protective neurocognitive benefits remains unclear. Based on up to four repeated dietary and three repeated NP testing assessments over a median follow-up of 11·8 years, our results failed to assert any protective cognitive associations between total flavonoids and any flavonoid class in the eight cognitive domains, apart from nominally significant trends observed for total flavonoids, flavanols, flavan-3-ols and flavonoid polymers. Our findings do not support an association between long-term higher flavonoid intakes and improved cognitive performance, although we cannot rule out such associations based on the nominally significant observations in this study. Future research in larger and more racially and ethnically diverse subjects with wide ranges of flavonoid intake is warranted. There is also a need for more studies assessing the cognitive effect of flavonoids as part of a whole diet, taking into consideration various dietary components concurrently as an overall dietary pattern.
Acknowledgements
Acknowledgements: We would like to thank Elizabeth Mahon and Ting Fang Alvin Ang from the Brain Health Research Lab/Neuropsychology Group at the Framingham Heart Study for their assistance on the project. Financial support: This research was supported in part by the US Department of Agriculture– Agricultural Research Service (ARS), Agreement No. #58-1950-4-003; the National Heart Lung and Blood Institute by contract No. HHSN2682015000011; the National Institute on Aging by AG-008122, AG-16495 and AG062109; the National Institute of Neurological Disorders and Stroke, NS-17950; and the Embassy of the State of Kuwait (to ES). The views expressed in this article are of those of the authors and do not necessarily represent the views of the funding organisation. Conflict of interest: None. Authorship: E.S. developed the research question, designed the study, carried out data analyses and drafted the manuscript. G.R. assembled the study database and guided statistical analyses. R.A. and J.B. provided their expertise in the cognition and flavonoid aspects of this research, respectively. P.J. contributed to the design of study and provided guidance on data interpretation and analysis. All authors contributed to the interpretation of study findings, editing and approval of the final manuscript. Ethics of human subject participation: This study was conducted according to the guidelines laid down in the Declaration of Helsinki. The original data collection protocols and procedures were approved by the Institutional Review Board at Boston University Medical Center, and written informed consent was obtained from all participants. The present study protocol was reviewed by Tufts University Health Sciences Institutional Review Board.
Supplementary material
To view supplementary material for this article, please visit https://doi.org/10.1017/S136898001900394X


