


Iodine is an essential raw material for synthesising thyroid hormones, and long-term iodine deficiency can lead to thyroid diseases, such as endemic goitre, hypothyroidism and endemic cretinism(Reference Wang, Luo and Zang1,Reference Triggiani, Tafaro and Giagulli2) . According to a report by Zimmermann MB in 2008, there were approximately 2 billion people in the world who did not have enough iodine intake(Reference Zimmermann, Jooste and Pandav3). Considering that school-age children are the most sensitive group to iodine deficiency, indicators of iodine nutritional status in school-age children are used to evaluate the iodine status of the general population in a certain area, which includes the median of urinary iodine concentration (MUIC) and thyroid goitre rate (TGR)(Reference Gyamfi, Wiafe and Ofori Awuah4,Reference Guo, Pan and Zhang5) .
Urinary iodine concentration (UIC) is considered an economical, effective and easy-to-detect indicator reflecting iodine intake(Reference Katagiri, Yuan and Kobayashi6). The WHO defines a region’s population iodine deficiency as the MUIC of school-age children in this region being < 100 µg/l(Reference Zimmermann and Andersson7). However, the MUIC can only reflect the recent iodine status of the population and cannot evaluate the iodine level of individuals(Reference Zou, Ding and Lou8). In contrast, thyroid volume (TVOL) using ultrasound measurements can reflect the nutritional status of children over the last several months and is advantageous because of its objectivity and small errors. The TGR of school-age children is considered as a stable indicator to evaluate the iodine status of the population(Reference Liu, Meng and Liu9,Reference Chen, Zhang and Wu10) .
At present, the reference values for TVOL in China were established in 2007 and were based on age(11). The view that TVOL increases with age has been confirmed many times. However, an increasing number of papers report that height, weight, body surface area (BSA) and body mass index (BMI) were also strongly correlated with TVOL(Reference Semiz, Senol and Bircan12–Reference Licenziati, Valerio and Vetrani15). Zou Y’s study found that BSA and age were positively correlated with TVOL(Reference Zou, Ding and Lou8). A recent study in Liu’s showed that TVOL was influenced by age, weight, coverage rate of iodised salt and salt iodine content(Reference Liu, Liu and Li16). With improved living conditions, children’s physical development has improved in China. According to the census results, the average weight and height of Chinese children increased by 3·0 kg and 2·2 cm, respectively, from 2005 to 2014(Reference Dong, Jan and Ma17). Therefore, the increase in height and weight may lead to changes in TVOL, and it is worth further study on whether to use age as the classification standard for reference values of TVOL.
This study aims to explore the influential factors and reference values for TVOL and to provide a reference for revising the diagnostic criteria of endemic goitre in China to better meet the needs of iodine deficiency disorder prevention and monitoring.
Materials and methods
Investigation areas and subjects
From 2019 to 2020, areas with sufficient iodine supplementation were randomly selected from four provinces, central (Anhui), eastern (Zhejiang), western (Gansu) and northern (Heilongjiang) [the median of water iodine concentration was less than 40 µg/l, and the MUIC of children was between 100 and 299 µg/l]. In each province, two cities (urban and rural survey site) were selected according to their economic levels. In total, eight survey sites were selected. Next, we randomly selected a district/county in each city, and then randomly selected a street/township in each district/county. One primary school was randomly chosen in each street/township, and if there were not enough students in each school, other schools nearby were chosen to get enough children. Children aged 6–12 years were randomly selected from each primary school, with 100 children in each age group (the ratio of boys to girls was 1:1). Children who potentially had hyperthyroidism, thyroiditis or thyroid tumours were excluded based on B-ultrasound.
In this study, the sampling method was multi-stage stratified sampling(Reference Zou, Ding and Lou8,Reference Teng, Yang and Shi18,Reference Yang, Lu and Weng19) , and the subjects of investigation were non-boarding children who were permanent residents and had been drinking local water for at least half a year.
Ethics statement
This study was conducted according to the guidelines laid down in the Declaration of Helsinki(20), and all procedures involving human subjects were approved by the Medical Ethics Committee of the Center for Endemic Disease Control of Harbin Medical University. We obtained informed consent from the guardians of the participating children, which was in writing.
Investigation indicators and criteria
Basic information about the children such as the age, gender and residence was obtained through a questionnaire. The age of the children was calculated accurately according to the days between the survey date and the children’s birth date.
The height and weight of participants were measured with the same type of height rulers and weighing scales after taking off their shoes and coats. The height measurement was accurate to 0·1 cm, and the weight was accurate to 0·01 kg(Reference Chen, Zhang and Wu10). BSA and BMI were calculated according to the following formula: BSA=weight (kg)0·425 × height (cm)0·725 × 0·007184, BMI = weight (kg)/ [height (cm)2].
Urine samples from children were collected in dry, clean and sealed iodine-free tubes, stored in refrigerators at −20°C and measured within four months of collection(Reference Cui, Liu and Su21,22) . UIC was determined by the arsenic Ce catalytic spectrophotometry method(22). The intra and inter assay coefficients of variation of this method in our laboratory are 2·3 % and 2·7 % (n 16). The evaluation criteria for iodine nutrition are as follows: iodine deficiency is defined as an MUIC < 100 µg/l, adequate MUIC is 100–199 µg/l, above adequate MUIC is 200–299 µg/l and excess MUIC is ≥ 300 µg/l(Reference Zimmermann and Andersson7).
Edible salt (50 g) from children’s households was collected and stored in a dry and clean airtight bag. The quantitative detection (direct titration) method in ‘General Test Methods for Salt Industry-Determination of Iodine’ was adopted to determine salt iodine content(23).
A salt iodine content < 5 mg is defined as non-iodised salt. At present, the iodine content standard of edible salt in China incorporates three levels: 20 mg/kg, 25 mg/kg and 30 mg/kg, of which up and down 30 % are limits of qualified iodised salts. Each province can choose a suitable standard according to their actual conditions. Anhui and Zhejiang chose 25 mg/kg as their iodine content standard for edible salt, Gansu chose 30 mg/kg and Heilongjiang chose 25 mg/kg or 30 mg/kg. The content of qualified iodised salt was 18–33 mg/kg, 21–39 mg/kg and 18–39 mg/kg, respectively. The formula for coverage rate of iodised salt is the percentage of salt samples with iodine content ≥ 5 mg in the tested salt samples. Consumption rate of qualified iodised salt: the percentage of salt samples with iodine content at the national standard range in the tested salt samples(24).
Water iodine concentration was measured by arsenic cerium catalytic spectrophotometry. For areas with a centralised water supply, two terminal water samples were collected, and the mean iodine concentration was calculated. In the case of non-centralised water supply areas, two samples were collected from each east, west, south, north and central location in each survey area. The median of water iodine concentration was calculated(Reference Wang, Cui and Chen25,Reference Wang, Wan and Liu26) .
TVOL was measured by B-ultrasound with a probe frequency of 7·5 MHz or above by experienced inspectors from the National Centers for Disease Control and Prevention or provincial centres for disease control and prevention. The subjects were in a sitting position with the neck slightly extended to fully expose the thyroid(Reference Hess and Zimmermann27). TVOL equals the sum of the right and left lobe volumes, excluding the isthmus of the thyroid. The length, width and height of the left and right thyroid lobes were measured, and the volume of each thyroid lobe was calculated with the following formula: V (ml) = 0·479 × d (mm) × w (mm) × l (mm) × 0·001(Reference Wang, Luo and Zang1).
Quality control
Children’s TVOL was measured by the same type B-ultrasound machine, and inspectors were national experts or provincial experts certified by the state who were trained in advance with unified standards. When measuring the urine and salt samples, for each batch of samples, the external standard samples were measured, and the results of the standard materials were within a given range. The national reference lab of iodine deficiency disorders was responsible for surveillance and guidance of the lab determination quality. In this study, the laboratory examined urinary iodine passed the external assessment by the Institute of Nutrition and Health, Chinese Center for Disease Control and Prevention(28).
Statistical analysis
Epidata 3·1 was used to enter the data, and then the data were saved in Excel 2016. Because UIC and TVOL were skewed distribution, which was described by the median. The Mann–Whitney test was used to compare TVOL between the differences of genders. Spearman’s rank correlation analysis was used to test the relations between variables. The variance inflation factor was used to test multicollinearity among independent variables. A variance inflation factor ≥ 10 indicates that there is serious multicollinearity between independent variables. Ridge regression was used to screen variables to solve the multicollinearity problem, and the generalised cross-validation method was used to select the best parameter λ. Quantile regression was used to analyse the relationship between the quantiles of TVOL and other variables. The quantile method was used to establish the reference value for TVOL. χ 2 test was used to compare difference of TGR. All the above statistical methods were analysed by R Programming Language 4.0.
Results
Sample characteristics
In four provinces, eight survey sites were selected to carry out on-site investigation, and a total of 5653 children were recruited, including 2838 boys and 2815 girls. The median TVOL of boys was 2·97 ml and that of girls was 2·90 ml. There was no significant difference in TVOL between boys and girls (P > 0·05). Stratified analysis by age showed that there were no statistically significant differences in TVOL between the different sexes except for children aged 6 and 8 years (online Supplementary data 1). The median of water iodine concentration of all survey sites was < 40 μg/l. The total coverage rate of iodised salt and consumption rate of qualified iodised salt were 92·73 % and 85·14 %, respectively. The MUIC of children in Gansu and Zhejiang Provinces was greater than the requirement, and Heilongjiang and Anhui Provinces were at a suitable level. The MUIC of all children was 214·3 μg/l. The situation at each survey site is shown in Table 1.
Table 1. Basic information of each survey site
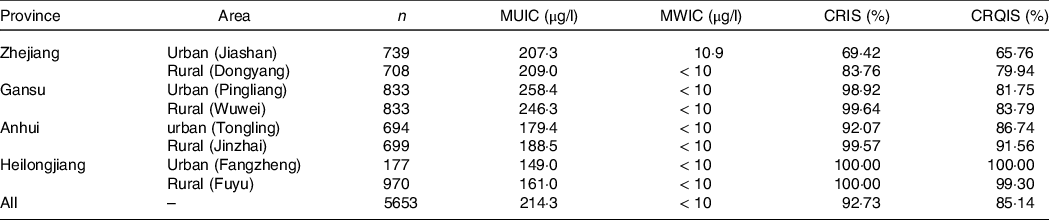
MUIC, median of urinary iodine concentration; MWIC, median of water iodine concentration; CRIS, coverage rate of iodised salt; CRQIS, consumption rate of qualified iodised salt.
Correlation analysis between growth factors and thyroid volume of children
Spearman’s rank correlation analysis showed that total TVOL was positively correlated with age, height, weight, BSA and BMI, and the correlation coefficients were 0·616, 0·663, 0·669, 0·685 and 0·479, respectively. Among them, the correlation between TVOL and BSA was the strongest.
The correlation analysis of each province showed the same result, that is, the correlation between TVOL and BSA was the strongest. We can also see that compared with other provinces, the correlation coefficient of Gansu province between variables and TVOL was much higher than other provinces. The results of correlation analysis are shown in Table 2.
Table 2. Correlation analysis between growth factors and thyroid volume (TVOL) of children

BSA, body surface area.
Analysis of factors influencing thyroid volume based on ridge regression
The independent variables were tested by variance inflation factor, and the results showed that the variance inflation factor of BSA, height and weight were 1125·39, 281·64 and 325·80, respectively, which was much higher than 10. Therefore, we analysed the influencing factors of TVOL by ridge regression. The key step in ridge regression is the selection of parameter λ, which was calculated by generalised cross-validation. When λ was 0·08, the mean square error of the model was minimal (Fig. 1). According to the ridge trace and coefficient (Fig. 2), the regression coefficients of height, weight and BMI were relatively stable and small, which had little effect on TVOL, and they were eliminated. The variables after screening were age and BSA, and the ridge regression coefficients were 0·13 and 0·94 respectively. R2 of the regression equation was 0.44.

Fig. 1. Ridge regression parameter under GCV. The dashed line in the Fig. 1 is the cross–validation curve, and the upper and lower standard deviation curves (error lines) along the λ sequence. The mean square error is the smallest when λ is located at the leftmost vertical dashed line. The λ value calculated by R Programming Language is 0·08. The five in the topmost means that there are five independent variables. GCV, generalised cross-validation.
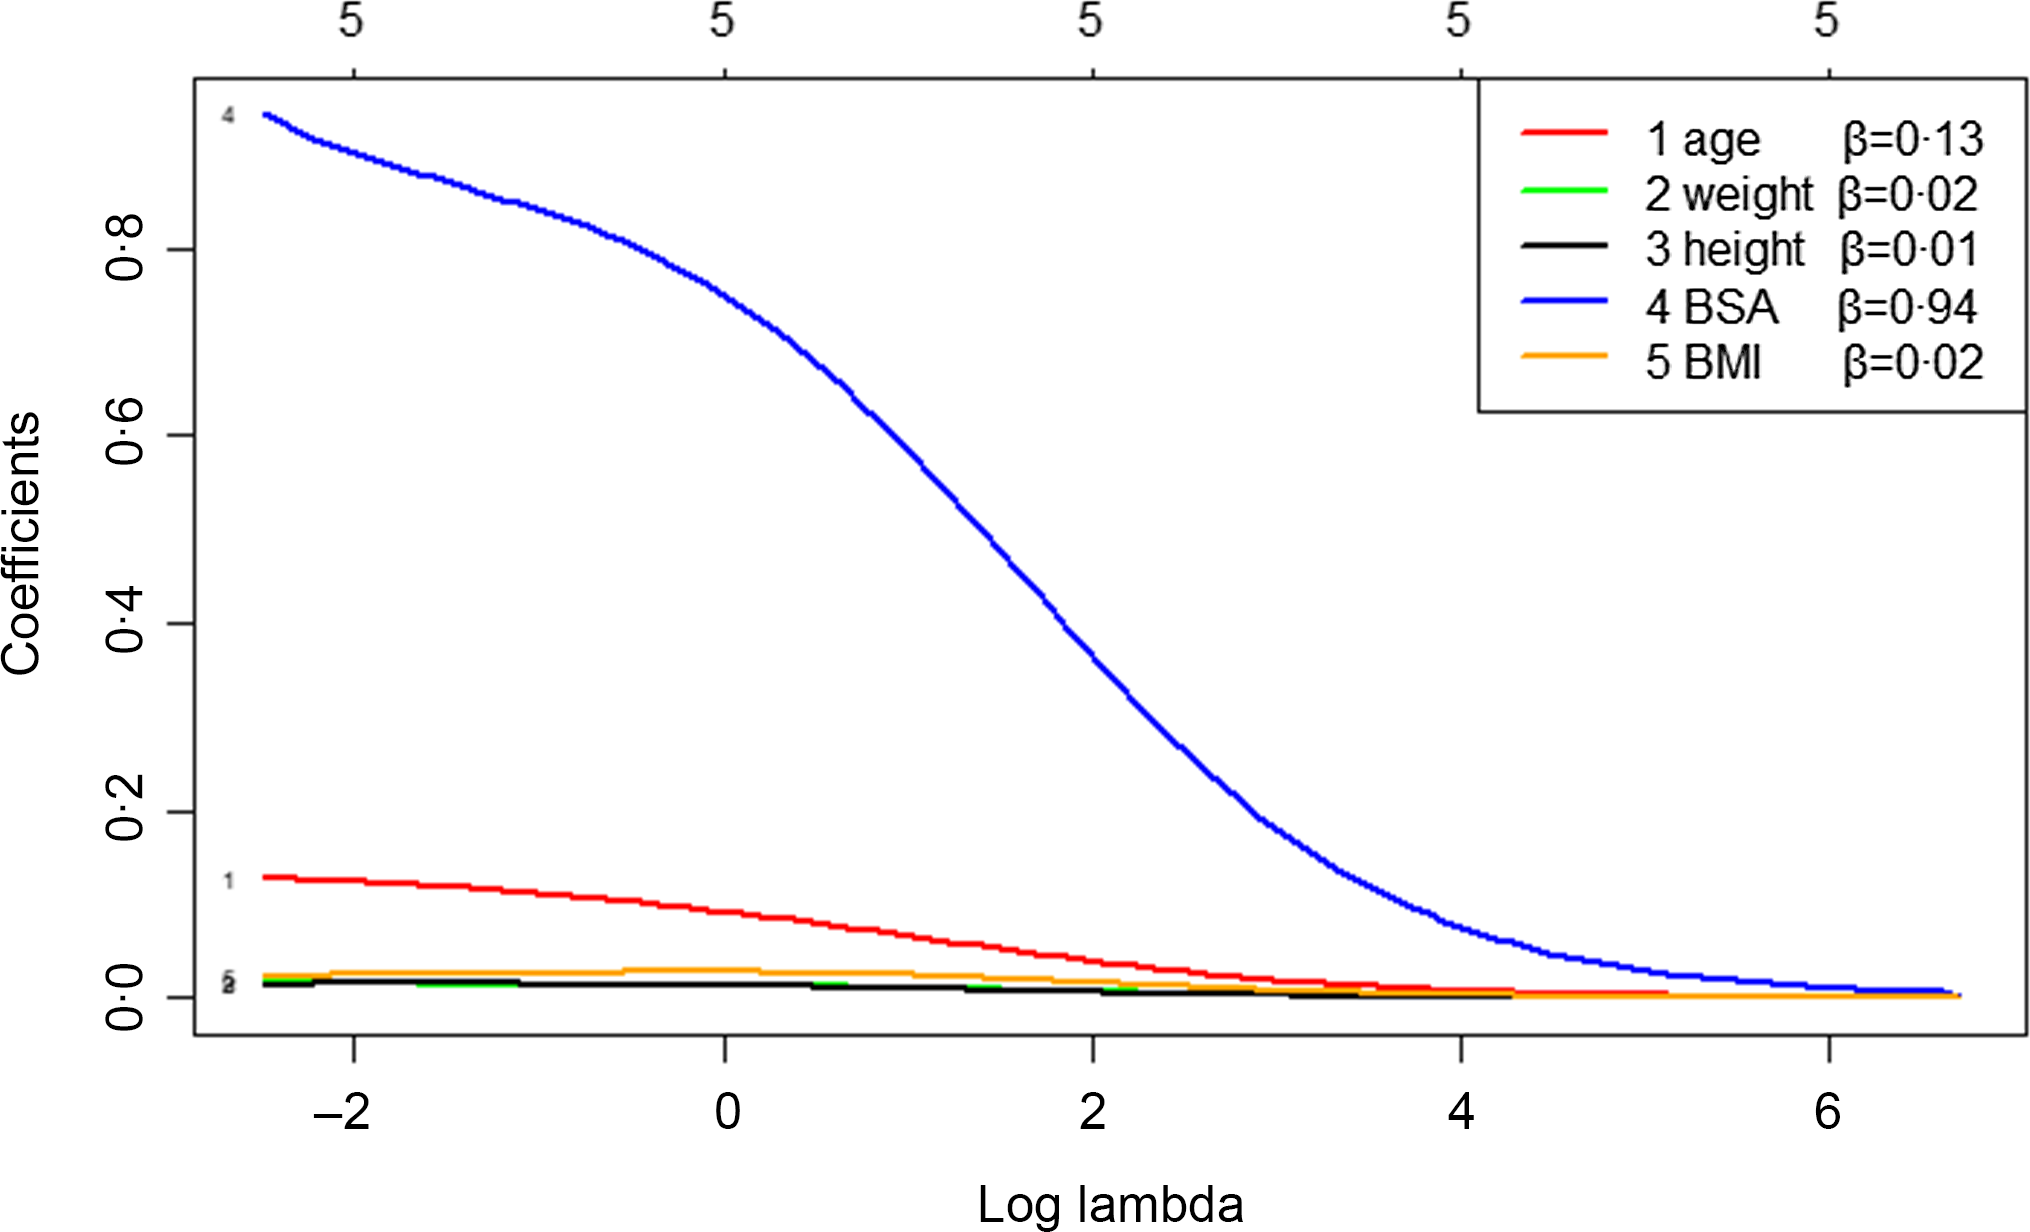
Fig. 2. Ridge trace – analysis of factors influencing thyroid volume (TVOL) based on ridge regression. It can be seen from Fig. 2 that height, weight and BMI fluctuated very little and were relatively stable, so they have little influence on TVOL and should be eliminated. The variables screened out by ridge regression were BSA and age, which have relatively large fluctuation, and the regression coefficients were 0·94 and 0·13, respectively. The five in the topmost means that there are five independent variables. BSA, body surface area.
Analysis of influencing factors under different quantiles of thyroid volume
Based on the results of the ridge regression, BSA and age were incorporated into the quantile regression. Figure 3 showed that age and BSA had a significant influence on the whole TVOL distribution. Compared with age, BSA had a larger regression coefficient and had a more significant influence on the median TVOL and the ninety-seventh quantile. The ninety-seventh quantile regression showed that the coefficient of BSA and age were 5·16 (P < 0·001) and 0·15 (P < 0·05), respectively. Supplementary Table 2 showed the regression results of the median and ninety-seventh quantiles.

Fig. 3. Analysis of influencing factors under different quantiles of thyroid volume (TVOL). The black dotted line represents the regression coefficient of the influence of each variable on TVOL under different quantiles, and the grey area is the 95 % CI of the coefficient. The solid red line represents the estimated value of each coefficient in the mean reversion model, and the dashed red line represents the 95 % CI of the coefficient in the mean reversion model. BSA, body surface area.
Establishment of reference values of thyroid volume
Considering that both age and BSA had a significant influence on TVOL, the reference values of TVOL of different genders were established based on age (Table 3) and BSA (Table 4) in this study. According to new standards and international standards(Reference Zimmermann, Hess and Molinari29), the TGR of different age groups was calculated. It can be seen that the TGR calculated according to international standards was much higher than new standards, and the difference was statistically significant (P < 0·001).
Table 3. Median and ninety-seventh percentile values for thyroid volume (TVOL) according to age in children

TGR, thyroid goitre rate.
According to the international standards (Zimmerman et al. 2004), the TGR of children aged 6, 7, 8, 9, 10, 11 and 12 were 16·29 %, 12·77 %, 10·30 %, 10·95 %, 11·91 %, 10·90 %, 8·36 %, respectively.
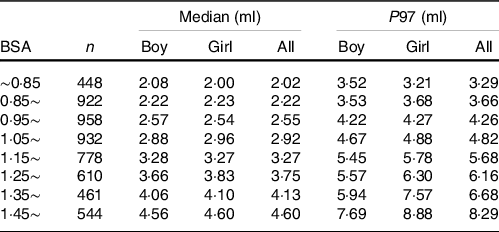
Table 4. Median and ninety-seventh percentile values for thyroid volume (TVOL) according to body surface area (BSA) in children
The relationship between median of urinary iodine concentration and thyroid goitre rate
According to the newly established TVOL reference values (by age and BSA) in this study, the TGR of children in each survey site was calculated. Because the MUIC of each survey site was between 100 and 299 μg/l, all the TGR were below 5 %. As we can see from the Fig. 4, the end of the fitting curve showed a slight upward trend. That is, with the increase of MUIC, especially above 250 μg/l, TGR tended to increase (Fig. 4(a)). The TGR calculated by BSA showed a trend of first decreasing and then increasing (Fig. 4(b)).

Fig. 4. The relationship between MUIC and TGR. According to the newly established TVOL reference values (by age and BSA) in this study, we got whether each child has goitre or not, and the TGR (age and BSA) in different survey points can be calculated. As we can see from the Fig. 4, the end of the fitting curve showed a slight upward trend. That is, with the increase of MUIC, especially above 250 μg/l, TGR calculated by age tends to increase (Fig. 4(a)). The TGR calculated by BSA showed a trend of first decreasing and then increasing (Fig. 4(b)). MUIC, median of urinary iodine concentration; TGR, thyroid goitre rate; TVOL, thyroid volume; BSA, body surface area.
Discussion
Since the implementation of the salt iodisation strategy in China, iodine deficiency has been almost eliminated(Reference Liu, Liu and Li16,Reference Wang, Zhang and Ge30) . To continuously understand the iodine status of residents, iodine deficiency disorders are still being monitored(Reference Zhao and Chen31). As a main monitoring indicator, the accuracy of detection and measurement of TVOL and the diagnosis of goitre will directly affect the TGR, and it is particularly important to establish reference values for TVOL(Reference Wu, Li and Luo32). Although school-age children are the recommended population to establish the reference values for TVOL, it is still very difficult. Which indicator is the most reliable indicator taken as the ‘gold standard’ for evaluating TVOL is controversial(Reference Zimmermann, Hess and Molinari29,Reference Fuse, Saito and Tsuchiya33) . In 1990, 300 children were surveyed and examined for TVOL in Japan to establish the reference values. As a result, because the correlation coefficient between height and TVOL was higher than that of other factors, such as age, weight, and BSA, the reference values for TVOL based on height were established(Reference Ueda34). In 2007, WHO/UNICEF/ICCIDD established the reference values for TVOL based on age and BSA for children aged 6–12 years according to different genders(35). A study in Iran showed that the reference values for TVOL based on weight were consistent with BSA(Reference Azizi, Delshad and Mehrabi36). Therefore, choosing indicators for establishing reference values for TVOL needs further research.
Selecting suitable subjects is essential for the establishment of reference values. For the establishment of TVOL reference values, the population required is iodine-sufficient people. In addition, the 97th quantile was defined as the upper limit of the reference values of TVOL(Reference Fuse, Saito and Tsuchiya33). In this study, children aged 6–12 years in four provinces of China were investigated, and the MUIC in all survey sites were between 100 and 299 μg/l. Zimmermann’s research showed that there was no significant change in TG or antithyroid Abs of children whose UIC was in the range of 100–199 μg/l and 200–299 μg/l, and UIC at 200–299 μg/l did not cause thyroid dysfunction(Reference Zimmermann, Aeberli and Andersson37). UNICEF also suggested that the normal iodine intake of school-age children could be expanded to 100–299 μg/l(38). Therefore, all the investigation sites in our study were at suitable iodine levels, which met the requirements of the experimental design.
In this study, TVOL is positively correlated with age, height, weight, BSA and BMI, while there is still a problem that we should study which indexes are more suitable for establishing TVOL reference values. Quantile regression is a modeling method that is used to estimate the linear relationship between a set of predictive variables, x, and the quantiles of explanatory variables, y. In data with outliers, quantile regression is more robust and can be used for data with skewed distributions(Reference Xuan39). In this study, besides the overall distribution, we pay more attention to the influence of variables on the 97th percentile of TVOL. However, the formula for calculating BSA contained height and weight, so there were serious multicollinearity problems in variables. The ridge regression was first used. The results of ridge regression showed that age and BSA had a great influence on TVOL, whereas other variables had little effect. The R2 of this model was only 0·44, which indicated that only 44 % of TVOL changes were due to changes in age and BSA. Mo’s study(Reference Mo, Lou and Mao40) also obtained a similar result, which used multiple linear regression to analyze the factors affecting TVOL. The results showed that only age and BSA entered into the equation, and the R2 was 0·39. Therefore, changes in TVOL can be explained by other factors, such as genetic differences which induce growth and development. A study(Reference García-Ascaso, Ares Segura and Ros Pérez41) showed that the reference values of TVOL in the Netherlands were higher than that in other countries, possibly because its average height was higher than that in other countries (height is influenced by genetic factors). In addition, different eating habits may also affect TVOL. According to Zimmermann’s study, the TVOL of children in Japan was larger than that in other countries, which may be related to Japanese preference for iodine-rich foods such as seaweed(Reference Zimmermann, Hess and Molinari29,Reference Zava and Zava42) .
The variables screened by ridge regression were incorporated into the quantile regression model, and the results showed that age and BSA had a great influence on the overall distribution of TVOL, which was slightly different from Professor Zhang’s research on the reference values for TVOL in children aged 8–13 years(Reference Chen, Zhang and Wu10). Professor Zhang’s research showed that BSA had a strong influence on the overall distribution of TVOL, whereas age was only a strong predictor of the median TVOL, not a predictor of the 97th percentile, which may be related to different sample sizes and ages. In this study, the reference values of TVOL were established based on age and BSA, which was consistent with the results of Zou(Reference Zou, Ding and Lou8) and Zimmermann(Reference Zimmermann, Hess and Molinari29). Similarly, many countries in the world have also established reference values of TVOL based on age and BSA, such as Iran(Reference Azizi, Delshad and Mehrabi36), Malaysia(Reference Foo, Zulfiqar and Nafikudin43), Turkey(Reference Darcan, Unak and Yalman44) and Poland(Reference Szybiński, Trofimiuk-Müldner and Buziak-Bereza45). BSA combines height and weight, which is the best single predictor of TVOL(Reference Xu, Sullivan and Houston46). Age is convenient for the diagnosis of goitre in practical operation and can indirectly reflect height and weight.
Different from previous studies, the reference values for TVOL of children aged 6–12 years old in iodine adequate areas in this study was lower than that in a study of Poland(Reference Szybiński, Trofimiuk-Müldner and Buziak-Bereza45), but slightly higher than that of China in 2007(11). Similarly, it was also higher than the study of Zimmermann MB, which may be because the population in their study mainly came from North America, South America, Central Europe, the Eastern Mediterranean, Africa, and the Western Pacific(Reference Zimmermann, Hess and Molinari29), physiological differences between different races or iodine content in nature in different areas may also affect TVOL(Reference Mo, Lou and Mao40). Japan, for example, has always been regarded as an iodine-rich country with no iodine fortification(Reference Fuse, Ito, Shishiba and Irie47). In addition, differentiated public health policies in various countries will also affect TVOL. After iodine nutrition improvement, the TVOL or the TGR of children in a certain area may not change immediately, and the decrease of TGR will lag for a while(Reference Gorstein, Bagriansky and Pearce48). The Chinese government began to implement USI in 1995, and in 2005, iodine deficiency disorder was eliminated at the national level. The results of Liu’s study showed that from 2002 to 2019, with the extension of the implementation time of USI, the TVOL of children has a certain downward trend(Reference Liu, Liu and Li16). A study in Opoczno district (central Poland) showed that in 1994, the TGR of children in this area was 66·6 %, and the MUIC was 45·5 μg/l. After USI was enforced by the Polish government in 1997, the TGR was 9·7 % in 1999, and iodine deficiency was mild. By 2010, the TGR in this area has dropped to below 5 %(Reference Zygmunt, Adamczewski and Wojciechowska-Durczynska49). Therefore, each region or country should establish its own TVOL standard and update it in time(Reference Zimmermann, Hess and Molinari29).
The current study was a large-scale cross-sectional survey, with a wide range of large number of people and good representativeness. In addition, ridge regression and quantile regression were used in this study, which avoids the influence of multicollinearity between independent variables in the equation and makes the quantile regression model more realistic and stable, with more practical application value. However, this research still has some limitations. For example, this research did not measure thyroid function because collecting blood samples from children is traumatic and will be restricted by ethics committees and parents. However, in the current study, children with abnormal B-ultrasound echo were excluded. Furthermore, according to Liu’s study Reference Liu, Qian and Sun50 , the TVOL of 360 normal children was not significantly different from that of all children (including forty-eight children with abnormal thyroid). Therefore, including children with abnormal thyroid function and thyroid antibody may have no influence on the establishment of TVOL.
Conclusions
The MUIC of children in areas with adequate iodine supplementation has reached a suitable level. The TVOL of children aged 6–12 years in China was mainly influenced by age and BSA, and the reference values for TVOL have been established based on age or BSA in China.
Acknowledgements
We are very grateful to the centers for disease control and prevention of the Anhui, Zhejiang, Gansu and Heilongjiang provinces for their strong support. We are also very appreciate to all the teachers and children who participated in the study.
F. G. M. conceived and designed this research. S. L. A., W. D. L., X. F. W., Y. L. W., X. X., G. M. M., X. N. Z. and F. G. M. conducted the field work. M. L., L. C. L. and X. T. C. participated in data analysis. F. G. M., P. L. and S. L. A. wrote the draft of this paper. F. G. M. had primary responsibility for final content. All authors read and approved the final manuscript.
This study was supported by the Heilongjiang Postdoctoral Scientific Research Development Fund (LBH-Q20116).
All authors have no conflicts of interest.
Supplementary material
For supplementary material/s referred to in this article, please visit https://doi.org/10.1017/S0007114522002070


