The negative health effects of trans-fatty acid (TFA) consumption are well established; the strongest evidence shows an increased risks for the development of CVD(Reference de Souza, Mente and Maroleanu1–Reference Stender5), which are the most frequent cause of death globally, and account for more than 40 % of all deaths in Europe(Reference Townsend, Nichols and Scarborough6). It is estimated that average daily intake of 5 g of TFA for an adult person is associated with about 20 % increased risk of heart disease(Reference de Souza, Mente and Maroleanu1).
Because some TFA are produced by the bacteria in the rumen – meat, milk and dairy products of ruminants naturally contain small amounts of TFA(Reference MacGibbon, Taylor, Fox and McSweeney7), while much higher levels can be found in processed foods produced using partially hydrogenated vegetable oils (PHO). Various health authorities have recommended that the intake of TFA should be as low as possible, within the context of a nutritionally adequate diet(8,Reference Uauy, Aro and Clarke9) . The REPLACE action plan was recently launched by the WHO, with the goal of eliminating industrially produced TFA (i-TFA) from the global food supply by 2023(10,Reference Ghebreyesus and Frieden11) . Currently, different countries use various approaches to minimise the content of i-TFA in the food supply – for example, labelling policies, regulatory limits of i-TFA content or restrictions of the PHO use in food production(Reference Zuchowska-Grzywacz and Kowalska12–Reference L’Abbé, Stender and Skeaff15). Regular monitoring of the food supply is needed in order to evaluate the efficacy of those policies and to enable updated assessments of the TFA-related public health risks. The presence of TFA in food supply is therefore regularly monitored in different countries(Reference Franco-Arellano, Arcand and Kim16–Reference Stender29).
Until 2019, the upper limit of TFA levels or the use of PHO in foods in Slovenia was not regulated, but there was an European Union (EU) labelling policy in place requiring that the presence (but not quantity) of PHO was mentioned in the ingredient list, although this rule was applicable only for processed pre-packed foods(30). According to this regulation, ingredient list in all pre-packed foods manufactured using hydrogenated fats need to specify the use either ‘partially hydrogenated’ or ‘fully hydrogenated’ fats (only first are potential source of TFA), while non-specific term ‘hydrogenated fat’ is not allowed. However, in contrast to some other countries, in Slovenia (as well as in other EU countries), the amount of TFA is not labelled on food packaging.
In 2013, Slovenia was highlighted as one of the EU countries, where many PHO-containing foods were still widely available, at least in certain food categories. In the cross-sectional study covering several European countries, Stender et al. reported high contents of TFA in pre-packed biscuits, cakes and wafers sampled on the Slovenian market(Reference Stender, Astrup and Dyerberg31). In another study, worrisome trends showed that from 2012 to 2014, the availability of PHO-containing biscuits increased even further(Reference Stender, Astrup and Dyerberg32). Very recently, Stender et al. published a follow-up study conducted in 2018, in which biscuits still contained a considerable amount of i-TFA(Reference Stender29). Similar patterns were also observed in several other Central–Eastern Europe countries. In relation to this, it should be noted that in Slovenia, CVD are a cause of 38 % of all deaths and are associated with 10 % of the total health care costs(Reference Buzeti, Beznec and Halozan33).
Based on these facts, lowering the TFA levels in foods became a national public health priority(34) and a national research project ‘Trans Fats in Foods in Slovenia’ (TFFS) was funded so as to support further evidence-based policy decisions.
It should be mentioned that previous studies(Reference Stender, Astrup and Dyerberg31,Reference Stender, Astrup and Dyerberg32) focused solely on foods manufactured with PHO as identified from their food labels (PHO mentioned in the ingredient list). As it cannot be guaranteed that food manufacturers are not using PHO without declaring this on food labels, it was decided that the surveillance of the TFA in the food supply was also to be conducted on foods without labelled use of PHO, particularly for the food categories where such use could be expected. Similar approach was also used for non-pre-packed foods, where food labelling is not mandatory and manufacturers are not required to disclose food ingredients (with exception of allergens).
A variety of approaches are used in food supply surveillance studies to achieve representativeness of the collected data. Typical approach is to include the highest possible proportion of the food market(Reference Dunford, Webster and Metzler35). However, because of the market share differences, foods available in the food supply can have very different effects on public health, even within very narrow food categories. For example, if ten different margarines are present on the market, and one of those is very high in TFA (i.e. manufactured using PHO), overall public health risks are much larger if such margarine is a market-leading product with very high market share. Such differences are typically not compensated for due to the lack of data(Reference Dunford, Webster and Metzler35), and equal importance of all products is assumed. In practice, this is not a realistic scenario. An innovative approach was used in the UK by Mhurchu et al., although for the assessment of the Na content in processed foods(Reference Mhurchu, Capelin and Dunford36). Their starting point was a data set of foods, reported within 12 months using a commercial consumer panel. Another strategy to compensate market share differences is sale-weighting, which was already used for the assessment of the use of PHO in pre-packed foods in Slovenia(Reference Zupanič, Hribar and Pivk Kupirovič37). Yearly nationwide market share data were provided by major food retailers, enabling weighting the importance of each food product in the data set. In this particular study, such an approach was adapted for the surveillance based on the results of laboratory analyses, which can be done only on a limited number of foods. In contrast, original sale-weighting approach(Reference Zupanič, Hribar and Pivk Kupirovič37) was conducted on very large data set compiled from thousands of foods, for which food labelling data on the presence of PHO were available. The above-mentioned assessment of the PHO use in pre-packed foods in Slovenia(Reference Zupanič, Hribar and Pivk Kupirovič37), which was conducted as the first phase of the TFFS project, identified pre-packed food categories of concern due to use of PHO(Reference Zupanič, Hribar and Pivk Kupirovič37).
Main objective of the herein reported study (conducted as the second phase of the TFFS project) was to determine the TFA levels in selected categories of pre-packed and non-pre-packed foods, which might present a notable dietary source of TFA. Our aim was to assess the TFA levels in foods with or without labelled content of PHO. Our hypothesis was that foods labelled to contain PHO had higher TFA levels in comparison with those where the ingredient list did not list PHO. The second objective of this study was also to determine the proportion of foods with higher levels of TFA. This assessment was done using a regulatory limit of 2 g of TFA per 100 g of total fatty acids, which will be enforced in the EU from the 1 April 2021(38). To collect the most reliable data for the exposure assessment and related food policy decisions, the study was conducted employing stratified food sampling directly from the food supply followed by the laboratory analyses of the foods. A sales-weighting approach was used to estimate the TFA levels in selected categories of pre-packed foods, accounting for different market shares of the sampled foods. To our knowledge, this is the first study in which the sales-weighting approach was used to investigate the content of TFA in the food supply.
Methods
Sampling of foods
Considering that thousands of foods are available in the Slovenian food supply and that the content of TFA is not part of mandatory food labelling, analysing all of them would not be a feasible option. A limited number of samples in selected food categories were therefore collected for the current study.
Pre-packed foods
We used a stratified sampling approach in order to estimate the TFA levels in the pre-packed foods. The starting point was a database with a representative sample of pre-packed foods in the Slovenian food supply, established within the first stage of the TFFS project(Reference Zupanič, Hribar and Pivk Kupirovič37). We focused on food categories with reported use of PHO, namely biscuits, cakes, chocolate and sweets, crisps and snacks, bread, vegetable cream substitutes, ice creams, margarine, spreads, soups, breakfast cereals, desserts and pizzas(Reference Zupanič, Hribar and Pivk Kupirovič37). Randomisation was used to select foods for laboratory analyses, separately for each selected food category, and separately for foods with or without declared PHO. To assure selection of most relevant samples, we employed weighted randomisation using market share data. Each product in the database was assigned with a random number (0–1), which was then multiplied with a within-the-category market share (sales-weighting factor), resulting in a weighted random number. In practice, this meant that if one product had two-fold higher market share than the other, it had for the same factor higher chance of being selected for sampling. In this way, we were able to ensure a non-biased sample selection with a preference for market-leading brands, which contributed more to the overall consumption. The same approach was used for all of the selected food categories, except for margarine, where all of the available brands were sampled, as described previously(Reference Abramovic, Vidrih and Zlatic23). After randomisation, the researchers visited food stores in Ljubljana and purchased the products that had been selected for sampling. In case if they were unable to find a matching food product, similar product was purchased (i.e. another food within the same category, which was (not) labelled to contain PHO, preferably of the same manufacturer). Our goal was to purchase at least ten samples per category (at least five with and five without labelled PHO), with more samples in the categories of major concern. Considering that in some food categories (breakfast cereals, desserts and pizzas), we were not able to find any matching PHO-containing foods in the food stores, these food categories were excluded from the sampling, meaning that in these categories, we also did not sample foods without the labelled use of PHO. It should be explained that our food supply database was compiled in 2015, while the food sampling was possible only after the data analyses had been completed. It turned out that some food producers removed PHO from the foods between the database formation (in 2015) and food sampling (2016). Over 200 (n 207) pre-packed food products were sent for the laboratory analyses, of which 125 were without labelled PHO and eighty-two were with labelled PHO in the ingredient list (further on, also called PHO-containing foods).
Non-pre-packed foods
In addition to the pre-packed foods, we were also interested in specific types of non-pre-packed foods, which might present a notable source of TFA, considering the ingredients and/or previous reports. We focused on croissants (n 27); burek (traditional cheese pastry in some Central–Eastern Europe and Balkan countries, which is also available in Slovenia; n 19); hamburger (n 12), which could be produced with the use of PHO; fried potato (n 13) and wiener schnitzel (n 4), due to the reported use of TFA-containing PHO in frying processes(Reference Stender, Dyerberg and Astrup39). Considering that no labelling is required for those foods, we were not able to stratify the sampling for the use of PHO. Also, non-pre-packed foods were not included in our database, meaning that we were unable to use the same randomisation approach as for the pre-packed foods. Convenience sampling was therefore used. In order to ensure appropriate selection of samples, our approach was to purchase these foods at suppliers located close to the predefined geographical points. We selected four geolocations (two in Ljubljana, one in Maribor and one in Nova Gorica) that were visited by researchers in order to find the nearest suppliers of the selected foods. In some of the locations, more suppliers were present and several comparable foods were sampled. All in all, we purchased seventy-five non-pre-packed foods.
Altogether, 282 pre-packed and non-pre-packed foods were analysed. The researchers purchased foods as regular customers and delivered them to the laboratory, where the appropriate storage was ensured until the conduction of the analyses.
Content of trans-fatty acids
Content of trans-fatty acids
To enable the assessment of the content of TFA for the selected food categories, all selected samples were subject to chemical analyses. For each sample, the TFA levels were determined in three replicates, using a standard in situ transesterification and GLC method, as previously described(Reference Abramovic, Vidrih and Zlatic23). The TFA were quantified using the response factor and the factor of transformation of the FA content from the fatty acid methyl esters content. The category averages and sd were provided.
Sales-weighted content of trans-fatty acids
Sales-weighting was used for better estimates of the TFA contents in the pre-packed foods labelled either as ‘contain’ or does ‘not contain PHO’. Weighting was conducted within the categories only, separately for the groups that contained and the groups that did not contain PHO. Previously described nationwide 12-month-sales data were used(Reference Zupanič, Hribar and Pivk Kupirovič37). For each food category, we calculated the total amount of yearly sale (in kg) for all sampled foods and (using analytically determined TFA levels in each sample) the total amount of TFA (in kg) present in those products. For easier comparison, the resulting sales-weighted content of TFA is provided in g/100 g of food. While we had access to the market share data for the majority of the sampled foods, the data were missing for thirty-eight products (18 %). The reason for this was due to the fact that in case when we were not able to find preselected (randomised) sample in the food store for sampling, we sampled a comparable sample (for some of which market share data were not available). In such cases, a category average yearly sale was assigned to these foods.
Considering our sampling approach, such sales-weighting is an appropriate method for the assessment of the TFA levels in foods that do or do not contain PHO, but not for the estimation of the content of TFA in the whole food category. This is because (giving our sampling approach) the products containing PHO were overrepresented in our sample compared with the entire market. To compensate for this difference, the whole market estimation of the content of TFA (g/100 g of food) was calculated using previously reported(Reference Zupanič, Hribar and Pivk Kupirovič37) sale-weighted proportions of PHO-containing products per food category (XPHO: biscuits: 24 %; cakes: 2·9 %; chocolate and sweets: 1·1 %; crisps and snacks: 4·1 %; bread: 9·3 %; vegetable cream substitutes: 45 %; ice cream: 19 %; spreads: 5·0 %; soups: 6·2 %). For example, while the market share of crisps and snacks containing PHO was quite low, in our study, eight out of seventeen samples (47 %) had labelled PHO in the ingredient list. Therefore, whole market estimation of the content of TFA for each food category was calculated using the formula: γ TOTAL [g TFA/100 g of food] = XPHO × γ PHO + (1 – XPHO) × γ NON-PHO, where γ PHO and γ NON-PHO are sale-weighted contents (g/100 g food) of TFA in samples with the labelled presence of PHO, and those without the labelled presence of PHO, respectively. This approach was used for all of the categories of pre-packed foods, except for margarine, where weighting was not needed, because we sampled all of the margarines that were available on the market (details provided in the literature(Reference Abramovic, Vidrih and Zlatic23)).
Proportion of samples with higher content of trans-fatty acids
Proportion of samples with higher content of TFA was calculated for the selected food categories, and separately for samples with and without the labelled presence of PHO. Criteria for ‘higher TFA content’ were set at a regulatory limit(40) of 2 g of TFA per 100 g of total fats in the foods, which was introduced after the sampling for this study had been performed. Previously described adjustment for market share was used to calculate sales-weighted proportion of samples with higher TFA content – separately for samples with and without the labelled presence of PHO.
Data processing and statistical analyses
The data were processed and analysed using Microsoft Excel 2016); XLSTAT statistical and data analysis solution 2019 (Addinsoft); and GraphPad Prism version 8.2.1 (GraphPad Software), which was also used for the graphical presentation of the results.
To test our hypothesis that foods labelled to contain PHO have higher TFA levels, we conducted a statistical comparison of the TFA between the groups of samples, where (a) PHO were mentioned in the ingredient list, and (b) where no PHO were included. Considering the availability of the food labelling data, this comparison was made for pre-packed foods only. The effect of the presence of PHO and the product category on the content of TFA was evaluated using two-way ANOVA. Differences in the TFA content between the PHO groups and food categories were analysed using Fisher’s LSD post hoc test.
Results and discussion
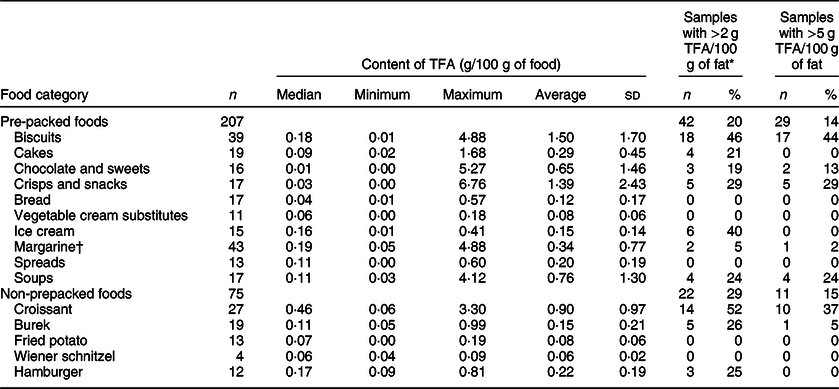
Out of the 282 sampled foods, 207 (73 %) were pre-packed foods (Table 1). Altogether, 134 (65 %) of pre-packed foods had very low TFA levels (<0·2 g/100 g of food), 28 samples (14 %) had over 1 g and 28 samples (14 %) had over 2 g of TFA per 100 g of food. All of the latter samples had PHO content declared in the ingredient list. The highest observed TFA level was 6·76 g/100 g of food. While estimation of the TFA content in grams per 100 g of food is crucial for assessments of population exposure and related public health risks, a common regulatory approach is to limit the content of TFA as a percentage (%) of fat (equivalent to g of TFA per 100 g of total fatty acids) in foods. Employing the EU regulatory limit (2 g TFA/100 g of total fat)(38), 64 samples (22 %) contained higher TFA levels, 42 of those were pre-packed foods (20 % of sampled pre-packed foods). Except for the two ice cream samples, all of them had PHO content declared in the ingredient list.
Table 1 Content of trans-fatty acids (TFA per 100 g of food) in the analysed samples of the selected food categories, and proportion of samples with higher TFA levels

* Proportion of samples exceeding 2 g of total TFA per 100 g of fat. Criteria for ‘higher TFA content’ were set at EU regulatory limit at 2 g of industrial TFA per 100 g of total fats (not implemented at the time of sampling).
† For margarine, we used previously reported results(Reference Abramovic, Vidrih and Zlatic23); TFA levels were originally expressed in g per 100 g of fats and recalculated to g per 100 g of food.
A considerable variability was observed in the TFA content in biscuits, ranging up to 4·88 g/100 g of food within the PHO-containing samples, with an average TFA level of 2·20 ± 1·68 g/100 g of food (Table 2). Previous research also identified biscuits as a critical food category(Reference Stender29,Reference Stender, Astrup and Dyerberg31,Reference Stender, Astrup and Dyerberg32) , with 44·8 % of the products on the market containing PHO(Reference Zupanič, Hribar and Pivk Kupirovič37); therefore, a higher number of foods were sampled in this category (n 39; 26 and 13 with/without PHO presence, respectively; Table 1). About 65 % (n 17) of the PHO-containing samples contained over 2 g TFA per 100 g. Interestingly, Stender et al.(Reference Stender, Astrup and Dyerberg32) reported that in years 2012/2014, some biscuits contained even higher TFA levels (up to 9 g of TFA/100 g of food). It should be noted that their study focused on biscuits with a labelled presence of PHO only, enabling them to collect all of the available samples. On the other hand, we used a randomised sample collection of foods with/without labelled PHO; therefore, the range of TFA content is applicable for the selected samples and does not necessarily cover the extreme cases available on the market. Altogether, 69 % (n 18) of the biscuits manufactured with PHO exceeded EU regulatory TFA limit.
Table 2 Content of trans-fatty acids (TFA) in the analysed pre-packed foods with/without labelled presence of partially hydrogenated vegetable oils (PHO)
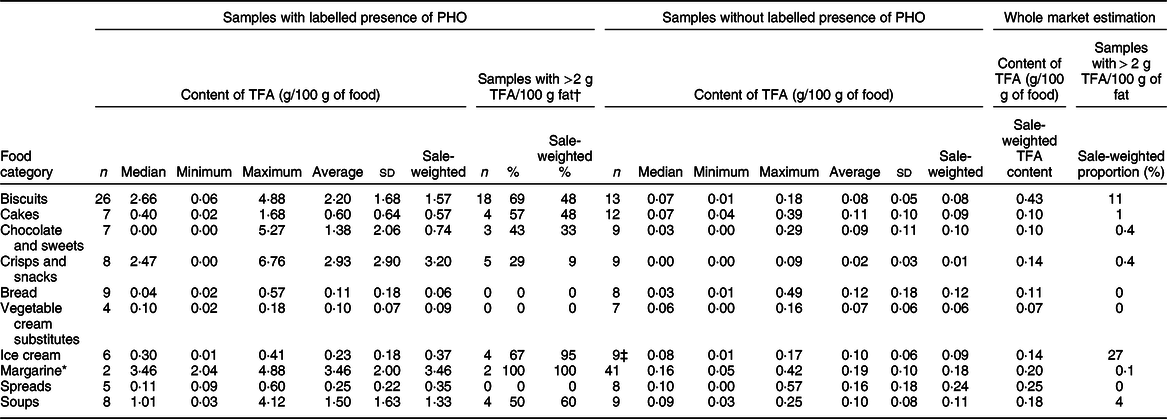
* For margarine, we used previously reported results(Reference Abramovic, Vidrih and Zlatic23); TFA levels were originally expressed in g per 100 g of fats and recalculated to g per 100 g of food.
† Proportion of samples exceeding 2 g of total TFA per 100 g of fat. Criteria for ‘higher TFA content’ were set at EU regulatory limit at 2 g of industrial TFA per 100 g of total fats (not implemented at the time of sampling).
‡ Two (22 %) ice cream samples without labelled PHO contained more than 2 g TFA/100 g fat (sale-weighted proportion: 12 %).
Considering the biscuit samples without declared PHO, the TFA levels were only up to 0·18 g/100 g of food with an average of 0·08 ± 0·05 g/100 g of food, which is significantly lower compared with the PHO-containing samples (Fig. 1; P < 0·0001). We can assume that the producers were not using PHO in the manufacturing of those products, meaning that the food labelling data were in line with the regulatory requirements. Furthermore, all biscuit samples without declared PHO were also within EU regulatory TFA limit. Nevertheless, among all of the sampled categories of pre-packed foods, biscuits were identified as having the highest weighted whole market estimated content of TFA (0·43 g/100 g of food).
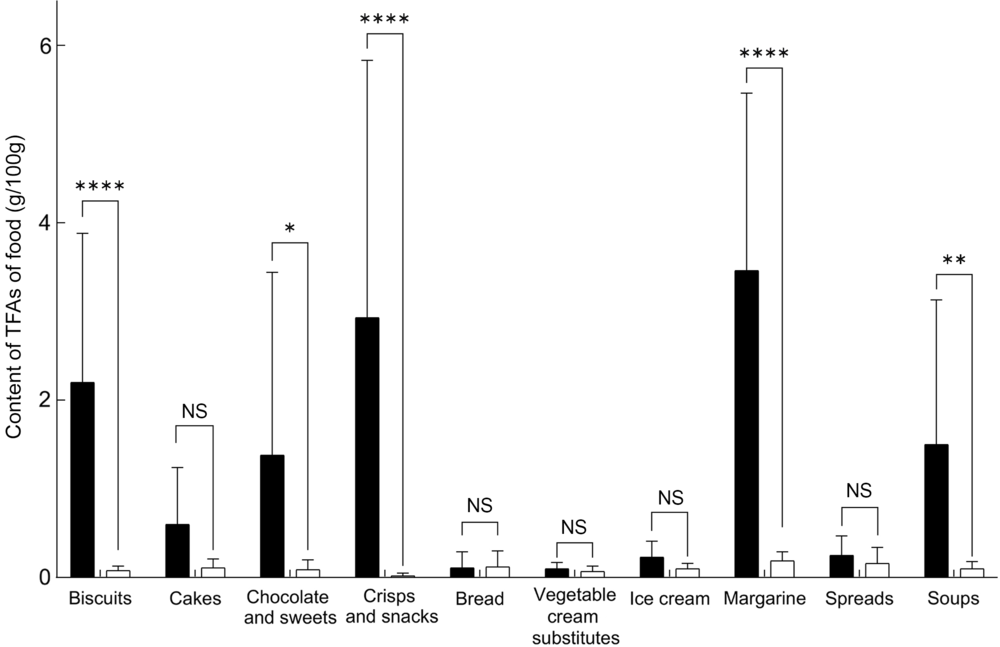
Fig. 1 Comparison of the content of trans-fatty acids (TFA) in pre-packed foods labelled to contain partially hydrogenated vegetable oils (PHO) (![]() ), and not labelled to contain PHO (
), and not labelled to contain PHO (![]() ); ****P < 0·0001; **P < 0·001; *P ≤ 0·01
); ****P < 0·0001; **P < 0·001; *P ≤ 0·01
Margarines are another very interesting category. Nowadays, margarines can be produced from vegetable fat that only underwent inter-esterification, while in the past, all margarines were produced exclusively with the partial hydrogenation(Reference Menaa, Menaa and Treton41). In 2015, Vučić et al. reported that in Serbia (another Central–Eastern Europe country), some margarines still contained PHO(Reference Vučić, Arsic and Petrovic27). On the other hand, our previous study showed that most margarines on the Slovenian market in 2016 were not labelled to contain PHO(Reference Zupanič, Hribar and Pivk Kupirovič37), but the question whether the labelling data were accurate remained unanswered. Therefore, the decision was made to specifically focus on margarines with in-depth assessment of all margarines in the food supply in year 2016(Reference Abramovic, Vidrih and Zlatic23). For this reason, the number of sampled margarines was higher in comparison with other categories, where randomised sampling was used. Altogether, forty-three margarines were sampled, but only two were labelled to contain PHO. Both samples contained significantly higher TFA levels (P < 0·001; 2·04 and 4·88 g/100 g margarine, respectively) in comparison with the margarines that were declared not to contain PHO (0·19 ± 0·10 g/100 g). These two were also the only margarine samples with TFA content higher than EU regulatory TFA limit. However, considering the low market share of PHO containing labelled margarines, the whole market estimated content of TFA in margarines (0·20 g/100 g of food) is comparable with the content of TFA in processed vegetable oils.
Other categories of pre-packed foods with significantly higher TFA levels in PHO containing labelled samples were crisps and snacks; chocolate and sweets; and soups, with average TFA levels of 2·93 ± 2·90, 1·38 ± 2·06 and 1·50 ± 1·63 g/100 g of food, respectively. The proportion of those samples with TFA levels higher than EU regulatory TFA limit was 29 %, 43 % and 50 %, respectively. TFA levels in samples without declared PHO in these categories were much lower, up to 0·39 g/100 g, and all were within the EU regulatory TFA limit. Furthermore, considering relatively low availability of PHO-containing foods, weighted whole market estimate of the content of TFA in these categories is notably lower than in biscuits (0·14; 0·10 and 0·18 g, respectively – in comparison with 0·43 g/100 g in biscuits; Table 2).
In cakes and ice creams, notably higher TFA levels were detected in samples containing PHO, but given the large sd the differences were not statistically significant (Fig. 1, P = 0·3; 0·8, respectively). The highest observed TFA levels were 1·68 and 0·41/100 g, respectively (Table 2). All these values were determined in PHO-containing foods. The majority of the samples containing PHO also exceeded EU regulatory TFA limit (57 % and 67 %, respectively). This regulatory limit was also exceeded by two samples of ice cream (22 %), which did not have labelled PHO in ingredient lists. Among all 125 analysed samples without PHO across all food categories, the EU regulatory TFA limit was exceeded only in these two ice cream samples.
Content of TFA in bread was mostly very low; no significant differences (P = 0·98) were observed in samples without labelled PHO in comparison to samples with labelled PHO. Highest observed TFA content was 0·57 g/100 g in bread, which was not labelled to contain PHO. This particular sample was topped with cheese, which naturally contain some TFA; therefore, the observation should not be interpreted as a non-labelled use of PHO. All analysed samples of bread had TFA levels below EU regulatory TFA limit.
In addition to pre-packed foods, we also sampled seventy-five non-pre-packed foods, which represented 27 % of the whole sample (Table 1). Almost 70 % (n 52) of those had TFA levels below 0·2 g/100 g of food, while in 9 (12 %), we found over 1 g of TFA/100 g of food – all of these being croissants. The highest average TFA levels were observed in croissants (0·90 ± 0·97 g/100 g), with up to 3·30 g TFA in extreme cases. With the ingestion of approximately 150 g of such croissants (corresponding to about 2–3 croissants), a consumer would have consumed 5 g of TFA. Under assumption that TFA in croissants were of industrial origin, more than half (n 14; 52 %) analysed croissants exceeded EU regulatory TFA limit. In burek and hamburger categories, the highest observed levels were up to 0·99 and 0·81 g/100 g, respectively, with considerably lower category averages (0·15 ± 0·21 and 0·22 ± 0·19, respectively). About quarter of analysed samples (26 % and 25 %, respectively) exceeded EU regulatory TFA limit. In the fried foods (fried potato and Wiener schnitzel), the TFA levels were below 0·2 g/100 g in all samples, indicating that producers were not using PHO in the frying process.
Reducing the risks for the development of CVD, the most common non-communicable disease in the Western world, would significantly contribute to public health. Removing i-TFA from the food supply presents an achievable dietary intervention in order to achieve this goal; therefore, the content of TFA in foods and their intake are of significant importance, not only for researchers but also for health care practitioners, policymakers and the food industry. The results of our study provide important insights into the content of TFA in various food groups. Estimates of the sales-weighted proportion of pre-packed foods with more than 2 % of TFA in fats (Table 2) highlight biscuits and ice cream as the most problematic categories of pre-packed foods (11 % and 27 %, respectively), while in other food categories, the proportion of foods with higher TFA levels is below 5 %. These observations confirm that approach of Stender et al.(Reference Stender28,Reference Stender29,Reference Stender, Astrup and Dyerberg31,Reference Stender, Astrup and Dyerberg32) to conduct international market basket investigations with focus of biscuits is very relevant.
Based on study results, the regulatory limit of TFA content in foods was introduced in Slovenia recently(40); the regulation has been fully enforced since April 2019, meaning that the results of the reported study will also be very valuable for monitoring the changes in the food supply after this regulatory intervention. Despite the Slovenian regulation being only national, it will most likely affect some neighbouring countries without such policies, particularly in the Balkan area. It should be noted that in addition to the national regulation, in April 2018, the European Commission also adopted an amendment of Regulation (EC) No. 1925/2006(38), regarding TFA in foods. This regulation will come into effect in April 2021 and will protect consumers across the whole EU. Both the national and EU regulations are limiting the amount of TFA in foods, while another possible approach – introduced in the USA and Canada – is to prohibit the use of PHO as a food ingredient. Considering that in our study high TFA levels were observed almost exclusively in the foods produced with the use of PHO, it seems that both regulatory approaches could be considered as appropriate strategies for assuring low i-TFA levels in foods.
The major strength of this study is the extensive database of products from the Slovenian food supply, which represented an excellent starting point for the sampling of pre-packed foods. This enabled insight into the content of TFA in the food supply, using a modest number of samples. However, the number of sampled foods is low in comparison with all products available on the market, which is an important study limitation. This limitation was dealt with not only by using a sophisticated randomisation and sampling method but also by employing a sales-weighting approach, providing further insights into the food supply. Using such an approach, we were able to separately focus on foods with or without PHO. The results of this study indicate that the selection of food categories with the highest proportion of labelled PHO-containing foods was appropriate, as we showed that the presence of PHO is a strong indicator for higher TFA levels. Our approach enabled us to use the available budget to test more samples in the more interesting food categories, without the use of resources for analyses of foods that are likely to have a lower contribution to the intake of TFA. Another limitation of the study was the lack of the market share data for 18 % of the samples. The missing data were handled by assigning within-category average sales for those products. The only other alternative would be to exclude such products, which would be, in our opinion, less appropriate. We should also mention that while regulatory limits are referring to i-TFA in foods, laboratory measurements provide the amount of total TFA in foods. As some foods contains butter, milk and other natural sources of TFA, the proportion of samples not meeting regulatory TFA limits could be a bit lower. This could have affected categories such as ice cream and croissants, but we should note that also in these categories, many samples contained much less TFA than 2 g/100 g of fat.
Conclusions
While a majority of the investigated samples had low levels of TFA, some foods still contained notable amounts of TFA. Study results showed that foods with listed PHO as an ingredient are usually higher in TFA as compared with foods not labelled to contain PHO. Particularly, this was the case in biscuits, chocolate and sweets, crisps and snacks, margarine and soups. These were also food categories, in which we found samples with the highest TFA levels. Overall, biscuits were identified as the most concerning category of pre-packed foods. The majority of biscuits with labelled PHO would exceed future EU regulatory TFA limit. Biscuits were also the food category with the highest whole market estimate (sales-weighted) TFA content. Among investigated non-pre-packed foods, only croissants contained considerable TFA levels, with about half of the samples exceeding EU regulatory TFA limit. Fried foods were not a notable source of TFA, indicating that PHO are not used in the frying process. The reported results indicate that because of the high TFA levels in some foods, specific populations (i.e. brand-loyal high consumers of those foods) can still increase their risk for CVD. While regulatory limit of 2 g TFA per 100 g of total fat does not guarantee total elimination of TFA from the food supply, it can be expected that new regulation will improve the situation considerably. Further studies are needed to investigate actual intakes of TFA in different population groups and the effect of the regulatory intervention to the content of TFA in foods.
Acknowledgements
Acknowledgements: The authors would like to thank the retailers for granting us access to their stores and sales data. We also acknowledge Matthias Schreiner (Department of Food Science and Technology, University of Natural Resources and Life Sciences, Austria) for support in the conduction of the study. We would also like to acknowledge the support of the collaborating students in the data collection. Financial support: The work was financially supported by the research programme ‘Nutrition and Public Health’ (P3-0395), funded by the Slovenian Research Agency, and by the research project ‘TFFS’ (L3-7538), funded by the Ministry of Health of the Republic of Slovenia, the Slovenian Research Agency, and Mercator d.d. The funding organisations had no role in the design, analysis or writing of this article. Conflicts of interest: There are no other potential conflicts of interest to declare. The authors would however like to acknowledge that I.P. has led/participated in various other research projects in the area of nutrition/public health/food technology which were (co)funded by the Slovenian Research Agency, the Ministry of Health of the Republic of Slovenia, the Ministry of Agriculture, Forestry and Food of the Republic of Slovenia, and in the case of specific applied research projects also by food businesses. Authorship: A.K., K.Ž. and I.P. performed the data analyses. I.P. drafted the first version of the manuscript. A.K., M.H., Ž.K., N.Z. and U.P.K. collaborated in the data collection and sampling. H.A., R.V., E.Z. D.K., S.P., M.M. and P.P. collaborated in the assessment of the TFA levels in food. H.H. performed the statistical analyses. A.K., H.A., R.V., U.B. and I.P. participated in the paper finalisation and discussion. I.P. was also responsible for assuring the set-up and funding of the study. Ethics of human subject participation: Not applicable.