


Introduction
Metabolic-associated fatty liver disease (MAFLD) is a condition of excessive accumulation of fat in the liver in combination with metabolic dysfunction presenting as overweight or obesity and insulin resistance.(Reference Badmus, Hillhouse, Anderson, Hinds and Stec1) MAFLD was proposed by an international panel in 2020 to replace the term ‘non-alcoholic fatty liver disease (NAFLD)’.(Reference Eslam, Newsome and Sarin2) The introduction of MAFLD helps overcome the limitations of NAFLD that coexistences of NAFLD with other liver diseases and arguments in the recommended limit of alcohol consumption.(Reference Choi, Brouwer and Zanjir3–Reference Liang, Chen and Liu5) Compared to NAFLD, the definition of MAFLD is more inclusive in the aetiology of fatty liver diseases and more practical to identify more patients at risk of liver disease progression.(Reference Lin, Huang and Wang6,Reference Yamamura, Eslam and Kawaguchi7) MAFLD affects more than a third of the global population, and the overall prevalence ranges from 32⋅94 to 44⋅95 %.(Reference Chan, Koh and Tang8) MAFLD has been one of the main reasons for hepatocellular carcinoma and cirrhosis, and also associated with an increased risk of cardiovascular diseases.(Reference Tian, Zhang and Xie9) Therefore, the prevention and treatment of MAFLD is important in the clinic.
Dietary intervention has been reported to play an important role in the management of MAFLD since there are no approved pharmacological treatment.(Reference Qu, Ma and Cai10,Reference Feng, Lin and Zhuo11) Evidence has shown that oxidative stress, insulin resistance, and lipid metabolism disturbances are associated with the progression of fatty liver diseases.(Reference Fathi, Alavinejad, Haidari and Amani12) Micronutrients, such as copper, zinc, iron, and selenium, are essential nutrients for human health and are involved in glucose, lipid, protein metabolism, and antioxidant processes.(Reference Barbara and Mindikoglu13,Reference Chen, Wu, Li, Wang and Tang14) Some studies have reported the association between micronutrients and NAFLD.(Reference Barbara and Mindikoglu13,Reference Chen, Wu, Li, Wang and Tang14) Chen et al. have found that hepatic copper concentration was lower in NAFLD patients.(Reference Chen, Wu, Li, Wang and Tang14) Fathi et al. have reported that zinc supplementation contributed to improve insulin resistance and oxidative stress status in NAFLD patients.(Reference Fathi, Alavinejad, Haidari and Amani12) Iron was found to be increased in NAFLD patients.(Reference Mayneris-Perxachs, Cardellini and Hoyles15) Wang et al. have found that serum selenium >130 μg/l was associated with the higher odds of NAFLD.(Reference Wang, Seo and Park16) Currently, there are no studies reporting the association between micronutrients and MAFLD.
Therefore, this study aims to explore the association between micronutrients and MAFLD using data from the National Health and Nutrition Examination Survey (NHANES).
Methods
Study design and data source
This was a cross-section study, and data were extracted from the NHANES 2017–2020, which was a nationally representative, complex, and multistage probability survey of the US civilian non-institutionalised population conducted by the National Center for Health Statistics.(Reference Paulose-Ram, Burt, Broitman and Ahluwalia17) Participants in the NHANES were interviewed at home and underwent standardised physical examinations at a mobile examination centre (MEC).(Reference Paulose-Ram, Burt, Broitman and Ahluwalia17) During the interview, self-reported information for demographics, socioeconomic status, health conditions, health behaviours, and routine healthcare sites were obtained.(Reference Paulose-Ram, Burt, Broitman and Ahluwalia17) The physical examinations consisted of medical, dental, and physiologic measurements, and laboratory tests administered by highly trained medical personnel.(Reference Paulose-Ram, Burt, Broitman and Ahluwalia17) The survey has been approved by the National Center for Health Statistics Ethics Review Board, and written informed consent has been provided by each participant.(Reference Paulose-Ram, Burt, Broitman and Ahluwalia17)
Study population
This study included participants aged ≥18 years old, with liver ultrasound transient elastography examination, and with two 24-h dietary recalls for micronutrients intake. Individuals with unusually low or high total energy intake (<500 or >5000 kcal/d for female, <500 or >8000 kcal/d for male)(Reference Liu, Qiao and Zhuang18) or missing data on key covariates were excluded.
Micronutrients
The dietary intake of copper, zinc, iron, and selenium was assessed by the 24-h dietary recall interview using the Agriculture Automated Multiple-Pass Method, which collected an accurate and detailed list of all foods and beverages consumed by a person within 24 h (midnight to midnight).(Reference Moshfegh, Rhodes and Baer19) Two 24-h dietary recall interviews were performed, with the first one performed in the MEC and the second one performed by telephone 3–10 d later.(Reference Gress, Mansoor and Rayyan20) In this study, we used the average value of the two 24-h dietary recall for the intakes of micronutrients (copper, zinc, iron, and selenium), and divided these micronutrients according to the quartile (Q).
The appropriate dietary weights were used for dietary data analyses. The participants in the NHANES database were selected based on a national probability design. To increase the number of participants for specific demographic groups, a multistage, unequal probability of selection design was implemented. When an analysis used the smaller sample with completed dietary data on Day 1 and Day 2, a set of adjusted weights (WTDR2DPP) was used. According to the content per 1000 kcal, copper intake was divided into Q1 (≤0⋅43 mg), Q2 (0⋅43–0⋅53 mg), Q3 (0⋅53–0⋅69 mg), and Q4 (>0⋅69 mg). Zinc intake was divided into Q1 (≤3⋅98 mg), Q2 (3⋅98–4⋅82 mg), Q3 (4⋅82–5⋅94 mg), and Q4 (>5⋅94 mg). Iron intake was divided into Q1 (≤5⋅19 mg), Q2 (5⋅19–6⋅19 mg), Q3 (6⋅19–7⋅57 mg), and Q4 (>7⋅57 mg). Selenium intake was divided into Q1 (≤43⋅09 mcg), Q2 (43⋅09–53⋅02 mcg), Q3 (53⋅02–64⋅31 mcg), and Q4 (>64⋅31 mcg).
MAFLD assessment
MAFLD was defined by the presence of hepatic steatosis on ultrasound transient elastography examination, and simultaneously accompanied by one of the following three criteria: (1) overweight/obesity, (2) type 2 diabetes mellitus (T2DM), or (3) metabolic dysregulation.(Reference Sun, Jin and Wang21)
-
Significant hepatic steatosis was defined by the controlled attenuation parameter (CAP) >248 dB/m.(Reference Karlas, Petroff and Sasso22,Reference Weng, Ou and Huang23)
-
Overweight/obesity was defined as body mass index (BMI) ≥25 kg/m2.(Reference Ashfaq, Aljaadi, Salaka, Noorwali, Khatoon and Khan24)
-
Diabetes was defined as fasting blood glucose (FBG) ≥7⋅0 mmol/l, glycated haemoglobin (HbA1c) ≥6⋅5 %, self-reported diabetes which was diagnosed by medical professionals or taking diabetes drugs.(Reference Guo, Song and Sun25)
-
Metabolic dysregulation was defined as the presence of two or more of the following metabolic abnormalities in individuals with lean/normal weight: (1) waist circumference ≥102 cm in men and ≥88 cm in women; (2) blood pressure ≥130/85 mmHg or receiving antihypertensive medication treatment; (3) serum triglycerides (TG) ≥150 mg/dl (1⋅70 mmol/l) or receiving specific drug treatment; (4) high-density lipoprotein cholesterol (HDL-C) <40 mg/dl (1⋅0 mmol/l) for men and <50 mg/dl (1⋅3 mmol/l) for women or receiving specific drug treatment; (5) prediabetes: FBG at 100–125 mg/dl (5⋅6–6⋅9 mmol/l), or 2-h post-load glucose level at 140–199 mg/dl (7⋅8–11⋅0 mmol/l), or HbA1c at 5⋅7–6⋅4 % (39–47 mmol/mol); (6) a score of Homeostatic Model Assessment for Insulin Resistance (HOMA-IR) ≥2⋅5; and (7) high-sensitivity C-reactive protein (hsCRP) >2 mg/l.(Reference Sun, Jin and Wang21)
Covariates
The covariates in this study involved data on demographics, physical examinations, living habits, comorbidities, laboratory values, and micronutrient supplements.
-
Demographic data included age, gender, race, education level, marital status, and poverty-to-income ratio (PIR; ≤1⋅0, 1⋅0–2⋅0, >2⋅0, and unknown).
-
Physical examinations included waist-to-height ratio (WHtR) and body mass index (BMI). BMI was calculated as body weight (kg)/height (m)2 and divided into <25 and/or ≥25 kg/m2.
-
Living habits included drinking, smoking, and physical activity (<450 MET⋅min/week, ≥450 MET⋅min/week, and unknown).
-
Comorbidities included diabetes, hypertension, dyslipidaemia, cardiovascular disease (CVD), hepatitis B virus, and hepatitis C virus. Hypertension was defined as systolic blood pressure (SBP) ≥140 mmHg, or diastolic blood pressure (DBP) ≥90 mmHg, or self-reported hypertension, or self-reported use of antihypertensive medications.(Reference Zhou, Xie and Liu26) Dyslipidaemia was defined as total cholesterol (TC) ≥200 mg/dl, triglyceride (TG) ≥150 mg/dl, low-density lipoprotein cholesterol (LDL-C) ≥130 mg/dl, high-density lipoprotein cholesterol (HDL-C) ≤40 mg/dl, self-reported hypercholesterolaemia, or undergoing lipid-lowering therapy(Reference Wang, Pang and Wang27)
-
Laboratory values included alanine aminotransferase (ALT), alkaline phosphatase (ALP), aspartate aminotransferase (AST), blood urea nitrogen (BUN), gamma-glutamyl transaminase (GGT), lactate dehydrogenase (LDH), uric acid, total bilirubin, and platelet.
-
Micronutrient supplements included copper supplement, zinc supplement, iron supplement, and selenium supplement. The intake of copper, zinc, iron, and selenium from supplements were assessed using the dietary supplement questionnaire.
Statistical analysis
The continuous data were described as mean (standard error) (se), and differences between the two groups were compared using an independent samples t test. The counting data were described as number and percentage [n (%)], and differences between the two groups were compared using a chi-square test. The missing data were processed using multiple imputation, and sensitivity analysis was performed before and after the imputation. The missing data on PIR and physical activity were divided into ‘Unknown’, and the missing data on copper supplement, zinc supplement, iron supplement, and selenium supplement were divided into ‘Missing’ because of the above variables with a large proportion of missing values (Supplementary Table S1).
Logistic regression analysis was used to explore the association between micronutrients intake (copper, zinc, iron, and selenium) and MAFLD, and the results were shown as odds ratio (OR) with 95 % confidence intervals (CIs). To screen covariates, variables with statistical significance in the univariate logistic regression were included in the multivariate logistic regression. Through stepwise regression, age, gender, race, BMI, WHtR, diabetes, hypertension, dyslipidaemia, ALT, BUN, GGT, and uric acid were screened out. Model 1 was the unadjusted model; Model 2 was adjusted for age, gender, race, BMI, WHtR, diabetes, hypertension, dyslipidaemia, ALT, BUN, GGT, and uric acid. Model 3 was additionally adjusted for copper intake, zinc intake, iron intake, and selenium intake based on Model 2. Subgroup analysis was performed based on age, gender, diabetes, hypertension, dyslipidaemia, BMI, and hepatitis. The statistical analysis was performed using SAS 9.4 (SAS Institute Inc., Cary, NC, USA), and P < 0⋅05 was considered as statistical significance.
Results
Participants’ characteristics
A total of 9693 participants from the NHANES (2017–2020) were extracted in this study. Of these, 1376 participants without liver ultrasound transient elastography examination and 1752 participants without two 24-h dietary recalls for micronutrients intake were excluded. Of the remaining 6565 participants, 89 participants with unusually low or high total energy intake and 500 participants missing information of key covariates were excluded. Finally, 5976 participants were included for analysis, with 3437 participants diagnosed as MAFLD (Fig. 1). The results were consistent before and after imputation (all P > 0⋅05) (Supplementary Table S2).

Fig. 1. Flowchart of participant's selection.
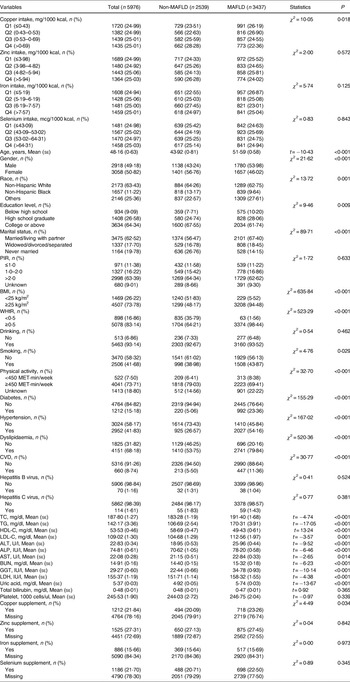
Table 1 shows the characteristics of included participants. Among all the included participants, 2918 (49⋅18 %) were male and the mean age was 48⋅16 years. There were significant differences between the MAFLD group and the non-MAFLD group in copper intake, age, gender, race, education level, marital status, BMI, WHtR, smoking, physical activity, diabetes, hypertension, dyslipidaemia, CVD, TC, TG, HDL-C, LDL-C, ALT, ALP, AST, BUN, GGT, LDH, uric acid, and copper supplement. Supplementary Fig. S1 demonstrates the quartile level of the intake of the four micronutrients in the daily diet. The quartile levels of daily copper intake were ≤0⋅80 mg, 0⋅80–1⋅08 mg, 1⋅08–1⋅39 mg, and >1⋅39 mg, respectively. The quartile levels of daily zinc intake were ≤7⋅14 mg, 7⋅14–9⋅62 mg, 9⋅62–13⋅07 mg, and >13⋅07 mg, respectively. The quartile levels of daily iron intake were ≤9⋅28 mg, 9⋅28–12⋅45 mg, 12⋅45–16⋅81 mg, and >16⋅81 mg, respectively. The quartile levels of daily selenium intake were ≤77⋅30 mcg, 77⋅30–103⋅62 mcg, 103⋅62–136⋅19 mcg, and >136⋅19 mcg, respectively.
Table 1. Baseline characteristics of enrolled participants

mean (se), mean (standard error); MAFLD, metabolic-associated fatty liver disease; PIR, poverty-to-income ratio; BMI, body mass index; WHtR, waist-to-height ratio; CVD, cardiovascular disease; TC, total cholesterol; TG, triglyceride; HDL-C, high-density lipoprotein cholesterol; LDL-C, low-density lipoprotein cholesterol; ALT, alanine aminotransferase; ALP, alkaline phosphatase; AST, aspartate aminotransferase; BUN, blood urea nitrogen; GGT, gamma-glutamyl transaminase; LDH, lactate dehydrogenase.
Association between microelements intake and odds of MAFLD
In the unadjusted model, we found that copper intake in the Q4 (OR = 0⋅71, 95 % CI 0⋅55, 0⋅91) and iron intake in the Q3 (OR = 0⋅70, 95 % CI 0⋅53, 0⋅92) was associated with the lower odds of MAFLD compared to the reference group. After adjusting age, gender, race, BMI, WHtR, diabetes, hypertension, dyslipidaemia, ALT, BUN, GGT, and uric acid, copper intake (Q3: OR = 0⋅67, 95 % CI 0⋅49, 0⋅91; Q4: OR = 0⋅58, 95 % CI 0⋅43, 0⋅78) and iron intake (Q2: OR = 0⋅63, 95 % CI 0⋅44, 0⋅91; Q3: OR = 0⋅59, 95 % CI 0⋅40, 0⋅85) were found to be associated with the lower odds of MAFLD than that in the Q1. Further adjusting copper intake (not for copper intake analysis), zinc intake, iron intake (not for iron intake analysis), and selenium intake, similar results were found (copper intake in the Q3: OR = 0⋅68, 95 % CI 0⋅50, 0⋅93; copper intake in the Q4: OR = 0⋅60, 95 % CI 0⋅45, 0⋅80; iron intake in the Q2: OR = 0⋅64, 95 % CI 0⋅45, 0⋅92; iron intake in the Q3: OR = 0⋅61, 95 % CI 0⋅41, 0⋅91). A statistical difference was not found in the association between zinc intake and selenium intake and the odds of MAFLD (all P > 0⋅05) (Table 2).
Table 2. Association between micronutrients intake and metabolic-associated fatty liver disease

Ref, reference; OR, odds ratio; CI, confidence interval.
Model 1: unadjusted model.
Model 2: adjusted for age, gender, race, BMI, WHtR, diabetes, hypertension, dyslipidaemia, ALT, BUN, GGT, and uric acid.
Model 3: adjusted for copper intake (not for copper intake analysis), zinc intake (not for zinc intake analysis), iron intake (not for iron intake analysis), and selenium intake (not for selenium intake analysis) based on Model 2.
Subgroup analyses
Table 3 shows the results of subgroup analyses. In age subgroups, the negative association between copper intake and MAFLD was found in patients with age <60 years (Q4: OR = 0⋅56, 95 % CI 0⋅40, 0⋅79). Moderate intake of iron was found to be associated with the lower odds of MAFLD in patients with age <60 years (Q3: OR = 0⋅60, 95 % CI 0⋅37, 0⋅99) and with age ≥60 years (Q2: OR = 0⋅58, 95 % CI 0⋅35, 0⋅97).
Table 3. Subgroup analysis for the association between micronutrients intake and metabolic-associated fatty liver disease
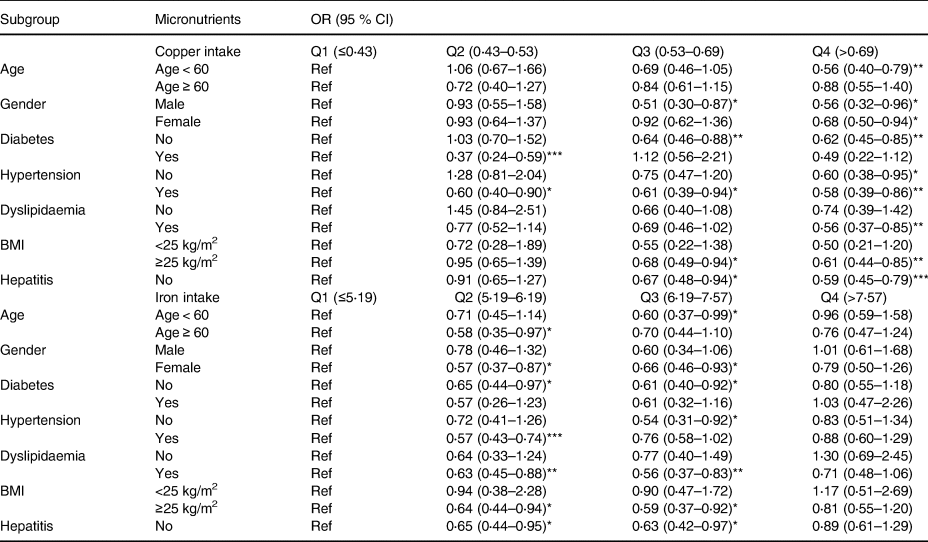
OR, odds ratio; CI, confidence interval.
*P < 0⋅05, **P < 0⋅01, ***P < 0⋅001.
Age subgroup: adjusting gender, race, BMI, WHtR, diabetes, hypertension, dyslipidaemia, ALT, BUN, GGT, uric acid, copper intake (not for copper intake analysis), zinc intake, iron intake (not for iron intake analysis), and selenium intake.
Gender subgroup: adjusting age, race, BMI, WHtR, diabetes, hypertension, dyslipidaemia, ALT, BUN, GGT, uric acid, copper intake (not for copper intake analysis), zinc intake, iron intake (not for iron intake analysis), and selenium intake.
Diabetes subgroup: adjusting age, gender, race, BMI, WHtR, hypertension, dyslipidaemia, ALT, BUN, GGT, uric acid, copper intake (not for copper intake analysis), zinc intake, iron intake (not for iron intake analysis), and selenium intake.
Hypertension subgroup: adjusting age, gender, race, BMI, WHtR, diabetes, dyslipidaemia, ALT, BUN, GGT, uric acid, copper intake (not for copper intake analysis), zinc intake, iron intake (not for iron intake analysis), and selenium intake.
Dyslipidaemia subgroup: adjusting age, gender, race, BMI, WHtR, diabetes, hypertension, ALT, BUN, GGT, uric acid, copper intake (not for copper intake analysis), zinc intake, iron intake (not for iron intake analysis), and selenium intake.
BMI subgroup: adjusting age, gender, race, WHtR, diabetes, hypertension, dyslipidaemia, ALT, BUN, GGT, uric acid, copper intake (not for copper intake analysis), zinc intake, iron intake (not for iron intake analysis), and selenium intake.
Hepatitis subgroup: adjusting age, gender, race, BMI, WHtR, diabetes, hypertension, dyslipidaemia, ALT, BUN, GGT, uric acid, copper intake (not for copper intake analysis), zinc intake, iron intake (not for iron intake analysis), and selenium intake.
No hepatitis indicated that the participants did not suffer from hepatitis B virus or hepatitis C virus. Hepatitis indicated that the participants suffer from one of the following: hepatitis B virus and hepatitis C virus. Due to the number of participants with hepatitis being small (n 199), the analysis of the participants with hepatitis is not performed.
In gender subgroups, high copper intake was found to be associated with the lower odds of MAFLD in male (Q3: OR = 0⋅51, 95 % CI 0⋅30, 0⋅87; Q4: OR = 0⋅56, 95 % CI 0⋅32, 0⋅96) and female (Q4: OR = 0⋅68, 95 % CI 0⋅50, 0⋅94). Iron intake at moderate level was associated with the lower odds of MAFLD in female (Q2: OR = 0⋅57, 95 % CI 0⋅37, 0⋅87; Q3: OR = 0⋅66, 95 % CI 0⋅46, 0⋅93).
In diabetes subgroups, higher copper intake was associated with the lower odds of MAFLD in patients with diabetes (Q2: OR = 0⋅37, 95 % CI 0⋅24, 0⋅59) and without diabetes (Q3: OR = 0⋅64, 95 % CI 0⋅46, 0⋅88; Q4: OR = 0⋅62, 95 % CI 0⋅45, 0⋅85). Moderate iron intake was associated with the lower odds of MAFLD in patients without diabetes (Q2: OR = 0⋅65, 95 % CI 0⋅44, 0⋅97; Q3: OR = 0⋅61, 95 % CI 0⋅40, 0⋅92).
In hypertension subgroups, the odds of MAFLD were lower with the increase of copper intake in patients with hypertension (Q2: OR = 0⋅60, 95 % CI 0⋅40, 0⋅90; Q3: OR = 0⋅61, 95 % CI 0⋅39, 0⋅94; Q4: OR = 0⋅58, 95 % CI 0⋅39, 0⋅86) and without hypertension (Q4: OR = 0⋅60, 95 % CI 0⋅38, 0⋅95). Also, the lower odds of MAFLD with the moderate intake of iron was found in patients with hypertension (Q2: OR = 0⋅57, 95 % CI 0⋅43, 0⋅74) and without hypertension (Q3: OR = 0⋅54, 95 % CI 0⋅31, 0⋅92).
In dyslipidaemia subgroups, the negative association between higher intake of copper (Q4: OR = 0⋅56, 95 % CI 0⋅37, 0⋅85) or moderate intake of iron (Q2: OR = 0⋅63, 95 % CI 0⋅45, 0⋅88) and MAFLD was found in dyslipidaemia patients.
In BMI subgroups, higher intake of copper (Q3: OR = 0⋅68, 95 % CI 0⋅49, 0⋅94; Q4: OR = 0⋅61, 95 % CI 0⋅44, 0⋅85) and moderate intake of iron (Q2: OR = 0⋅64, 95 % CI 0⋅44, 0⋅94; Q3: OR = 0⋅59, 95 % CI 0⋅37, 0⋅92) were found to be associated with the lower odds of MAFLD in patients with BMI ≥25 kg/m2.
In hepatitis subgroups, higher intake of copper (Q3: OR = 0⋅67, 95 % CI 0⋅48, 0⋅94; Q4: OR = 0⋅59, 95 % CI 0⋅45, 0⋅79) and moderate intake of iron (Q2: OR = 0⋅65, 95 % CI 0⋅44, 0⋅95; Q3: OR = 0⋅63, 95 % CI 0⋅42, 0⋅97) were correlated with the lower odds of MAFLD in patients without hepatitis.
Discussion
In this study, we extracted NHANES 2017–2020 data and included 5976 eligible participants to evaluate the association between dietary intake of micronutrients and the odds of MAFLD. After adjusting the potential confounders, high intake of copper (Q3 and Q4) and moderate intake of iron (Q2 and Q3) were found to be associated with the low odds of MAFLD. The association between high copper intake and the low odds of MAFLD was also in patients with age <60 years, in male and female, with or without diabetes, with or without hypertension, with dyslipidaemia, and without hepatitis.
Micronutrients have been reported to be deficient in patients with liver diseases, which may damage metabolic processes.(Reference Kozeniecki, Ludke, Kerner and Patterson28) Copper is one of the essential components of the micronutrients(Reference Mao and Huang29) and has been reported to be involved in the progression of fatty liver diseases.(Reference Tarantino, Porcu, Arciello, Andreozzi and Balsano30) NAFLD patients have 50 % less hepatic copper content compared to subjects with unrelated liver injury.(Reference Aigner, Strasser and Haufe31) TG level in the liver increasing to more than 5 % of liver weight or volume may cause hepatic steatosis.(Reference Hoyumpa, Greene, Dunn and Schenker32) Dietary copper has been reported to be associated with the lipid metabolism,(Reference Blades, Ayton, Hung, Bush and La Fontaine33) and copper deficiency may lead to hepatic steatosis and insulin resistance.(Reference Hoyumpa, Greene, Dunn and Schenker32) This present study found that high intake of dietary copper was associated with the low odds of MAFLD. There are several explanations for this. First, higher intake of copper may exert an antioxidant effect to reduce oxidative stress and decrease lipid synthesis, which retards the progression of MAFLD.(Reference Arefhosseini, Pouretedal, Tutunchi and Ebrahimi-Mameghani34) Second, fatty liver diseases are linked to insulin resistance,(Reference Tarantino, Crocetto and Di Vito35) higher intake of copper may decrease hepatic steatosis and insulin resistance.(Reference Aigner, Strasser and Haufe31)
In this study, we also found the association between high intake of copper and the low odds of MAFLD in patients in male or female, with or without diabetes, with or without hypertension, indicating that the association between dietary copper intake and MAFLD was not affected by gender, diabetes, and hypertension. Moreover, we found the negative association between dietary copper intake and MAFLD in patients with age <60 years, while no significant association was found in patients with age ≥60 years. This may be explained by that subjects with increased age (≥60 years) were more likely to suffer from fatty liver diseases,(Reference Sayiner, Koenig, Henry and Younossi36) which may weaken the association between dietary copper intake and MAFLD. In addition, MAFLD was reported to be closely associated with the dyslipidaemia.(Reference Heeren and Scheja37) Patients have an increased risk of dyslipidaemia, and dyslipidaemia was the major cause of death in MAFLD patients.(Reference Deprince, Haas and Staels38) In this study, we found that high intake of dietary copper was associated with the low odds of MAFLD in patients with dyslipidaemia. This may be explained by that the increased copper level in the liver had a negative effect on dyslipidaemia,(Reference Blades, Ayton, Hung, Bush and La Fontaine33) thereby decreasing the odds of MAFLD. We also found the negative association between dietary copper intake and MAFLD in patients without hepatitis, while this association has not been explored in hepatitis patients due to the small sample size (n 199). In the future, more studies should be performed to explore the association between copper intake and MAFLD in hepatitis patients.
Iron plays an indispensable role in human physiology, and participates in haeme biosynthesis, DNA biosynthesis, oxygen transport, and citric acid cycle.(Reference Richardson, Lane and Becker39) Both iron deficiency and iron overload are detrimental to human health.(Reference Kassebaum40,Reference Utzschneider and Kowdley41) Iron deficiency may lead to anaemia and fatigue, and iron overload may lead to the formation of reactive oxygen species which results in cellular dysfunctions and organ damage.(Reference Kassebaum40,Reference Utzschneider and Kowdley41) Iron-loading is frequently found in chronic liver diseases, and about one third of patients with fatty liver disease show iron homeostasis disturbance.(Reference Datz, Müller and Aigner42) Serum ferritin may aggravate MAFLD by some bacterial families in iron metabolism, which might affect the microbiome composition and related transcriptomic features, thereby leading to liver fat accumulation.(Reference Mayneris-Perxachs, Cardellini and Hoyles15) In addition, hepatic iron accumulation may exacerbate hepatic insulin resistance and increase gluconeogenesis and lipogenesis by regulating the expression of related mRNA.(Reference Altamura, Müdder and Schlotterer43,Reference Martin-Rodriguez, Gonzalez-Cantero and Gonzalez-Cantero44) The recommended iron intake ranges from 8 to 18 mg/d for adults.(45) In this study, we found that iron intake at Q2 (9⋅28–12⋅45 mg) and Q3 (12⋅45–16⋅81 mg) was associated with the lower odds of MAFLD. Iron intake at Q2 and Q3 was similar to the recommended level. Our findings indicated the need of adequate intake of iron for managing MAFLD.
This study explores the association between dietary micronutrients and MAFLD using a representative sample size, and adjusts the potential confounders to make the results more reliable. However, there are several limitations in this study. First, this is a cross-sectional study, which makes it difficult to determine a causal relationship. Second, data on micronutrients intake are obtained using the 24-h dietary recall method, which may exist recall bias and may not reflect a person's daily diet. Third, hepatic steatosis is diagnosed according to the ultrasound transient elastography examination rather than liver biopsy (the golden standard for the assessment of hepatic steatosis). Fourth, due to the small sample size of patients with hepatitis, we do not explore the association between micronutrients intake and MAFLD in hepatitis patients. Further studies should be performed to explore the association between micronutrients intake and MAFLD in this population.
Conclusion
In this study, we found that high intake of copper and moderate intake of iron were associated with the low odds of MAFLD. Our findings may indicate the importance of micronutrients in MAFLD and provide guidance for the management of MAFLD. Future prospective studies should be performed to confirm these findings.
Supplementary material
The supplementary material for this article can be found at https://doi.org/10.1017/jns.2023.99.
Acknowledgements
This research received no specific grant from any funding agency in the public, commercial, or not-for-profit sectors.
J.-z. H. and L. Z. conceived the report and designed the study. J.-z. H. wrote the manuscript. J.-z. H. and Q.-w. Wu collected, analysed, and interpreted the data. L. Z. critically reviewed and edited the manuscript. All authors read and approved the final manuscript.
The authors declare that there is no conflict of interest.


 Open access