1. Introduction
The standard approach in the climate change literature to assessing the likely economic damages of different greenhouse gas (GHG) emission scenarios is to estimate the social cost of carbon, which is an estimate of the present value of such damages that are associated with a marginal (usually one metric ton) increase in such emissions in a given year. Alternatively, the value of damages avoided from a marginal reduction in GHG emissions can also be measured. For example, the US Environmental Protection Agency and other federal agencies have adopted the social cost of carbon approach to evaluate different climate change regulator initiatives.Footnote 1
However, estimating the social cost of carbon requires considerable information on the physical, ecological and economic impacts of climate change. For example, in its Fifth Assessment Report (AR5), the Intergovernmental Panel on Climate Change (IPCC, 2014) expressed concern that current estimates of the social cost of carbon might be neglecting some of these important impacts, and thus underrepresenting the damages associated with climate change. Many economists agree, and have called on the Sixth IPCC Assessment to improve economic models of climate change so as to refine estimates of the social cost of carbon (Revesz et al., Reference Revesz, Howard, Goulder, Kopp, Livermore, Oppenheimer and Sterner2014; Tol, Reference Tol2016).
Here, we offer an additional approach to measuring the welfare costs associated with GHG emissions. By treating the world's carbon budget as a resource asset, we develop a user cost, or economic depreciation method of estimating the welfare changes of different GHG emission scenarios. The user cost of carbon reflects the scarcity value of an important global environmental service – the value of the assimilative capacity of the earth to absorb a target level of GHG emissions and temperature change. Unlike the social cost of carbon, such a method does not require extensive economic modeling of the damages arising from the physical, ecological and economic impacts of climate change, including allowing for the extensive uncertainties surrounding such impacts. Instead, it can be based on the unit rental value of emissions in terms of their contributions to global GDP and world interest rates. Thus, the user cost of carbon is not an alternative to measuring the social cost of carbon, but instead provides an additional useful estimate of a key scarcity value associated with different climate change scenarios.
In its Fifth Assessment Report (AR5), the IPCC (2014) estimated the world's ‘carbon budget’, which is the cumulative amount of anthropogenic CO2 emissions that would limit global warming to less than 2°C. To attain this warming target requires restricting the accumulated CO2 GHG emissions since 1870 to 2,900 gigatonnes of carbon dioxide-equivalent (GtCO2e). However, 1,890 GtCO2e were emitted by 2011, leaving 1,010 GtCO2e to be the current carbon budget that is consistent with this temperature goal. Although AR5 recognizes that some dissipation in the accumulated stock of carbon occurs, this is minor relative to the stock. Consequently, one can view the carbon budget associated with keeping global warming under 2°C as a non-renewable resource asset that is depleted by annual GHG emissions generated by world economic activity.
By modeling the 2°C carbon budget in this way, it is possible to estimate the user cost associated with depleting this budget under various emission scenarios. For a non-renewable asset, the user cost indicates the welfare cost of ‘using up’ the resource today based on a given depletion level (El Serafy, Reference El Serafy, Ahmad, El Serafy and Lutz1989; Hartwick and Hageman, Reference Hartwick, Hageman and Lutz1993; Hamilton and Ruta, Reference Hamilton and Ruta2009; Wei, Reference Wei2015; Hamilton, Reference Hamilton2016). To derive this user cost, we develop a model with two assets, capital stock K(t) and a carbon budget B(t), where the latter is depleted by a time path for GHG emissions G(t), capital allocation is determined by world interest rates, and the unit rental value of emissions is their contributions to global GDP.
Based on AR5 estimates of past emissions and projections for 2010 onwards (van Vuuren et al., Reference van Vuuren, Stehfest and den Elzen2011), we consider three scenarios: exponentially growing emissions, constant emissions and exponentially declining emissions. We compare the latter two scenarios against the business as usual (BAU) scenario of growing emissions. We find that, for constant emissions, the gain in social welfare is US$3.3bn (6 per cent of global GDP) over BAU, which extends the lifetime of the carbon budget from 18 to 21 years. For declining emissions, the gain is US$10.4bn (20 per cent of global GDP), and an extension of the carbon budget timeframe to 30 years. We also employ our user cost analysis to illustrate the impacts of the current Paris Climate Change Agreement pledges, and find that the Agreement will generate a social gain of US$2–2.5 trillion (4–5 per cent of global GDP) but will not prevent depletion of the 2°C global carbon budget by 2030. To our knowledge, this paper is the first attempt to apply the user cost method to determine the economic implications of different emissions scenarios to attaining the 2°C global warming target.
The paper is organized as follows. Section 2 develops our user cost model of the carbon budget through adapting standard economic depreciation methods applied to a non-renewable resource stock. Section 3 applies this method for determining the user cost of GHG emissions to three different scenarios: exponentially growing emissions, constant emissions and exponentially declining emissions. We then discuss the policy implications of these scenarios in section 4 and also apply our user cost approach to analyze current Paris Agreement pledges on reducing emissions. We conclude in section 5 by summarizing our key findings and discussing how the user cost method could be further improved for policy analysis.
2. A user cost model of the carbon budget
We develop our user cost model of the global carbon budget using conventional economic depreciation accounting methods. First proposed by El Serafy (Reference El Serafy, Ahmad, El Serafy and Lutz1989), such an approach has been employed to define and account for the ‘user cost’, or economic depreciation, of a finite natural resource stock, namely the loss in value of the exhaustible resource from its use in production (Hartwick and Hageman, Reference Hartwick, Hageman and Lutz1993; Hamilton and Ruta, Reference Hamilton and Ruta2009; Wei, Reference Wei2015; Hamilton, Reference Hamilton2016). Under the standard modeling assumptions of this approach, resource use is not determined optimally by maximizing social welfare; instead, it is assumed that the resource is fully depleted in finite time, that unit total rents from extraction and use in production are constant, and that the quantities extracted are also constant over this time horizon.
As noted by Wei (Reference Wei2015: 579), ‘These assumptions make national accountants comfortable since future uncertainties are eliminated from the economy’. They also mean that actual (market) prices, and not shadow (or optimal) prices, may be used for valuing capital assets (Dasgupta and Mäler, Reference Dasgupta and Mäler2000; Hamilton and Ruta, Reference Hamilton and Ruta2009; Hamilton, Reference Hamilton2016). This also makes the approach attractive for estimating the economic consequences of depleting the global carbon budget.
There are several advantages to applying the user cost method in this way. First, as the world's ‘carbon budget’ is the cumulative amount of anthropogenic CO2 emissions that would limit global warming to less than 2°C, this limited capacity to absorb emissions is essentially a non-renewable stock that is depletable in finite time. Secondly, the source of depletion is the total GHG emissions of the global economy, which are effectively ‘using up’ the 2°C warming carbon budget. Thirdly, as a necessary by-product of aggregate world production, the annual GHG emissions that deplete the carbon budget may be treated as an input into production, and its value can be approximated by global GDP per unit of total GHG emissions. Finally, given these assumptions, it is possible to estimate the lifetime of the 2°C carbon budget associated with different GHG emission time paths, and the user cost, or economic depreciation, associated with each depletion scenario.
Treating the global carbon budget as a capital asset that is depleted in finite time is relatively straightforward. According to IPCC (2014), limiting global warming to less than 2°C requires restricting all GHG emissions accumulated since 1870 to 2,900 GtCO2e. However, 1,890 GtCO2e were emitted by 2011, leaving 1,010 GtCO2e to be the current carbon budget that is consistent with the temperature goal. In effect, the latter is a non-renewable asset, which is depleted through annual GHG emissions by the global economy. This can be established more formally as follows.
At time t, let B(t) represent the initial amount of the carbon budget that is associated with keeping global warming under 2°C. As a finite resource, the carbon budget will be exhausted over some time period
 $T-t,\ 0\le T\le \infty $
. World GHG emissions at any time t are G(t). Thus, it follows that
$T-t,\ 0\le T\le \infty $
. World GHG emissions at any time t are G(t). Thus, it follows that
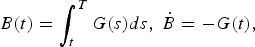 $$B(t)=\int_t^T {G(s)ds,\ \dot{{B}}=-G(t)},$$
where we adopt the usual notation that a dot over a variable indicates its derivative with respect to t.
The carbon budget can be considered an economic asset. Following Hamilton and Ruta (Reference Hamilton and Ruta2009), we consider this asset in the context of practical wealth accounting for economic depreciation of such a depletable and finite asset. This approach assumes that all other assets are subsumed into a single capital stock K(t), which is exogenously given at time t. Aggregate production is represented by the functional relationship F(K, G) with constant returns to scale. If C(t) is aggregate consumption, then the accounting identity of the economy is
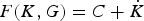 $F({K,G})=C+\dot{{K}}$
. Finally, invoking Dasgupta and Mäler (Reference Dasgupta and Mäler2000), assume that some allocative mechanism exists in this economy that yields a fixed interest rate given by r=F
K
and a constant rent
$F({K,G})=C+\dot{{K}}$
. Finally, invoking Dasgupta and Mäler (Reference Dasgupta and Mäler2000), assume that some allocative mechanism exists in this economy that yields a fixed interest rate given by r=F
K
and a constant rent
 $\bar{{v}}$
associated with each unit of the budget, which ensures that GHG use in production requires
$\bar{{v}}$
associated with each unit of the budget, which ensures that GHG use in production requires
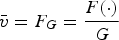 $\bar{v}= F_{G}= {F(\cdot)\over G}$
.
$\bar{v}= F_{G}= {F(\cdot)\over G}$
.
At any time t, the value of the remaining carbon budget will be the present value of the total rents generated from its eventual depletion, which depends on the given time path G(t) of GHG emissions from global economic production. Given the fixed interest rate r, the constant unit carbon rental
 $\bar{{v}}$
, and emissions G(t), the capitalized value of the global carbon budget is
$\bar{{v}}$
, and emissions G(t), the capitalized value of the global carbon budget is
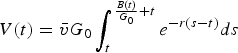
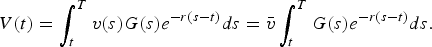 $$V(t)=\int_t^T {v(s)G(s)e^{-r( {s-t})}} ds=\bar{{v}}\int_t^T {G(s)e^{-r({s-t} )}} ds.$$
Differentiating (2) with respect to time and rearranging yields
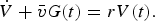 $$\dot{{V}}+\bar{{v}}G(t)=rV(t).$$
This is the ‘fundamental equation of asset equilibrium’ (Hartwick and Hageman, Reference Hartwick, Hageman and Lutz1993), which is now applied to the 2°C global carbon budget. It indicates that the sum of the change in the total capitalized value of the carbon budget plus current rents must equal the opportunity cost of holding onto this asset.
Total wealth in the economy is defined as the sum of all assets measured in dollars, i.e.
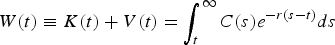 $W(t)\equiv K(t )+V(t)=\int_{t}^{\infty} {C(s)e^{-r({s-t})}ds}$
, which is a measure of social welfare given that this wealth represents the capitalized value of aggregate consumption in perpetuity.Footnote
2
Thus, the accounting price associated with depleting the carbon budget is
$W(t)\equiv K(t )+V(t)=\int_{t}^{\infty} {C(s)e^{-r({s-t})}ds}$
, which is a measure of social welfare given that this wealth represents the capitalized value of aggregate consumption in perpetuity.Footnote
2
Thus, the accounting price associated with depleting the carbon budget is
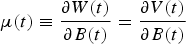 ${\rm \mu} (t)\equiv {\partial W(t)\over \partial B(t)}={\partial V(t)\over \partial B(t)}$
, which equals the marginal loss in social welfare from the depletion of B(t).Footnote
3
Multiplying this accounting price by current GHG emissions yields the user cost of these emissions, μ (t)G(t). That is, at time t, the user cost measures the loss in social welfare from depletion of the carbon budget from GHG emissions of amount G(t).
${\rm \mu} (t)\equiv {\partial W(t)\over \partial B(t)}={\partial V(t)\over \partial B(t)}$
, which equals the marginal loss in social welfare from the depletion of B(t).Footnote
3
Multiplying this accounting price by current GHG emissions yields the user cost of these emissions, μ (t)G(t). That is, at time t, the user cost measures the loss in social welfare from depletion of the carbon budget from GHG emissions of amount G(t).
Depletion of the 2°C global carbon budget and the corresponding user cost clearly depend on the time path of GHG emissions G(t). To facilitate our analysis of the user cost under different scenarios, we specify this path as
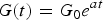 $G(t)=G_{0} e^{at}$
, which in the special case of a=0 yields the constant emission path G(t)=G
0. Using these expressions, and following Wei (Reference Wei2015), we derive the lifetime of the carbon budget T−t and the marginal user cost μ(t).
$G(t)=G_{0} e^{at}$
, which in the special case of a=0 yields the constant emission path G(t)=G
0. Using these expressions, and following Wei (Reference Wei2015), we derive the lifetime of the carbon budget T−t and the marginal user cost μ(t).
The global carbon budget (1) is now
 $B(t)=\int_{t}^{T} G_{0} e^{a({s-t})}ds={G_{0}\over a} [{e^{a({T-t})}-1}]$
. The remaining life of this budget is therefore
$B(t)=\int_{t}^{T} G_{0} e^{a({s-t})}ds={G_{0}\over a} [{e^{a({T-t})}-1}]$
. The remaining life of this budget is therefore
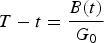
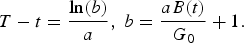 $$T-t={\ln (b)\over{a}},\ b={aB(t)\over{G_{0}}}+1.$$
Substituting into (2) yields the capitalized value of the carbon budget
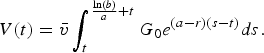 $$V(t)=\bar{{v}}\int_t^{{\ln (b)\over{a}}+t} {G_{0} e^{({a-r})({s-t})}ds}.$$
Consequently, the accounting price associated with depleting B(t) is
 $${\rm \mu} (t)={\partial V(t)\over \partial B(t)}=\bar{v}G_{0} e^{(a-r)\left({\ln (b)\over{a}}+t-t\right)}{1\over ab}{a\over{G_{0}}} ={\bar{v}\over{b}}e^{(a-r){\ln (b)\over a}}={\bar{v}\over{b}}e^{(a-r)(T-t)}.$$
For any time t, the accounting price depends on the size of the carbon budget B(t), the initial GHG emission level G
0, the constant unit carbon rental
 $\bar{{v}}$
, the interest rate r, the exponential rate of change in emissions a, and the remaining lifetime of the carbon budget T−t. For any current emission level G(t), the user cost of these emissions in terms of depleting the 2°C global carbon budget is therefore
$\bar{{v}}$
, the interest rate r, the exponential rate of change in emissions a, and the remaining lifetime of the carbon budget T−t. For any current emission level G(t), the user cost of these emissions in terms of depleting the 2°C global carbon budget is therefore
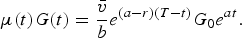 $${\rm \mu} (t)G(t)={\bar{v}\over{b}}e^{({a-r})(T-t)}G_{0} e^{at}.$$
In the special case of constant GHG emissions (a=0), the lifetime of the global carbon budget is
 $T-t={B(t)\over G_{0}}$
, and the capitalized value of this asset is
$T-t={B(t)\over G_{0}}$
, and the capitalized value of this asset is
 $V(t)=\bar{v}G_{0} \int_{t}^{{B(t)\over G_{0}}+t}{e^{-r(s-t)}ds} $
. The corresponding accounting price is
$V(t)=\bar{v}G_{0} \int_{t}^{{B(t)\over G_{0}}+t}{e^{-r(s-t)}ds} $
. The corresponding accounting price is
 $${\rm \mu} (t)={\partial V(t)\over \partial B(t)}=\bar{v}G_{0} e^{-r\left({B(t)\over G_{0}}{+t-t}\right)}{1\over G_{0}}=\bar{{v}}e^{-r{B(t)\over G_{0}}}=\bar{v}e^{-r(T-t)}.$$
If GHG emissions are constant over time, the accounting price depends only on the constant unit carbon rental
 $\bar{{v}}$
, the interest rate r and the remaining lifetime of the carbon budget T−t. For any current emission level G(t)=G
0, the user cost in terms of depleting the 2°C global carbon budget is simply
$\bar{{v}}$
, the interest rate r and the remaining lifetime of the carbon budget T−t. For any current emission level G(t)=G
0, the user cost in terms of depleting the 2°C global carbon budget is simply
 $\bar{{v}}e^{-r({T-t})}G_{0} $
.
$\bar{{v}}e^{-r({T-t})}G_{0} $
.
3. Scenario estimates of user cost
We apply the above methods for determining the user cost of GHG emissions to three different scenarios: exponentially growing emissions, constant emissions and exponentially declining emissions. These scenarios are derived from estimates for the IPCC's Fifth Assessment Report (AR5) on past global emissions from 2000 to 2010 and projected emissions to 2011 (van Vuuren et al., Reference van Vuuren, Stehfest and den Elzen2011). Based on the AR5 estimates, global emissions growing at the same exponential rate as the 2000–2010 annual average is the BAU scenario. We compare this scenario to GHG emissions remaining constant at 2010 levels and emissions declining at an exponential rate from 2000 to 2100 as projected by van van Vuuren et al., (Reference van Vuuren, Stehfest and den Elzen2011).
The IPCC (2014) estimates the current global carbon budget that would limit the warming caused by anthropogenic emissions since 1861–1880 to less than 2°C to be 1,010 GtCO2e. Using this value of the carbon budget, for each of the three GHG emission scenarios we calculate the remaining lifetime of the global carbon budget, the user cost associated with annual GHG emissions in the initial year for each scenario (2010), and the relative size of this user cost in terms of world GDP. As the user cost measures the loss in social welfare from annual emissions from depletion of the carbon budget, it is possible to measure the gain in social welfare from extending the life of the carbon budget in either the constant or declining emissions scenarios compared to the BAU scenario.
Table 1 summarizes the key parameter values and results of the scenario analysis. In the BAU scenario of growing global GHG emissions, the lifetime of the 2°C global carbon budget is just 18 years. That is, if emissions continue to grow at the 2000–2010 exponential rate of 2 per cent, then by 2028 the world will exceed the global carbon budget that limits warming to less than 2°C. The social cost of this depletion scenario will be US$541 per tonne of carbon dioxide-equivalent (tCO2e) emitted. Based on annual GHG emissions in 2010 of 48.14 GtCO2e, the user cost associated with these emissions is US$26 trillion, which is nearly half of 2010 global GDP.
Table 1. User cost estimates for three greenhouse gas emission scenarios
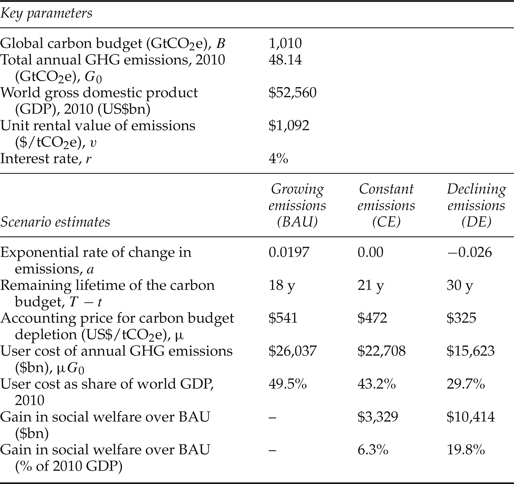
Notes: BAU = business as usual scenario; GtCO2e = giga(109) tonnes of carbon dioxide-equivalent; $ = US$; GHG = greenhouse gas.
Estimate of the current global carbon budget is from IPCC (2014). Global GHG emission estimates from van Vuuren et al. (Reference van Vuuren, Stehfest and den Elzen2011). World GDP from World Bank (2016). World interest rate is based on Hamilton and Ruta (Reference Hamilton and Ruta2009).
For the growing emissions (BAU) scenario, a=0.0197 is derived by fitting an exponential relationship to the estimated 2000–2010 global GtCO2e/year emissions in van Vuuren et al. (Reference van Vuuren, Stehfest and den Elzen2011). The fitted equation is
 $y=39.91e^{0.0197x}\thinspace (R^{2}=0.972)$
. The constant emissions scenario assumes that G(t) remains at the 2010 annual emissions level. For the declining emissions scenario, a=−0.026 is derived by fitting an exponential relationship to the estimated 2010–2100 declining global GtCO2e/year emissions projection in van Vuuren et al. (Reference van Vuuren, Stehfest and den Elzen2011). The fitted equation is
$y=39.91e^{0.0197x}\thinspace (R^{2}=0.972)$
. The constant emissions scenario assumes that G(t) remains at the 2010 annual emissions level. For the declining emissions scenario, a=−0.026 is derived by fitting an exponential relationship to the estimated 2010–2100 declining global GtCO2e/year emissions projection in van Vuuren et al. (Reference van Vuuren, Stehfest and den Elzen2011). The fitted equation is
 $y=48.14e^{-0.026x}(R^{2}=0.963)$
.
$y=48.14e^{-0.026x}(R^{2}=0.963)$
.
If global GHG emissions stay constant at their 2010 annual level, the lifetime of the carbon budget increases only to 21 years (table 1). The accounting price of carbon drops to US$472 per tCO2e emitted, and the user cost of annual GHG emissions in 2010 is US$22.7 trillion. Overall, the net gain in global welfare from switching from BAU to constant emissions is US$3.3 trillion, or just over 6 per cent of 2010 world GDP.
However, if emissions decline at the exponential rate of 2.6 per cent, the lifetime of the 2°C global carbon budget is extended to 30 years. The accounting price of carbon falls to US$325 per tCO2e emitted, and the user cost of annual GHG emissions in 2010 is US$15.6 trillion. The gain in social welfare compared to the BAU scenario is US$10.4 trillion, which amounts to 20 per cent of 2010 world GDP (table 1).
We conduct two sensitivity analyses of the key parameters underlying our scenario estimates of the user costs of depleting the 2°C global carbon budget. The first analysis indicates the effects of varying the interest rate r and the unit rental value of carbon
 $\bar{{v}}$
. The second sensitivity analysis alters the rate of exponential decline in GHG emissions, and determines the rate of decline that reduces the user cost of current emissions to zero – effectively extending the lifetime of the 2°C global carbon budget for hundreds of years.
$\bar{{v}}$
. The second sensitivity analysis alters the rate of exponential decline in GHG emissions, and determines the rate of decline that reduces the user cost of current emissions to zero – effectively extending the lifetime of the 2°C global carbon budget for hundreds of years.
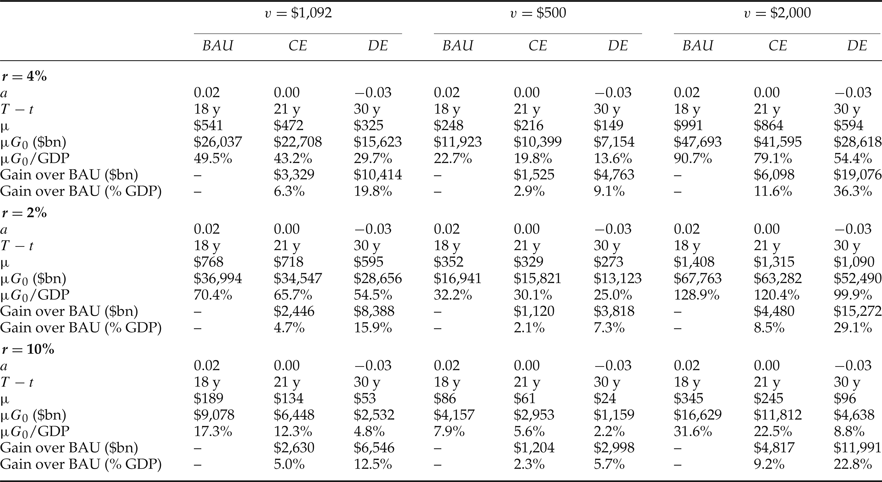
Table 2 displays the results of the sensitivity analysis with respect to changes in the interest rate and the unit rental value of carbon for the BAU growing emissions scenario, the constant emissions scenario and the declining emissions scenario. For comparison, the original estimates from table 1 for r=4% and
 $\bar{v}= \hbox{US}\$ 1,092$
are replicated in the top left-hand corner of table 2. Changes in either the interest rate or the unit rental value of carbon do not affect the remaining lifetime of the carbon budget (see equation (4), above). However, a decrease in r or a rise in
$\bar{v}= \hbox{US}\$ 1,092$
are replicated in the top left-hand corner of table 2. Changes in either the interest rate or the unit rental value of carbon do not affect the remaining lifetime of the carbon budget (see equation (4), above). However, a decrease in r or a rise in
 $\bar{{v}}$
significantly increases the user cost of GHG emissions under all three scenarios; equally, an increase in r or a fall in
$\bar{{v}}$
significantly increases the user cost of GHG emissions under all three scenarios; equally, an increase in r or a fall in
 $\bar{{v}}$
reduces the user cost estimate. Solely changing the interest rate does not have large impacts on the welfare gains of constant or declining emissions compared to the BAU scenario, whereas adjusting the unit rental value appears to affect these welfare gains more. When both r and
$\bar{{v}}$
reduces the user cost estimate. Solely changing the interest rate does not have large impacts on the welfare gains of constant or declining emissions compared to the BAU scenario, whereas adjusting the unit rental value appears to affect these welfare gains more. When both r and
 $\bar{{v}}$
change, the effects on the welfare gains from constant or declining emissions versus the BAU scenarios tend to be dominated by the adjustment in the unit rental value rather than in the interest rate.
$\bar{{v}}$
change, the effects on the welfare gains from constant or declining emissions versus the BAU scenarios tend to be dominated by the adjustment in the unit rental value rather than in the interest rate.
Table 2. Sensitivity to changes in interest rate and unit rental value of carbon
Notes: BAU = business as usual (growing emissions) scenario; CE = constant emissions scenario; DE = declining emissions scenario; $ = US$.
Table 3 depicts the effects of increasing the exponential rate of decline in global GHG emissions from 2010 onwards. For reference, the first column replicates from table 1 the BAU scenario of growing emissions, and the second column the original scenario of 2.6 per cent declining emissions (labeled DE1 in table 3). If the exponential rate of decline is increased to 4 per cent, then the lifetime of the 2°C global carbon budget is extended to 46 years (scenario DE2 in table 3). The accounting price for GHG emissions falls to US$176 per tCO2e emitted, and the user cost of annual GHG emissions in 2010 decreases to US$8.4 trillion. Compared to BAU, there is a gain in welfare of US$17.6 trillion, which is approximately one-third of world GDP.
Table 3. Alternative declining emissions scenarios

Notes: BAU = business as usual scenario; GtCO2e = giga(109) tonnes of carbon dioxide-equivalent; $ = US$. *Rounded figure; actual rate is 0.04766176.
The final scenario DE3 depicted in table 3 indicates that, if global GHG emissions from 2010 onwards were to decline at a 4.8 per cent exponential rate, then the accounting price and thus the user cost of these emissions in terms of depleting the 2°C global carbon budget would be effectively zero. As shown in table 3, this rate of decline would increase the lifetime of the carbon budget to over 300 years, but effectively this is tantamount to ensuring that current and future GHG emissions would meet the target of limiting global warming to under 2°C. The welfare gains compared to the BAU scenario would be US$26 trillion, or half of world GDP.
4. Discussion
To summarize, our estimates suggest that, if global GHG emissions continue to grow at the same exponential rate as the 2000–2010 annual average of 2 per cent, the remaining lifetime of the 2°C global carbon budget will be only 18 years. Moreover, for this BAU scenario, the user cost associated with the 2010 GHG emissions level is US$26 trillion, or half of world GDP. Keeping global emissions constant at their 2010 levels extends the lifetime of the carbon budget only to 21 years, and the gain in social welfare is just US$3.3 trillion (6 per cent of global GDP). If emissions decline exponentially by 2.6 per cent from 2010 onwards, the gain is US$10.4 trillion (19 per cent of global GDP), and the lifetime of the carbon budget is increased to 30 years. Higher rates of decline of 4–5 per cent would significantly forestall depletion of the 2°C global carbon budget and lead to substantial social welfare gains. An exponential decline of 4.8 per cent or more would prevent global warming from exceeding the 2°C threshold altogether, as reflected in the zero user cost associated with this scenario.
Unfortunately, even with the December 2015 Paris Climate Change Agreement, global GHG emissions are unlikely to decline or remain constant before 2030. According to the United Nations Framework Convention on Climate Change (UNFCCC, 2015), after accounting for the Paris Agreement pledges in emission reductions, global GHG emissions will still be 8–18 per cent higher in 2025 and 11–22 per cent more in 2030 compared to 2010 levels. Independent projections confirm that global GHG emissions in 2025, with current Paris pledges included, could be 9–13 per cent higher in 2025 and 10–15 per cent more in 2030 compared to 2010 levels (CAT, 2015). Although the Paris Agreement may slow the growth in global GHG emissions between 2010 and 2030, it is unlikely to prevent depletion of the 2°C global carbon budget by 2030. However, there may be some welfare gains associated with the Paris Agreement pledges compared to the BAU scenario.
To illustrate the impacts of the current Paris Agreement pledges, we employ in our user cost analysis the CAT (2015) projections from 2010 to 2030 for global GHG emissions with these pledges. The results are depicted in table 4. Both the high and low emissions paths predicted for the Paris Agreement pledges (PA 1 and PA 2, respectively) will extend the lifetime of the 2°C global carbon budget to 20 years. This implies that, despite the current pledges under the Agreement, the 2°C limit on global warming would be irreversibly surpassed by 2030. Although the Paris Agreement pledges should induce a fall in global greenhouse emissions from 2030 onwards (CAT, 2015), such a decline will come too late to prevent depletion of the 2°C global carbon budget.Footnote 4 However, our analysis indicates that, by slowing the growth in global emissions over 2010–2030 to 0.5–0.7 per cent, the Paris Agreement will generate a social gain of US$2–2.5 trillion based on 2010 emission levels, which is approximately 4–5 per cent of world GDP.
Table 4. User cost estimates for Paris climate change agreement pledges

Notes: BAU = business as usual scenario; GtCO2e = giga(109) tonnes of carbon dioxide-equivalent; $ = US$; GHG = greenhouse gas.
Estimate of the current global carbon budget is from IPCC (2014). Global GHG emission estimates for the BAU scenario are replicated from van Vuuren et al. (Reference van Vuuren, Stehfest and den Elzen2011), and for the PA 1 and PA 2 scenarios are from CAT (2015). World GDP from World Bank (2016). World interest rate is based on Hamilton and Ruta (Reference Hamilton and Ruta2009).
For the growing emissions (BAU) scenario, a=0.0197 is derived by fitting an exponential relationship to the estimated 2000–2010 global GtCO2e/year emissions in van Vuuren et al. (Reference van Vuuren, Stehfest and den Elzen2011). The fitted equation is
 $y=39.91e^{0.0197x}\,(R^{2}=0.972)$
For the high emissions Paris Agreement (PA 1) scenario, a=0.0068 is derived by fitting an exponential relationship to the estimated 2010–2030 global GtCO2e/year emissions projection in CAT (2015). The fitted equation is
$y=39.91e^{0.0197x}\,(R^{2}=0.972)$
For the high emissions Paris Agreement (PA 1) scenario, a=0.0068 is derived by fitting an exponential relationship to the estimated 2010–2030 global GtCO2e/year emissions projection in CAT (2015). The fitted equation is
 $y=48.14e^{0.0068x}\,(R^{2}=0.973)$
. For the low emissions Paris Agreement (PA 2) scenario, a=0.046 is derived by fitting an exponential relationship to the estimated 2010–2030 global GtCO2e/year emissions projection in CAT (2015). The fitted equation is
$y=48.14e^{0.0068x}\,(R^{2}=0.973)$
. For the low emissions Paris Agreement (PA 2) scenario, a=0.046 is derived by fitting an exponential relationship to the estimated 2010–2030 global GtCO2e/year emissions projection in CAT (2015). The fitted equation is
 $y=48.14e^{0.0046x}(R^{2}=0.903)$
.
$y=48.14e^{0.0046x}(R^{2}=0.903)$
.
Thus, the Paris Agreement pledges will lead to important global welfare gains, but these pledges are insufficient on their own to stop global warming from exceeding 2°C. This finding therefore supports the recent focus on the need for structural transformation, and especially technological innovation, carbon policies and other investments, to induce more rapid GHG mitigation to forestall irreversible climate change (Goulder and Schneider, Reference Goulder and Schneider1999; Fischer and Newell, Reference Fischer and Newell2008; Acemoglu et al., Reference Acemoglu, Aghion, Bursztyn and Hemous2012; Fankhauser et al., Reference Fankhauser, Bowen, Calel, Dechezleprêtre, Grover, Rydge and Sato2013; Golub and Toman, Reference Golub and Toman2016). In effect, the user cost estimates for different emissions scenarios analyzed here provide a ‘benchmark cost’ for assessing such structural change options. For example, we estimate the social cost of depleting the 2°C global carbon budget in the BAU growing emissions scenario to be US$541 per tCO2e emitted. This estimate provides an upward bound on the costs per tCO2e for mitigating carbon through various structural transformation investments and policies, which could assist in determining the cost-effectiveness of these options.Footnote 5
5. Conclusion
The user cost method developed here treats the world's ‘carbon budget’, which is the cumulative amount of anthropogenic CO2 emissions that would limit global warming to less than 2°C, as a non-renewable asset that is depleted by annual GHG emissions. This approach also allows the carbon budget to be considered, along with all other capital assets, as part of the overall welfare-generating wealth of the economy. Following standard assumptions in estimating the economic depreciation of a finite non-renewable asset (El Serafy, Reference El Serafy, Ahmad, El Serafy and Lutz1989; Hartwick and Hageman, Reference Hartwick, Hageman and Lutz1993; Hamilton and Ruta, Reference Hamilton and Ruta2009; Wei, Reference Wei2015; Hamilton, Reference Hamilton2016), we derive the accounting price that measures the marginal impact on social welfare from depleting the carbon budget. Multiplying this accounting price by current GHG emissions yields the user cost, or the loss in social welfare, from depleting the 2°C carbon budget by this level of emissions.
The user cost approach can be employed not only to provide estimates of the lifetime and economic depreciation of the 2°C carbon budget associated with different GHG emission time paths but also to assess these emission scenarios in terms of their potential impacts on social welfare. To illustrate this application, we apply our user cost approach to constant and declining emissions projections derived by van Vuuren et al. (Reference van Vuuren, Stehfest and den Elzen2011) for the IPCC's Fifth Assessment Report and compare the results to the BAU scenario of growing emissions. For constant emissions, the gain in social welfare is US$3.3 trillion (6 per cent of global GDP) over BAU, which extends the lifetime of the carbon budget from 18 to 21 years. For declining emissions, the gain is US$10.4 trillion (19 per cent of global GDP), and an extension of the carbon budget timeframe to 30 years.
The user cost method can also accommodate adjustments to key modeling parameters, such as the interest rate or the unit rental value of carbon. In general, we found that our scenario analysis was highly robust with respect to changes in these parameters, and that the welfare gains from constant or declining emissions versus the BAU scenarios tend to be dominated by the adjustment in the unit rental value rather than in the interest rate. We also investigate the effects of changing the rate of decline in future GHG emissions, including the rate of decline that would eliminate all user costs and thus meet the goal of limiting global warming to under 2°C. Higher rates of decline, such as in the range of 4–5 per cent, would prolong significantly the lifetime of the 2°C global carbon budget and lead to substantial social welfare gains. Eliminating user costs and extending indefinitely the lifetime of the carbon budget would require emissions to fall exponentially by 4.8 per cent or more. In addition, we apply our user cost method to illustrate the impacts of the current Paris Climate Change Agreement pledges to mitigate global GHG emission growth, based on projections from 2010 to 2030 for global emissions with these pledges (CAT, 2015). Although there are some welfare gains from the Paris Agreement abatement pledges, they are insufficient to prevent depletion of the 2°C global carbon budget by 2030.
In sum, the user cost method of estimating the welfare changes of different GHG emission scenarios is straightforward to implement and highly robust for analyzing a variety of policy options. It is not, however, an alternative to measuring the social cost of carbon, which is an estimate of the present value of the likely future economic damages from global warming. Instead, the user cost approach estimates the scarcity value of an important global environmental service – the value of the assimilative capacity of the earth to absorb a target level of GHG emissions and temperature change. The target we choose to analyze here is the 2°C global warming limit, which in turn requires restricting the accumulated CO2 GHG emissions since 1870 to a well-defined global carbon budget. However, the user cost approach could be utilized to analyze the social welfare implications of different emission scenarios with respect to any alternative global warming threshold and carbon budget, such as 1.5°C or 3°C. In this respect, this approach has an important advantage over current economic estimates of the social cost impacts of global warming targets. For example, in his analysis of the various social costs estimates reported in the 2nd through 5th IPCC Assessment Reports, Tol (Reference Tol2016: 10) finds that ‘there is no statistically significant difference between the impacts of 1.6°C and 3.5°C of warming for any of the four assessment reports’.
There are several ways in which the user cost method could be further improved for policy analysis. For example, the approach should be adapted for different types of GHG emissions paths rather than the simple exponential rate of growth depicted here. Although the constant unit rental value of carbon is tractable and consistent with conventional economic depreciation assumptions for a finite depletable stock (El Serafy, Reference El Serafy, Ahmad, El Serafy and Lutz1989; Hartwick and Hageman, Reference Hartwick, Hageman and Lutz1993; Hamilton and Ruta, Reference Hamilton and Ruta2009; Wei, Reference Wei2015; Hamilton, Reference Hamilton2016), allowing this value to vary over time might also provide additional insights into emission scenario analysis. Similarly, estimating the user costs associated with an emission path over several years or even decades may be relevant for some scenarios where the unit rental value or path of emissions varies significantly over time. Finally, future analysis could focus on combining the user cost analysis of depleting the 2°C global with structural transformation analyses of the costs of inducing more rapid GHG mitigation to forestall irreversible climate change damages through technological innovation, carbon policies and other investments (Goulder and Schneider, Reference Goulder and Schneider1999; Fischer and Newell, Reference Fischer and Newell2008; Acemoglu et al., Reference Acemoglu, Aghion, Bursztyn and Hemous2012; Fankhauser et al., Reference Fankhauser, Bowen, Calel, Dechezleprêtre, Grover, Rydge and Sato2013; Golub and Toman, Reference Golub and Toman2016).