1. INTRODUCTION
This paper discusses and documents new yearly series of real wages in six leading Latin American countries (Argentina, Brazil, Chile, Colombia, Mexico and Venezuela, or LA-6) during the period 1900-2011. These countries accounted regularly for about three-quarters of Latin America’s population and gross domestic product (GDP) during the period, and thus can be taken to represent the region as a whole. The data set includes three skill levels in the labour force (unskilled, semi-skilled and relatively skilled workers), offering comparable series across countries consistently defined over time. This makes it possible to identify common trends and diversity in the evolution of wages and wage differentials over the long run, and to explore the impact of mayor transformations occurring in the region such as urbanisation and industrialisation, changes in international integration, human capital formation and the demographic transition.
The study of wages at a multi-country level from a historical perspective has been the focus of attention of previous scholars such as Ericksson (Reference Ericksson1966) and Berg (Reference Berg1968) who studied the period between late 1930s and early 1960s, with particular attention to development in the wage structure. More recently, Williamson (Reference Williamson1999) assembled series for unskilled wages in Argentina, Brazil, Colombia, Mexico and Uruguay to study catching up and income inequality during the first globalisation wave. Frankema (Reference Frankema2009, Ch. 6) constructed long-run series of unskilled (rural and urban) and manufacturing wages and labour shares over the 20th century for Argentina (post-1913), Brazil (post-1920) and Mexico (post-1900); and Frankema (Reference Frankema2012) examined in depth trends in industrial wage inequality in Argentina, Brazil and Chile between 1910 and 2000. But there is a lack of a study covering, in a continuous and consistent fashion, wage developments in a sufficient number of countries over a long-time horizon so as to provide a broad perspective — a glimpse at the big picture — of the regionFootnote 1 .
In the task of assembling the data set, I have benefited greatly from recent efforts of Latin American economic historians in constructing long-term wage series at country level. For example, Matus (Reference Matus2009) and Rodríguez and Weber (Reference Rodríguez Weber2014) for Chile; Urrutia and Ruiz (2010), Lopéz Uribe (Reference Lopéz Uribe2008) and Jaramillo et al. (Reference Jaramillo, Nupia and Romero2000) for Colombia; and Valecillos (Reference Valecillos2007) for Venezuela. This data set has already been used to estimate long-run earnings inequality and concentration in the LA-6 (Astorga Reference Astorga2016, Reference Astorga2017a; Arroyo and Astorga Reference Arroyo Abad and Astorga2017). Here I continue this research agenda by exploring three interrelated aspects. First, the wage record and any patterns associated with periods dominated by a particular growth strategy. Second, developments in the wage share of income. Third, movements in wage differentials, focussing on the skill–unskilled ratio (the wage skill premium) as this is the wage ratio most commonly studied in the literatureFootnote 2 . The key findings are: (i) despite a nearly 147 per cent rise in unskilled wages for the LA-6 average between c.1901 and c.2010, they lagged behind advances in average wages (up 254 per cent) which, in turn, lagged behind growth in income per worker (440 per cent)Footnote 3 ; (ii) the average LA-6 wage share of income started a secular fall in the 1950s; (iii) skill premiums tended to peak in the middle decades of the 20th century, in tune with the acceleration of industrialisation and the timing of the demographic transition. Movements in the terms of trade are broadly associated with both fluctuation and trends in premiums, though the direction of the link is country and time specific.
1.1. Narratives, transformations and periodisation
There are four main narratives to account for changes in the functional distribution of income (reflected in measures such as the wage share of income and wage differentials)Footnote 4 . The first looks at the potential influence of transitions into and out of the international economy. The standard two-factor Heckscher–Ohlin model offers clear empirical predictions. When the factors are land and labour, opening to trade in resource-abundant economies with concentrated resource ownership (features common to most Latin American economies) will worsen inequality by raising the rent to wage ratio and undermining the wage share of income. With capital and labour, a similar move in capital-scarce economies will reduce profit rates and improve labour’s position; whilst protection should benefit profits relative to wages. When the focus is on skilled and unskilled labour, opening to trade in skills-scarce economies will reduce wage premiums, whilst a move towards more closed economies will widen them.
Once a specialisation pattern dictated by factor endowments and comparative advantages is established, export composition and changes in international prices become important aspects to consider. In theory, improved terms of trade should benefit the factor used intensively in the production of the exportable good and vice versa (Stolper–Samuelson effect). If such a factor is land or capital, it should benefit rents or profits (property income) rather than wages (labour income); whereas if it is skilled labour, it should raise skills premiums. But, in the latter case, the overall impact on the wage structure is ambiguous as it will depend on the relative skill intensity of the tradable and non-tradable sectors (Galiani et al. Reference Galiani, Heymann and Magud2010).
The second narrative is based on the Kuznets–Lewis process. Industrialisation initially worsens and subsequently improves income inequality as the labour force reallocates from agriculture to industry. In the context of a surplus of rural labour, as labour moves from low to higher productivity sectors, skill premiums are expected to rise. Later on, as urban workers improve their educational levels and skills, their wages are expected to slow down, whilst the fall in the rural workforce and the modernisation of agriculture would bid up rural wages. Also, when education opportunities are limited, high and sustained population growth tends to create — with a delay — an excess supply of unskilled labour and to depress low-skills wages, as well as to undermine the wage share of income. Equally, significant immigration flows of relatively unskilled workers are to have a similar — though more immediate — effect on wages.
A third explanation focusses on the race between education and technology (Tinbergen Reference Tinbergen1975; Goldin and Katz Reference Goldin and Katz2010). Skill-biased technological progress favours skilled workers and creates demand for those better educated. This results in a rise in skill premiums, creating the incentives for an expansion in the supply of educated workers which, in time, will reduce premiums. A fourth narrative emphasises the role of labour market institutions, encompassing wage and social policies, minimum wage regulations, and collective bargaining. Institutions and policies that support wages — particularly of low-skilled workers — and the influence of unions are likely to result in narrower wage gaps and to create the conditions for a higher weight of labour earnings on income. Also, more integrated and wage-based labour markets should reduce wage disparities.
Table 1 offers data on key transformations that occurred in the LA-6 since 1900 in GDP per capita, urbanisation, schooling and population growth which underpin the distribution narratives. The circa years of 1940 and 1980 correspond to inflexion points (preceding an acceleration in the first date, and levelling off in the second) in the first three variables (Astorga et al. Reference Astorga, Bérges and FitzGerald2005). This periodisation also follows a tradition of economic historians studying the region (e.g. Thorp Reference Thorp1998; Bértola and Ocampo Reference Bértola, Hernández and Siniscalchi2012; Bulmer-Thomas Reference Bulmer-Thomas2013), reflecting the cycle of integration to the world economy and the adoption of particular growth strategies. Roughly speaking, 1900-1939 (or early period) includes the end of the first globalisation wave (about 1870-1914) and the transition years of the 1920s and 1930s; 1940-1979 (middle period) covers the core years of State-led industrialisation under protection; and 1980-2011 (final period) is dominated by structural reforms and the return to export-led growthFootnote 5 .
TABLE 1 KEY TRANSFORMATIONS IN THE LA-6, 1900-2011
Notes: All circa values except population. LA-6: simple average. Dispersion is measured by the coefficient of variation. Population rates are constant annual growth rates.
1 Uses literacy rates to project average years of schooling from 1940 back to 1900.
Sources: For schooling 1940-2010, Morrisson and Murtin (Reference Morrisson and Murtin2009), except Colombia from Bértola et al. (Reference Bértola, Hernández and Siniscalchi2012). Urbanisation, literacy and population 1900-2000 from Astorga et al. (Reference Astorga, Bérges and FitzGerald2005); official sources thereafter. Gross domestic product (GDP) per capita from Bértola and Ocampo (Reference Bértola and Ocampo2012).
The LA-6 average GDP per capita rose by 81 per cent between 1900 and 1940 (ranging from 33 per cent in Mexico to 286 per cent in Venezuela), by 153 per cent between 1940 and 1980 (ranging from 73 per cent in Chile to 321 per cent in Brazil) and by 40 per cent between 1980 and 2010 (ranging from a 7 per cent fall in Venezuela to a 130 per cent rise in Chile). The LA-6 average over the whole period increased by 537 per cent, meaning that the living standards of an average person in the region rose by nearly 6.5 times between 1900 and 2010.
Along the 20th century the LA-6 underwent a rapid process of urbanisation and internal migration, particularly in Brazil, Colombia, Mexico and Venezuela. By 1980 more than 70 per cent of the LA-6 population lived in cities, compared to only 26 per cent in 1900. This process was accompanied by accelerated industrialisation up to the 1980s, and then de-industrialisation during the final two decades on the last century (Thorp Reference Thorp1998). The transition from a largely rural society at the start of the century (less so in Argentina and Chile) to a predominantly urban one by 2000 brought about, first, the widening of the rural–urban divide and, later on, the emergence of a formal–informal urban divide. In both cases, differences in productivity and restrictions in access to formal jobs were at the root of wage disparities. Meanwhile, population (and, with a lag, the labour force) experienced moderate growth in the LA-6 during the first period (an average annual rate of 0.8 per cent), with Argentina and Brazil leading the expansion partly as a result of significant immigration in the early decades. Population accelerated in the middle period (1.1 per cent), led by Mexico and Venezuela, as infant mortality declined amid public health improvements. From the 1980 onwards the region experienced a slowdown in population growth (0.7 per cent). As part of this demographic transition, there was a steady decline in participation rates in the middle period, which was only reversed in the early 1970s with a deceleration in population growth and a rapid rise in the number of women in the labour force (Camou and Maubrigades Reference Camou and Maubrigades2017).
The LA-6 average schooling (years of education) increased by 1.1 years between 1900 and 1940 (led by Argentina and Chile), and registered a substantial gain of 3.1 years between 1940 and 1980 (led by Venezuela and Chile). The advances in schooling slowed down to 2.2 years (with Brazil, Colombia and Mexico catching up) in the final period partly reflecting an upper limit in this variable. This outcome is in tune with the process of skills formation in the region. According to my estimates, at the start of the 20th century the unskilled accounted for about 40 per cent of the labour force in the more advanced economies of Argentina and Chile and around 70 per cent in the other four economies (Astorga Reference Astorga2017a). By 1980 that share came down to about 20 per cent in Argentina, Chile and Venezuela, and to about 40 per cent in Brazil, Colombia and Mexico.
The adopted periodisation also reflects important changes in the degree of integration in the labour market as well as in its institutions. Broadly speaking: (i) reduced integration and limited wage-based labour prevailed in the first period (favouring high wage gaps); (ii) a more integrated and wage-based labour market developed amid a higher level of regulation during the second period (a force for reducing wage gaps); (iii) a well-integrated and wage-based labour markets arose amid deregulation and growing informality in the final period (overall, favouring higher differentials). The 1940s (in 1931 in Mexico) witnessed the introduction of minimum wage legislation across the LA-6 (Méndez Reference Méndez1950). The influence of unions in wage negotiations also rose in the 1950s and 1960s. However, the structural reforms implemented during the 1970s and 1980s undermined minimum wages — and wages in general — and the influence of unions (Morley Reference Morley2000).
On balance, because of structural similarities, largely shared historical roots and institutions, and a broadly similar timing in industrialisation and urbanisation, commonality should dominate in this group of countries. However, there are differences that could have favoured divergence. For instance, in the timing of the demographic transition (early in Argentina and Chile, later in the remaining four countries); or variations in the level of government intervention in the labour market (Frankema Reference Frankema2012). Meanwhile, country diversity in export composition and in the terms of trade is another source of variations in wage levels and skill premiumsFootnote 6 . Furthermore, contrasting inflation trajectories (Bulmer-Thomas Reference Bulmer-Thomas2013) may also have affected wage gaps differently. Argentina, Brazil and Chile were especially prone to price instability in the second half of the last century with hyperinflation bouts during the 1970s and 1980s. This record contrasts with one of relative price stability in Colombia after 1904 (though with persistently moderate levels of inflation), Mexico (from 1920 to the 1970s) and Venezuela (before 1990). To the extent that workers in the urban formal sector are better protected against inflation, and that low-skill workers dominates in the rural and informal sectors, inflation would result in widening wage differentials.
The rest of the paper is organised as follows. Section 2 describes the procedure used in assembling the wage series and offers level comparisons around 1900 and 2000 with wage and income ratios obtained from alternative sources. Section 3 looks at the growth wage record and developments in the wage share of income. Section 4 deals with wage skills premiums and their links with key drivers. Sections 5 offers conclusions. There are two online files: one Appendix with details on procedures and sources by country; the other with the new wage data set.
2. METHODOLOGY
To define wages by skill level, I rely on the four broad occupational groups used by the International Labour Organization (ILO), namely: group 1 (employers, managers and professionals), group 2 (technicians and administrators), group 3 (semi-skilled blue collars workers, other urban workers in relatively low productivity sectors such as retailing and transport, and artisans) and group 4 (rural and urban unskilled workers — including domestic servants and street vendors). I lack enough data to assemble the corresponding wage series for professionals, therefore bear in mind that my «skilled wage» excludes highly skilled workers. In accordance with the above breakdown of the economically active population (EAP), I denote the three wage series as w 2 (skilled), w 3 (semi-skilled) and w 4 (unskilled). The missing wage series w 1 stands for highly skilled workers. A EAP-weighted average (w) is calculated using the lower three categories. No allowances are made for fringe payments (e.g. overtime pay and bonuses); therefore, my series must be taken as a lower bound value of labour earnings in the three lower occupational groupsFootnote 7 . I rely on representative wages or wage averages in order to deal with the complexity and diversity within a given occupational group in terms of skills, experience, gender, sectors (e.g. tradable and non-tradable) and location (rural and urban areas, and regions). And there is always the risk of missing out important wage variations within a group or across space. Wage gaps by occupational categories should largely reflect differences in education and experience. The deeper causes are to be found in factors such as labour productivity, supply conditions (e.g. education and migration costs), as well as imperfections in the labour market.
To deal with the urban–rural divide, during most of the period the unskilled wage is constructed as a weighted average of both rural and urban wages (Argentina post-1936; Brazil post-1958; Chile post-1900; Colombia post-1940; Mexico in 1900-1910 and after 1940; Venezuela post-1936). After 1940 or so, semi-skilled wages tend to reflect urban wages in the construction sector. Prior to that they are predominantly rural wages (e.g. Brazil) or urban ones (e.g. Chile), depending on the urbanisation level of the country. Wage series for the relatively skilled tend to refer to urban jobs in banking, manufacturing or the public sector. This category mixes wages earned by white-collar and specialised blue-collar workers, depending on data availability. It needs to be stressed that all series are subject to estimation shortcomings — with different degrees of severity depending on the country and period — with changes in definitions, sources and coverage. The ideal uninterrupted series of one source, one definition, reflecting the appropriate skill level for the whole period does not exist at present, and is unlikely to exist in the future. In general, the 1900-1940 period faces higher data limitations in terms of availability and quality. Argentina and Chile tend to have more and better data, while Venezuela is the country with less data and poorer quality in this period.
To assemble the three wage series in a comparable and consistent manner, I first set the levels in the core period (usually within 1965 and 1980) using data in Programa Regional del Empleo para América Latina y el Caribe (PREALC) (1982) and the ILO’s October inquiry (1936–1964; 1964–1982)Footnote 8 ; and, then, proceed to complete the series back and forth by using rate of growth of a selection of wage series from various sources. When alternative series are available for a country in a given period, my preferred option is that which better matches the skill definition and that offers a longer time coverage. To have wages in a single currency across countries I use purchasing power parity exchange rates to the U.S. dollar available for c.1970 (Economic Commission for Latin America (ECLA) 1978). See the Online Appendix for estimation details.
2.1. Level comparisons
Relying on growth rates to estimate levels outside the core period has the advantage of using available series from sources that are not always covering my three occupational categories in a given country or that cover different sub-periods. The main drawback to this procedure is that the margin of error of growth changes can accumulate over time, potentially creating problems with keeping the «true» wage differentials both within and between countries, especially as I go back in time. However, there is some additional evidence (not used in the construction of my wage series) on wages and GDP per capita that could serve the purpose of assessing the plausibility and internal consistency (both within and between countries) of the levels estimated outside the core period. This involves comparing my wage ratios for a given country with the alternative estimates, as well as checking the relative country positions in benchmark years. Table 2 offers a comparison of wage ratios around 1900 and 2000.
TABLE 2 WAGE RATIOS FROM SELECTED SOURCES AND YEARS
Notes: (1): Semi-skilled to unskilled wages (w 3/w 4), (2): skilled to unskilled wages (w 2/w 4), LC: local currency, n.a.=not available.
Economic Commission for Latin America and the Caribbean (ECLAC): proxies for w 2=professionals and technicians; w 3=mean income in the private sector; w 4=domestic servants.
Source: See main text.
First, there are daily wages in U.S. current dollars around 1895 and 1900 from establishment-level surveys compiled by the United States Department of Labor (USDL) (Reference Urrutia and Ruiz1900). I take the average wage paid to «farm laborers» and «carpenters and joiners» — which can be representative of unskilled and semi-skilled wages respectively — and calculate country ratios in 1895 or 1900, depending on data availability. Second, there are alternative wage ratios covering the three skill categories for the second half of the 19th century in Arroyo and Astorga (Reference Arroyo Abad and Astorga2017), which offer comparisons around 1900Footnote 9 . For the end of the 20th century there are ratios calculated from mean labour incomes according to occupational categories based on household surveys (Economic Commission for Latin America and the Caribbean (ECLAC) website) — but bear in mind that in this case the comparison is between wages and labour income (including fringe payments) calculated using different statistical sources.
Comparisons with USDL show relatively nearby (within the ±15 per cent interval) semi to unskilled ratios in Argentina, Chile and Colombia. For Brazil, Mexico and Venezuela this source shows higher ratios (outside the ±15 per cent interval). Those with Arroyo’s figures show nearby w 3/w 4 ratios in Argentina, Venezuela and Colombia (in this case within the ±20 per cent interval). My ratios for Mexico use Arroyo’s. As to w 2/w 4 ratios, there are nearby values in Argentina, Chile and Venezuela (within the±20 per cent interval)Footnote 10 ; but Arroyo’s ratio is significantly lower in Colombia (3.0 vs. 4.7). Comparison in 2000 show nearby w 3/w 4 ratios in all cases except Mexico (3.3 vs. 2.3). And for w 2/w 4 ratios, there are consistent values in Brazil, Colombia and Mexico, but significant discrepancies in Chile (3.7 vs. 5.4) and Venezuela (3.2 vs. 4.3).
Table 3 presents relative wages for the three skills categories and GDP per capita as well as my estimates of income per worker circa 1900 using Argentina as numeraire (so that absolute figures in U.S. dollars are only provided for this country). Also, for each variable, the countries are ranked from first to sixth position. The first comparison is between relative ratios calculated with wages sourced from the USDL (circa 1895) for unskilled farm workers and carpenters and those using my unskilled and semi-skilled wages around 1900. For farm labourers and my unskilled wage the relative ratios are within the ±15% interval in Colombia and Venezuela; while my estimates give higher relative ratios in Brazil, Chile and Mexico. A similar comparison between carpenters and my semi-skilled wages shows values within the ±15% interval in Brazil, Colombia and Venezuela; while my estimates give higher relative ratios in Chile and Mexico. The rankings show that relative positions in the LA-6 were broadly stable across unskilled wages, semi-skilled wages and the two income per head measures (Argentina 1; Brazil 5 or 6; Chile 2 or 3; Colombia 5 or 6; Mexico 4 or 5; Venezuela 3 or 4 — and an exceptional second position in the USDL data).
TABLE 3 COUNTRY HIERARCHY IN SELECTED VARIABLES CIRCA 1900
Note: Engineers: including railroad (r), marine (m), stationary (s) in Colombia and Mexico; r&s in Argentina and Brazil; r&m in Venezuela; m in Chile.
Sources: Farm labourers, carpenters and engineers from USDL (Reference Urrutia and Ruiz1900). Gross domestic product (GDP) per capita from Astorga et al. (Reference Astorga, Bérges and FitzGerald2005). Otherwise see the Online Appendix.
Table 3 also includes comparisons between highly skilled workers (engineers) around 1885 (the year with more data for the LA-6) from the USDL and my skilled wages around 1900. Despite differences in the comparing year and the skill level, this additional data can be used to check consistency in ratios and the country hierarchy in group 2. There are relatively similar ratios around 1 for Chile, Mexico and Venezuela in both sources, indicating that relatively skilled workers in those countries earned wages closer to their Argentine peers. Similar skilled wages across countries suggests that skills scarcity was a common feature at the turn of the last century. Note that the rankings implied by skilled wages has significant differences with those of semi and unskilled wages (where Argentina dominates the top position). All in all, these comparisons show that there is broad consistency between my series (and the calculated ratios) and alternative estimates, which supports the plausibility of the estimations.
3. WAGE DEVELOPMENTS
Figure 1 shows the evolution of the LA-6 for the unskilled and the EAP-weighted average wage. This is a story of considerable growth over more than 100 years albeit with periods of reversals as in the infamous lost decade of the 1980s.
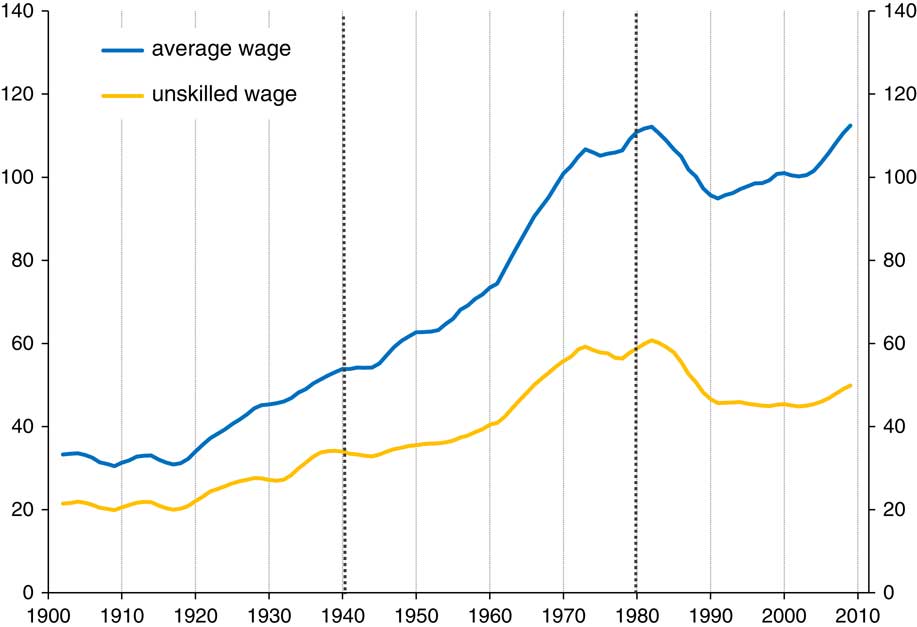
FIGURE 1 REAL WAGES IN THE LA-6, 1900-2011 (5-YEARS MOVING AVERAGES; U.S.$ PURCHASING POWER PARITY 1970 PRICES PER MONTH) Note: The LA-6 figures are simple averages. There are no data for Mexico between 1912 and 1919. Source: See the Online Appendix.
After two first decades characterised by relatively subdued wages, the 1920s witnessed the start of a process of sustained gains in the region amid a largely shared commodity boom. From 1920 up to 1960 the average wage rose steadily (an annual average rate of 2.0 per cent), and then accelerated to 1980 (2.2 per cent). Unskilled wages followed a similar pattern but with lower growth rates, 1.5 per cent to 1960 and then 1.6 per cent to 1980. The 1980s brought about average yearly falls of 1.1 per cent and 0.8 per cent in the average and the unskilled wage, respectively; and the 1990s saw a modest recovery in the average wage (up 0.2 per cent) but a continuation of the decline in unskilled wages (−0.5 per cent). The 2000s featured an acceleration in both the average (1.0 per cent) and the unskilled wage (0.8 per cent) driven by a commodity boom and increases in the official minimum wage in most countries (Moreno-Brid et al. Reference Moreno-Brid, Garry and Krozer2016). The turning points in around 1920, 1960, 1980, 1990 and 2000 mark the beginning of decades with a largely shared wage performance in the six countries: strong growth in the 1920s, 1960s and 2000s — except in Venezuela; and falls in the 1980s. By 2010 the LA-6 average wage returned to the peak of the early 1980s, but the unskilled wage was still at levels last seen in the mid-1960s. Comparing the outcomes in c.1901 and c.2010, the average wage rose by 254 per cent, and the unskilled wage by 147 per centFootnote 11 .
Table 4 summarises average annual growth in wages and income per worker for the three developmental epochs and in the overall period, as well as by decades. The early period is characterised by positive and moderate growth in both unskilled and average wages, with Colombia and Venezuela showing the best performanceFootnote 12 . The exception is negative growth in the Chilean average wage, which partly reflects a fall from unusually high wage levels of semi and skilled wages at the start of the last century amid a nitrate boom (Matus Reference Matus2009)Footnote 13 . The middle period brought about significant real gains in the average wage in Brazil (with annual growth of 2.2 per cent), Chile (1.7 per cent), Mexico (2.1 per cent) and Venezuela (2.5 per cent). Mexico and Venezuela experienced substantial advances in unskilled wages (which grew annually by 2.0 per cent and 2.9 per cent, respectively). The growth in unskilled labour was more moderate in Brazil (1.1 per cent) and Colombia (1.3 per cent), modest in Chile (0.3 per cent), and negative in Argentina (−0.7 per cent). In the last two countries, the lacklustre performance is largely the result of a sharp decline in the 1970s.
TABLE 4 GROWTH IN REAL WAGES AND INCOME PER WORKER IN SELECTED PERIODS (CONSTANT ANNUAL GROWTH RATES)
However, during the last two decades of the 20th century, the Debt Crisis, trade liberalisation and labour market reforms erased most of the gains achieved in the middle decades. Mexico (where the unskilled wage fell by an annual rate of −4.9 per cent, and the average wage rose by 1.7 per cent) and Venezuela (−3.3 per cent and −2.5 per cent) are clear examples of this setback. Chile stands out with positive annual growth of 3.3 per cent and 2.2 per cent in the unskilled and the average wage, respectively. The first decade of the 21st century is dominated by rising real wages supported by improved terms of trade — as in the 1920s — and rises in the minimum wage (particularly in Argentina and Brazil). The unskilled and the average wage rose strongly in Argentina, Brazil, Chile and, to a lesser extent, in MexicoFootnote 14 .
In all cases, growth between 1900 and 2011 in unskilled wages was lower than in the average wage; which, in turn, lagged behind advances in the income per worker (except, only marginally, in Argentina). This result translated into worsening secular income inequality (Astorga Reference Astorga2017a). Taking the decades as the unit of counting (a total of 65, once the 1910s in Mexico is excluded), in 66 per cent of cases the growth in unskilled wages was lower than in the average wage, and in 68 per cent of cases the growth in average wages was lower than in income per worker. And in the middle period (a total of 24 cases) both percentages rise to 71 per cent; a result that points to the influence of factors such as labour surplus and skill-biased technical change in curbing relative growth in unskilled wages.
3.1. Wage share of income
Figure 2 includes income per worker (y) and a proxy of the wage share of income in the LA-6Footnote 15 . Because my wage series excludes highly skilled wages and fringe payments to labour, these estimates should be taken as a lower bound of a properly calculated wage share. A look at the average trajectories of both variables shows that prior to 1980 the steady growth in income per worker — only interrupted by the Great Depression — was, as a norm, accompanied by falling trends in the wage shareFootnote 16 . This holds true with only two exceptions: during the 1920s and between 1955 and 1965 when both variables grow in tandem (amid strong real wage growth), moving the functional distribution of income in favour of labour. The wage–share peak in the early 1930s is a one-off outcome associated with a drastic fall in overall income that hit more than proportionally property income. The last two decades of the 20th century are dominated by coinciding falling trends, which worsen functional inequality further, but this time amid a reduction in living standards.
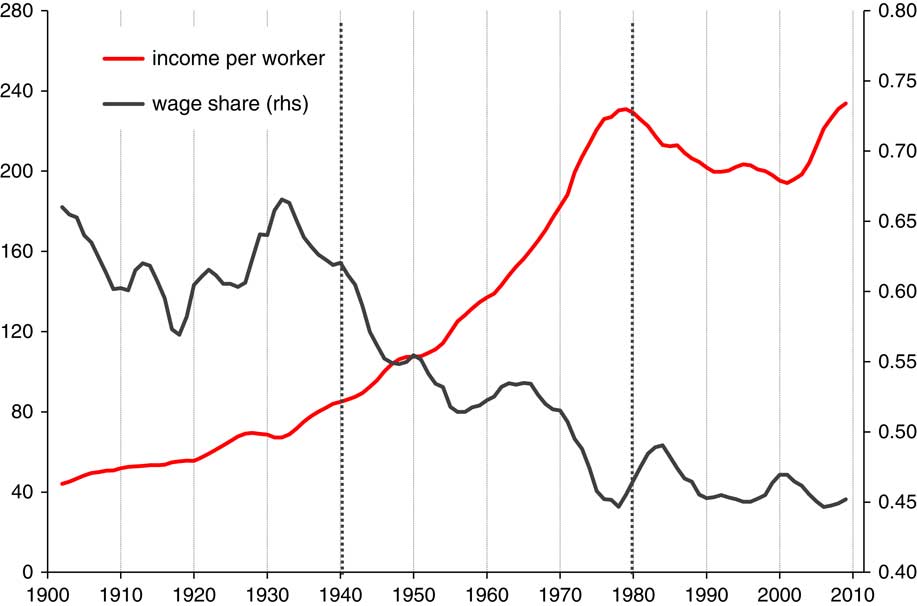
FIGURE 2 INCOME PER WORKER AND WAGE SHARES IN THE LA-6, 1900-2011 (5-YEARS MOVING AVERAGES; LHS: U.S.$ PURCHASING POWER PARITY 1970 PRICES PER MONTH; RHS: SHARES) Note: There are no data for Mexico between 1912 and 1919. Source: See the Online Appendix.
Overall, the LA-6 average wage share was relatively high and with large fluctuations in the early periodFootnote 17 , experienced a secular falling trend in the middleFootnote 18 and settled at a lower level in the final period. The LA-6 average wage to income ratio (w/y) — not shown — exhibits a similar pattern. Over the century, the wage share fell from about 65 per cent around 1905 to 45 per cent around 2010 (a drop of 30 per cent); with most of this reduction occurring between 1940 and 1980 (a drop of 23 per cent). I would expect this long-term trend pattern to be robust to the use of more comprehensive labour income estimates. However, the underestimation of share levels is likely to be more pronounced during the second half of the last century, as both wages of professionals and fringe payments are also likely to have increased their relative weight on income.
To be sure, as shown in Figure A1 in the Appendix, there are significant differences across the six countries in the timing of the turning point in wage shares: Brazil in the mid-1930s; Venezuela in the early 1940s; Chile in the mid-1940s (though there is a peak in the mid-1950s); Argentina in the early 1950s; and Mexico in the early 1960sFootnote 19 . Colombia is an odd case with a steady decline from the early 1920s to the mid-1970s. But in all cases, a falling trend had already established itself in the 1960s. Falling wage shares is a well-known fact in both developed and developing regions since the 1970s or so, and has been attributed primarily to globalisation, the increased role of financial activity, and labour market de-regulation (Stockhammer Reference Stockhammer2013). But this evidence suggests that this pattern started earlier in the LA-6 (specially in Brazil, Colombia and Venezuela). This needs a closer examination.
Developments during the middle period are likely to be the result of a combination of competing underlying forces largely associated with changing labour institutions, industrialisation under protection and internal migration, which net effect undermined the relative position of wages against property incomeFootnote 20 . First, there were institutional developments in the labour market associated with the State-led industrialisation model that favoured wage earners. Labour unions saw an increase in their bargaining power, particularly when governments sought to widen their support among the urban working class. And the introduction of minimum wage legislation and pro-labour policies (particularly in Argentina and Mexico) supported rising trends in unskilled wages and wage compression during the 1950s and 1960s.
Second, under import-substitution industrialisation, especially in the 1950s and the 1960s, the dominant trend in the LA-6 was rising inequality (despite a more mixed record in wage differentials). It widened in Argentina (after a trough around 1950), Brazil, Chile, Colombia and Venezuela (up to the early 1960s) driven by a growing income share of the top EAP group (Astorga Reference Astorga2017a). These were times of unprecedented rates of capital accumulation — amid skill-biased technical change — driven by private investment aimed at meeting the increasing domestic demand for consumption industrial goodsFootnote 21 . Therefore, it is of little surprise that profits of firms operating under protection soared. However, the relative impact on property income is complex because the combination of industrialisation with a decline in agriculture generated winners (the new industrialists) as well as losers (the traditional landlords)Footnote 22 . Also, the State became a key economic actor via state-owned enterprises operating in a wide range of industries (e.g. mining, utilities, and capital and intermediate goods).
Third, rapid urbanisation in the context of surplus labour was a force putting downward pressure on wages. Although the timing of the demographic transition with falling participation rates in the 1950s and 1960s — Argentina is an exception — should have offset part of this pressure and reinforced workers’ position, the turnaround circa 1970 and subsequent rapid increase in participation rates amid limited education and rising unemployment weaken wages. With a significant expansion of the urban workforce the vested interests of the unionised workers were more difficult to maintain. This undermined the internal stability of unions and raised tensions between the conflicting objectives of keeping formal wage levels and job creation (Frankema Reference Frankema2009, Ch. 6).
4. WAGE SKILL PREMIUMS
Figure 3 presents country charts with wage skill premiums (w 2/w 4 ratios) together with polynomial lines to capture secular trends. Table A1 in the Appendix includes estimates by country every 5 years. There is significant diversity in trends and fluctuations. Argentina shows a rising long-term trend and Colombia a falling one. The other four economies experienced significant changes in trends (m-shaped in Brazil and Chile) with premiums in 2000 similar to those estimated in 1900. These patterns in trajectories and fluctuations in premiums are likely to be associated with differences in these economies in terms of factor endowments, integration in the world economy, structural change and institutional transformations as discussed in the introduction. Although a comprehensive and rigourous assessment of the relative contribution of these factors is beyond the limits of this work, in this section I use graphical analysis to explore the link between three measures related to fundamentals and variations in wage gaps.
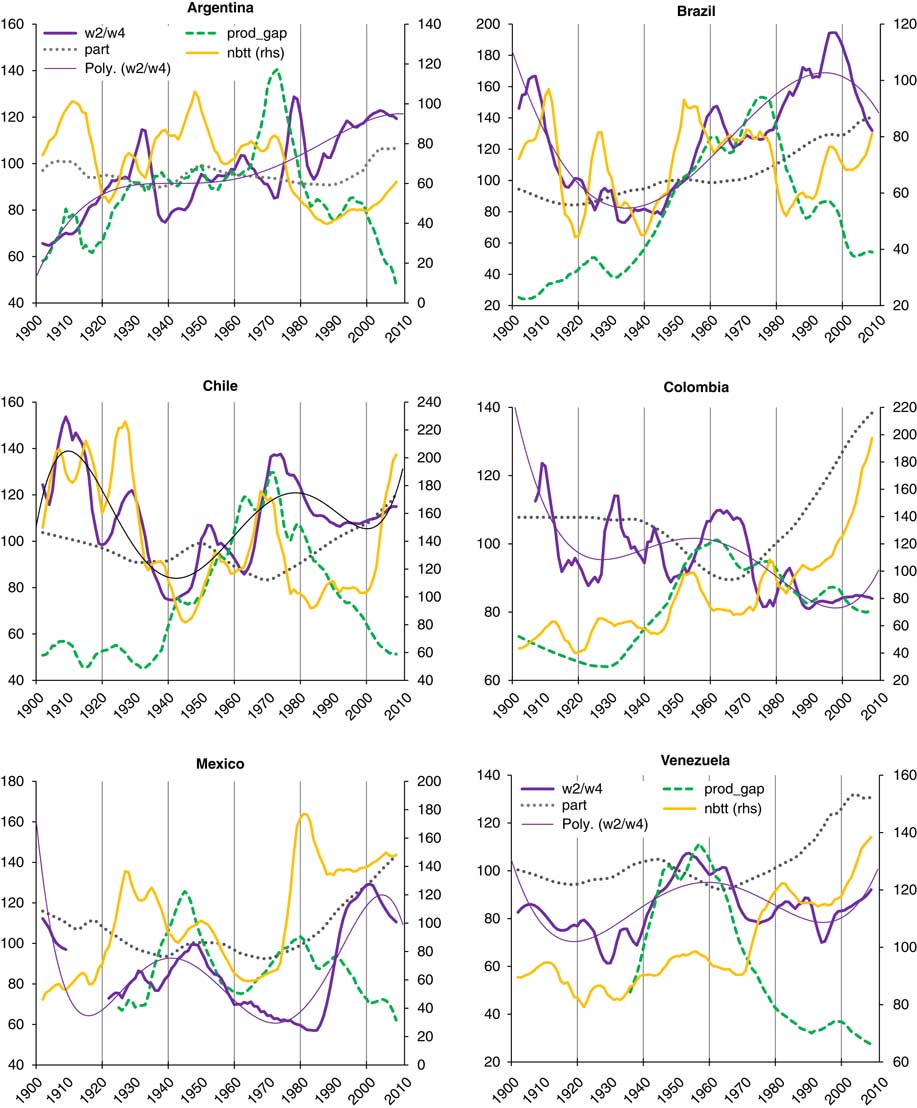
FIGURE 3 SKILL PREMIUMS AND KEY DRIVERS IN THE LA-6, 1900-2011 (5-YEARS MOVING AVERAGES; INDICES, 1950=100) Note: Net barter terms of trade (nbtt) in Venezuela is in logs to facilitate the plotting of the series. Sources: Terms of trade for Brazil from Instituto Brasileiro de Geografia e Estatística (IBGE) website, Chile from Díaz et al. (Reference Díaz, Lüders and Wagner2005). For skill premiums see the Online Appendix. Otherwise Montevideo-Oxford Latin American Economic History Database.
First, a crude participation rate (the ratio of EAP to population, or part in Figure 3) to capture the demographic transition; second, the ratio of value-added per worker in manufacturing relative to agriculture (or sectoral productivity gap, prod-gap) to account for industrialisation (see also urbanisation rates in Table 1); third, the net barter terms of trade (nbtt) to reflect changes in relative prices in foreign tradeFootnote 23 . This is complemented with references to consumer price inflation (particularly hyperinflation episodes), labour market institutions and advances in education (supply of skills). My crude participation rates can only inform about secular trends as the construction of the series relies on interpolation between census data; whereas prod-gap (where interpolation is used in calculating the sectors’ EAPs) can account for secular trends and inflection points. The terms of trade can potentially shed light on both trends and shorter-term fluctuations in skill premiums as both series are calculated with annual data.
Table 5 summarises pair correlations by country in selected periods. Both series are 3-year-centred moving averages to track better associations in short-term trends. Bear in mind that because my wage series do not discriminate between export and non-export sectors or between tradable and non-tradable ones, they lack the necessary detail to inform accurately about potential mechanisms at work such as the Stolper–Samuelson effect. Therefore, correlations between terms of trade and premiums should be interpreted with caution.
TABLE 5 WAGE SKILL PREMIUMS AND THE TERMS OF TRADE (PAIRED CORRELATIONS BETWEEN 3-YEARS MOVING AVERAGE SERIES)
Notes:
1Averages in 1900-2011 and 1900-39 start in 1920.
2To deal with a discontinuity in the terms of trade in 1973, the 1940-79 value is the average of 1940-72 and 1973-79; and 1900-2011 is the average of the three periods.
Sources: Terms of trade for Brazil from IBGE website, Chile from Díaz et al. (Reference Díaz, Lüders and Wagner2005). For skill premiums see the Online Appendix.
Judging by the high correlations between both variables over the overall period as well as the sub-periods, the terms of trade appear as a key variable in explaining both trends and fluctuations in wage premiumsFootnote 24 . However, there are important differences across countries and periods in the direction of this link: opposite moves dominate in Argentina and Colombia; whereas simultaneity dominates in Chile, Venezuela and, to a lesser extent, in Brazil and Mexico. Although explaining such a diversity is beyond the scope of this study, one promising candidate is the nature of the dominant commodities, particularly their skills intensity. For instance, the export sector in Colombia during most of the time was dominated by coffee production in small holdings — and wide spread geographically — and with a relatively intensive use of unskilled labour (Thorp Reference Thorp1991, Ch. 3). The negative and high correlation over the overall period (−0.58) suggests that terms of trade gains benefited the unskilled more than proportionally, resulting in opposite moves with wage premiums. By contrast, when minerals and oil were the dominant commodities (Chile, Mexico and Venezuela), an export sector relatively intensive in the use of capital and skilled labour may have created the conditions for synchronised trends. The remainder of this section discusses the association between wage premiums and key drivers in each of the three developmental epochs.
4.1. Early period (1900-1939)
With the exception of Argentina, the early period is dominated by a secular reduction in wage premiums, especially clear during the end of the first globalisation wave (1900-1914) as would be expected in predominantly skills-scarce economies. In Argentina, the productivity gap and the premiums show rising trends from 1900 up to the early 1930s. This synchronised move is also consistent with rapid urbanisation in the period. Also, sizeable labour immigration may have prevented unskilled labour from receiving the benefits of the opportunities created by the expansion in foreign demand (Arroyo and Astorga Reference Arroyo Abad and Astorga2017). Narrowing premiums in the remaining countries where prod-gap can be calculated are difficult to reconcile with the behaviour of the drivers at hand. The association with productivity differentials shows mixed patterns: opposite trends in Brazil, and synchronised trends in Chile (falling trends) and Colombia (constant). But, with the exception of Chile, these early decades were not characterised by significant strides in industrialisation (particularly when compared with developments in the middle period) and, thus, are not likely to show a close association between both variables.
Participation rates are roughly constant in Argentina, Brazil, Colombia and Venezuela, and equally are unlikely to have been an important factor behind changes in premiums in these countries in the early decadesFootnote 25 . In Chile and Mexico, falling trends in participation are accompanied by falling premiums, suggesting that other factors were more influential. Meanwhile, there were significant advances in average years of education in Chile (also in Argentina), but schooling improvements were limited in the other four countries (see Table 1). And whilst changes in labour market institutions (e.g. less labour coercion and more integrated markets) could have played a role in reducing premiums in Brazil, Chile and Venezuela, the dominant force leading the process may be found in a downward trend in the terms of trade.
A shared commodity cycle (a boom in the 1920s and a bust in the first half of the 1930s) offers a good opportunity to examine the degree of country commonality in the response of skill premiums to changes in the terms of trade and, more generally, to developments in the export sector. First, widening premiums dominated in the export boom of the1920s (rising nbtt) — suggesting that exports were relatively skill intensive; then, narrowing premiums during the first half of the 1930s (Venezuela is the exception, but in this case I cannot rule out that it is partly caused by poor-quality data). However, over the whole early period, there is a contrast between a negative correlation in Argentina (−0.62) and its absence in Colombia, on the one hand, and relatively strong and positive correlations in Brazil, Chile and Venezuela (0.50, 0.58, 0.41, respectively) on the other.
4.2. Middle period (1940-1979)
The graphical inspection of the middle period shows dominant rising trends in premiums particularly during the 1940s and 1950s, as would be expected in skills-scarce economies adopting protectionist policies. There are also trends and peaks in premiums broadly in line with the timing of the structural change (as reflected in the productivity gaps and the urbanisation rate) in Brazil (peak in early 1960s), Chile (peak in the 1970s), Colombia (peak in the 1960s), Mexico (peak in the mid-1940s) and Venezuela (peak in the 1950s). Also, Brazil, Chile and Venezuela offer good examples of synchronised trends in both variables. This gives support to the influence of a Kuznets–Lewis process of an acceleration in urbanisation and industrialisation amid relative skills scarcity creating conditions for a rise in premiumsFootnote 26 .
These are years of high population growth and falling trends in participation rates up to around 1970 when there is a change in direction. A combination of a fast-growing labour force and a relatively slow rate of job creation in the urban formal sector — particularly post-1970 — resulted in a rapid increase in urban informality (largely in the service sector) with relatively low productivity and wages (Bulmer-Thomas Reference Bulmer-Thomas2013). According to PREALC (1982) the share of the informal urban population on the EAP in the LA-6 rose from 10 per cent in 1950 to 15 per cent in 1980. Although there were more widely spread educational advances in the LA-6 during this period (especially in Mexico and Venezuela), this effort in itself, was not enough to curb increases in skill premiums.
In contrast with the country commonality shown in the 1920s and, to a lesser extent, in the early 1930s, the middle decades exhibit a more diverse picture in the association between premiums and terms of trade. Opposite trends continued to prevail in Argentina (a correlation of −0.67) and Colombia (−0.51); synchronised rising trends (except in the early 1960s) in Brazil and Chile (correlations of 0.58 in the period). In Mexico and Venezuela both variables move in tune upward with correlations of 0.19 and 0.60, respectivelyFootnote 27 . The relatively high correlations in this period indicates that, despite the dominance of protectionist policies, external conditions and the export sector continued to play an important role in wage setting. Also, the move from a period of relatively trade openness to another of de-globalisation did little to alter the direction and the strength of the association between premiums and the terms of trade; which suggests limited changes in the skill intensity of the export sectors. Meanwhile, as expected, bouts of very high inflation or hyperinflation are associated with hikes in premiums in Argentina (early 1960s and late 1970s), Brazil (early 1960s) and Chile (early 1950s and early 1970s). The paired correlations between premiums and inflation for these three countries in the middle period are 0.60 in Argentina and Chile and 0.65 in Brazil; whereas similar correlations are weak in the remaining three countries.
These are also decades of changes in labour institutions with mixed distributive results. The actions of governments and unions supporting wage austerity subdued upward trends in most countries during the 1940s — especially during the war years (Roxborough Reference Roxborough1984), whilst official minimum wages and pro-labour policies (particularly in Argentina, Chile and Mexico) during the 1950s and 1960s favoured rising trends in unskilled wages and wage compression. For instance, the narrowing trend in skill premiums in Mexico from around 1950 has been attributed to favourable minimum wage policies and high rates of unionisation (Márquez Padilla Reference Márquez Padilla1981). However, towards the end of the middle period the military regimes in Argentina (1976-1983), Chile (1973-1990), and Brazil (1963-1980) effectively restricted — or banned — the action of unions, increased flexibility in the labour market, and reduced the coverage of the minimum wage as part of the reform agenda (Morley Reference Morley2000).
4.3. Final period (1980-2011)
The closing two decades of the 20th century witnessed the implementation of structural reforms and the shift from relatively closed, state-dominated economies, to ones more open and market oriented. In a context of relatively short supply of skills and rising labour informality, trade liberalisation encouraged the expansion of skill-intensive export activities and, as a result, skill premiums widened (Stallings and Peres Reference Stallings and Peres2000; Székely and Sámano Reference Székely and Sámano2012). My evidence shows widening premiums in Argentina, Brazil and Mexico (after the 1982 Debt Crisis) and Venezuela. Also, hyperinflation bouts in Argentina (1970s, 1980s), Brazil (1980s, early 1990s) are consistent with hikes in wage gaps.
The final period is dominated by falling trends in the productivity gap and rising ones in skill premiums. But these are decades with highly urbanised societies, where the dynamics associated with internal migration are unlikely to have played a significant role in determining premiums. Indeed, after 1980 or so the dominant force for structural change was the shedding of labour from higher productivity manufacturing to lower productivity services (with a significant presence of labour informality), resulting in de-industrialisation and a move towards higher wage inequality. And the increase in participations rates — particularly female rates — undermined further unskilled wages. Rising skill premiums were also supported by educational efforts lagging behind the increase in the demand for highly skilled labour (Duryea and Szekely Reference Duryea and Szekely2000). Institutional changes also played their part in explaining widening premiums. Unionisation continued its decline across the region, averaging only 11 per cent of the workforce by 2005 compared to a peak of 23 per cent in the 1970s and official minimum wages experiences a significant setback (Roberts Reference Roberts2012). The effect of these underlying trends in the labour market were compounded by a wave of deregulation and privatisations that shifted formal employment to an already large informal sector (PREALC 1990).
Terms of trade in the 1980s and 1990s were dominated by adverse movements particularly in Argentina, Brazil, Mexico and Venezuela. In these countries, with the exception of Mexico, the correlation between premiums and terms of trade is positive (Argentina 0.25, Brazil 0.78, Venezuela 0.51), suggesting that negative external shocks affected skilled wages more than proportionally. In Mexico, both series grew in tandem during the 1990s, but opposite moves in the early 1980s determine the negative correlation shown in Table 5. Chile and Colombia experienced limited variations in their terms of trade and show negative correlations with their wage premiums (of −0.47 and −0.74, respectively). The 2000s was a decade of a shared Chinese-driven commodity boom (which eluded Mexico, where exports are largely manufactures) supporting improvements in employment and real wages. Governments across the region — largely of left-wing orientation — implemented more progressive social spending. They also engaged in a more active role in the labour market, raising the minimum wage or taking a more pro-union stance (Gasparini and Lustig Reference Gasparini and Lustig2011). These are years of rising terms of trade with a strong and negative correlation with premiums in Argentina (−0.36), Brazil (−0.85), Colombia (−0.27) and Mexico (−0.71) indicating that in these countries the commodity boom favoured especially the unskilled; but strong and positive in Chile (0.96) and Venezuela (0.92)Footnote 28 .
5. CONCLUSIONS
This paper offers a long-run view of Latin American wage developments based on 3 yearly wage series defined according to occupational categories. When assembling these series, special attention was paid to maintaining consistency over time and comparability across countries. Comparisons made with alternative wage and income per capita data around 1900 and 2000 show broad consistency and support the plausibility of the estimations. A virtue of this work is a wide country coverage over a long horizon which makes it possible to identify secular trends and turning points as well as to unveil regional patterns; but a drawback is that it cannot offer a detailed account on wage developments in a specific country or period. Therefore, my findings need to be complemented — and confirmed — by more in-depth studies at a country level. There remain data challenges ahead, such as to extend the coverage to a larger group of countries and to allow for a clearer distinction of key wage dichotomies: rural–urban, male–female, white collar–blue collar and tradable–non tradable.
There were significant advances in real wages especially during the 1920s, the 1960s and the 2000s. For the LA-6 average, the real average wage increased 254 per cent between c.1901 and c.2010 (and 232 per cent up to 1980). For the unskilled, the rise for the whole period was 147 per cent (183 per cent up to 1980). In general, the middle period includes the higher growth rates for the average wages, but mixed results for the unskilled wage (only in Colombia, Mexico and Venezuela are the advances in this period better than in the first period). The 1980-2011 period registered the worst wage outcome (Chile is the exception), despite the growth acceleration in the 2000s.
Real growth between 1900 and 2011 in unskilled wages was lower than in the average wage; which, in turn, lagged behind advances in the income per worker. This result is at the root of worsening secular income inequality in the region. Meanwhile, my proxy for the labour share of income for the LA-6 was relatively high in the early period — but with a significant decline during the end of the first globalisation wave, consistent with a drop in the wage-to-rent ratios. It then experienced a falling trend in the middle period, and settled at a lower level in the final period. Although falling wage shares is a well-known fact in both developed and developing regions since the 1970s, my evidence indicates that this decline started earlier in Latin America, likely to be associated with the combined effects of the dynamics of protected industrialisation and the demographic transition. But there is an important contrast between the decades of the 1950s and 1960s and those of the 1980s and 1990s. In the former, declining trends are the result of growth in property income outpacing strong growth in wages amid industrialisation; in the latter, they reflect a fall in wages outpacing that in property income under de-industrialisation.
This new evidence indicates that a number of fundamental forces influenced developments in skill premiums, with the timing, intensity and direction of the link — acting in a reinforcing or an opposing fashion — varying across the six countries. Structural change dynamics acted earlier in Argentina and later in the other five countries (usually in the middle period) displaying — as expected — synchronised trends in sectoral productivity gaps and premiums. Rising trends in participation rates after 1970 amid increased labour informality are also in line with rising premiums. The post-1960 years witnessed major advances in average years of schooling and in skill formation. But these are also times dominated by widening premiums, indicating that efforts in expanding education were not enough to produce a fall in wage differentials.
The terms of trade are a key variable in accounting for both longer-term trends and shorter-term fluctuations in premiums. It is indeed the only driver that consistently shows explanatory power over time and across the six countries. This is a striking result. But it is also puzzling, as there are important differences across countries and periods in the direction of the link: opposite moves dominate in Argentina and Colombia; simultaneity dominates in Chile, Venezuela and, to a lesser extent, in Brazil and Mexico. Therefore, the composition of exports and their skill intensity seems to matter more than the country’s level of development. This interpretation is consistent with observed differences in trajectories in premiums between economies with agricultural-based export sectors demanding primarily unskilled labour (e.g. Colombia), on the one hand; and, on the other, with mining economies relatively intensive in capital and skills (e.g. Chile). Moreover, these contrasting outcomes are at odds with the idea of a uniform association between the terms of trade of commodity exporters and their wage performance as implied by the variant of Prebisch–Singer hypothesis that focusses on the labour market (Ocampo and Parra-Lancourt Reference Ocampo and Parra-Lancourt2010)Footnote 29 . However, more research is needed (based on more detailed wage data) to discriminate between particular mechanisms at work behind the empirical diversity in the associations between terms of trade and wages (e.g. labour surplus and the Stolper–Samuelson effect).
There are some policy implications worth mentioning. The significant reduction in the LA-6 wage share since the 1950s, together with limited advances in unskilled wages, confirms a well-known distributional problem in Latin America and reinforces the need to redistribute income from top to bottom — a pending task in the region. In addition, the prevalence of low levels of unskilled wages — by the region’s own standards — at the start of the 2010s should also be a main concern. This no doubt calls for renewed efforts at improving education particularly at primary and secondary level. But also for the continuation of recent policies supporting minimum wages; an effective way to boost both earnings at the bottom and the wage share of income. The potential of improved terms of trade for reducing income inequality indirectly via employment generation and the funding of progressive social programmes has been evident during the commodity boom of the 2000s. But the historical evidence also shows that movements in the terms of trade have had a strong influence — through complex channels — on skill premiums. Thus, efforts aimed at curbing inequality in the region should also pay attention to this direct distributional effect.
This study includes three measures that can inform about advances in well-being: GDP per capita, income per worker, and the real average wage. Although the first two measures are the most commonly used in long-term studies, there are good reasons to focus instead on real wages for comparative growth performance as they reflect better the standard of living of ordinary workers (Williamson Reference Williamson1999). The LA-6 GDP per capita rose by 537 per cent from c.1901 to c.2010 vs. a 440 per cent increase in income per worker (a 22 per cent gap). Changes in the crude participation rate is by far the most important factor contributing to this discrepancyFootnote 30 . According to my calculations, around 1900, on average, one in three persons in the LA-6 was economically active; by 2010 the proportion rose to just under one in two. Meanwhile, the growth rate in income per worker was above the 254 per cent rise in the average wage (a 60 per cent gap)Footnote 31 . The latter discrepancy is explained by the combined effect of a 226 per cent rise in the mean income in group 1 and changes in the group composition of the labour force. Whilst in c.1901 those in group 1 represented, on average, 5 per cent of the EAP in the LA-6; in c.2010 they accounted for 15 per cent of the EAP. Therefore, the top EAP group — with a substantially higher mean income — saw a significant expansion in size over the period, which resulted in higher growth in overall income per worker than in the average wage. These significant differences between the growth performance of the three measures (and, indeed, between earnings by occupational groups) means that any conclusions on advances in living standards — as well as on the extent of the region’s catching up with rich economies — will partly depend on the measure chosen.
SUPPLEMENTARY MATERIALS
For supplementary material/s referred to in this article, please visit https://doi.org/10.1017/S021261091700009X
APPENDIX
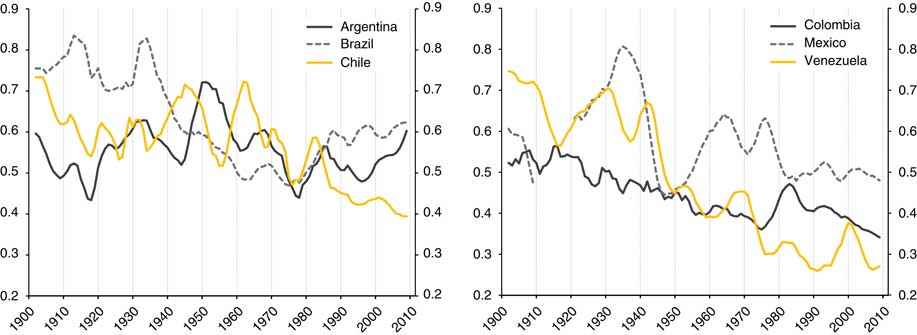
FIGURE A1 WAGE SHARES OF INCOME BY COUNTRY (5-YEARS MOVING AVERAGES; SHARES). Notes: Shares between 1900 and 1905 in Brazil and Chile are equal to the 1906 value. Outliers have also been removed in Mexico in 1932 and 1934-36, and in Venezuela in 2007 and 2008. Source: See the Online Appendix.
TABLE A1 SKILL PREMIUMS EVERY 5 YEARS BY COUNTRY