


Non-communicable diseases are now the biggest cause of deaths worldwide, representing an important burden for individuals, governments and societies(1). Overweight and obesity are major risk factors for a number of non-communicable diseases, including CVD, diabetes and cancers. In 2016, 39 % of adults developed an overweight and 13 % an obesity worldwide, a prevalence which has almost tripled since 1975(2). Nutrition-related behaviours implicated in the onset of overweight or obesity can be targeted through primary prevention interventions(1,Reference Lim, Vos and Flaxman3) . In this context, public health authorities are implementing policies that promote healthier diets, for example, front-of-pack nutrition labelling, taxes on unhealthy foods, regulation of health and nutrition claims, restrictions on advertising to children and programmes which promote healthier product reformulation(4).
Nutrient profiling, defined as ‘the science of categorising or ranking foods according to their nutritional composition’, allows characterisation of different food products as more or less healthy(Reference Scarborough, Rayner and Stockley5). Nutrient profiling relies on two assumptions: (i) the health of individuals is related to healthiness of the diet, and (ii) the healthiness of the diet is in turn affected by the healthiness of the foods included in the diet(Reference Rayner6). Nutrient profiling is frequently used to underpin policies to promote healthier diets, by modifying the food environment and the eating behaviour of populations(Reference Sacks, Rayner and Stockley7,Reference Labonté, Poon and Gladanac8) . In 2004, a nutrient profiling system (NPS) was developed in the UK by the Food Standards Agency (FSA) for the purpose of regulating advertising to children(Reference Rayner, Scarborough and Lobstein9). This NPS assigns a score for the overall nutritional quality of a food, balancing components which should be limited in the diet (i.e. energy, saturated fats, sugars and Na) with components that are encouraged to be consumed (i.e. proteins, fibres, fruits, vegetables and nuts). The original FSA-NPS has been validated in several studies, demonstrating its ability to discriminate the nutritional quality of food products and its applicability in public health measures(Reference Scarborough, Rayner and Stockley5,Reference Rayner6,Reference Julia, Kesse-Guyot and Touvier10–Reference Scarborough, Boxer and Rayner12) . Later, adaptations of this system were made for specific applications in other jurisdictions. In 2013, the Nutrient Profiling Scoring Criteria (NPSC) developed by the Food Standards Australia New Zealand was incorporated into legislation in Australia and New Zealand for the purposes of determining whether or not a product is eligible to display a health claim(13). In 2014, it was adapted further in Australia and New Zealand by a multi-stakeholder committee to underpin the government-endorsed voluntary Health Star Rating front-of-pack nutrition labelling system. In France, it has also been adapted for use in front-of-pack nutrition labelling, by the High Council of Public Health for the Nutri-Score system (HCSP-NPS).
In the validation process of NPS, and especially in the framework of non-communicable diseases prevention, it appears essential to investigate the potential association of these NPS with health. An individual dietary index directly based on the original FSA-NPS applied at the food level has been developed to reflect the overall nutritional quality of the diet at an individual level(Reference Julia, Touvier and Méjean14) and then adapted to correspond to the HCSP-NPS. It has been shown that a higher dietary index based on this latter NPS, reflecting a lower overall diet nutritional quality, was associated with an increased risk of various adverse health outcomes in different French and European cohorts (e.g. cancers, CVD, the metabolic syndrome and weight gain)(Reference Adriouch, Julia and Kesse-Guyot15–Reference Julia, Ducrot and Lassale21). No study has simultaneously investigated the associations of the original FSA-NPS and its derivatives with health outcomes and specifically, weight status. The present study aimed to investigate four NPS (original FSA-NPS, NPSC, Health Star Rating-NPS and HCSP-NPS) and their associations with weight gain, overweight (including obesity) and obesity, in a large cohort of French participants from the general population.
Materials and methods
Population study
Participants of the present study were recruited from the NutriNet-Santé cohort, launched in France in 2009 to investigate the associations between nutrition and health as well as the determinants of dietary behaviours and nutritional status. The NutriNet-Santé study has been described in detail elsewhere(Reference Hercberg, Castetbon and Czernichow22). At inclusion and during the follow-up, participants are invited to complete a set of questionnaires on a dedicated website, including data on dietary intakes (repeated 24 h dietary records), anthropometric measurements, health events, socio-demographic characteristics and physical activity (International Physical Activity Questionnaire(Reference Craig, Marshall and Sjöström23)). Socio-demographic data collected at baseline included sex, age, educational level, level of monthly income, marital status and smoking status(Reference Vergnaud, Touvier and Méjean24). The NutriNet-Santé study is conducted according to the Declaration of Helsinki guidelines. It was approved by the Institutional Review Board of the French Institute for Health and Medical Research (IRB Inserm no. 0000388FWA00005831) and the ‘Commission Nationale de l’Informatique et des Libertés’ (CNIL no. 908450/no. 909216). The NutriNet-Santé study is registered in ClinicalTrials.gov (NCT03335644). Electronic informed consent is obtained from each participant.
Anthropometric measurements
At inclusion and each year of the follow-up, participants are invited to self-report information on height and weight. Web-based self-reported anthropometrics have been demonstrated to be valid against a traditional paper-and-pencil anthropometrics questionnaire(Reference Touvier, Mejean and Kesse-Guyot25) and face-to-face declarations, using notably κ statistics and percentage agreement (i.e. concordance)(Reference Lassale, Peneau and Touvier26). BMI was calculated as the ratio of weight in kg to the square of height in m (kg/m2). Overweight (including obesity) was defined by the WHO as BMI ≥ 25 kg/m2 and obesity as BMI ≥ 30 kg/m2(27).
Dietary data
At inclusion, participants were invited to complete three non-consecutive web-based dietary 24-h records, randomly assigned over a 2-week period (two weekdays and one weekend day), which have been tested and validated against an interview by a trained dietitian and against blood and urinary biomarkers(Reference Touvier, Mejean and Kesse-Guyot25,Reference Lassale, Castetbon and Laporte28,Reference Lassale, Castetbon and Laporte29) . Participants were asked to declare all foods and beverages consumed during the main meals or any eating occasion on the recording day and self-estimate portions using validated photographs, usual containers or specific quantity(Reference Le Moullec, Deheeger and Preziosi30). Mean daily intakes were estimated using a published French food composition database(Reference Arnault, Caillot and Castetbon31). Amounts consumed from composite dishes were estimated using French recipes validated by food and nutrition professionals. Dietary underreporting was identified on the basis of the method proposed by Black, using the BMR and Goldberg cut-off (with a value of physical activity level = 1·55), and energy under-reporters were excluded from the analyses (n 14 170)(Reference Black32).
Nutrient profiling systems (at the food level)
The four NPS investigated in the present study and their methods of calculation are described in detail in the online Supplementary material.
The original Food Standards Agency nutrient profiling system
The original FSA-NPS, developed in 2004–2005 in order to regulate advertising to children in the UK, relies on a scoring system based on the nutritional composition of a food or beverage per 100 g/100 ml. At the food level, the algorithm allocates positive points, from 0 to 10, for the amount of unfavourable nutrients (energy (kJ), saturated fat (g), total sugars (g) and Na (mg)), yielding a score for unfavourable components from 0 to +40. Then, negative points, from 0 to 5, are allocated for the amount of favourable components in the food (fruits, vegetables and nuts (%), fibre (g) and protein (g)), yielding a score for favourable components from 0 to −15. However, when the sum of negative components points is higher than 11, the positive points from the proteins component are not taken into account. The final score, corresponding to the sum between the negative and positive components scores, is a discrete continuous scale from −15 (for the foods with highest nutritional quality) to +40 points (for the foods with lowest nutritional quality)(Reference Rayner, Scarborough and Lobstein9). A higher score reflects a lower nutritional quality food or beverage. The nutrient profile is calculated using the same algorithm for all food categories and beverages.
The Food Standards Australia New Zealand Nutrient Profiling Scoring Criterion
The NPSC was developed in 2013 by the Food Standards Australia New Zealand to regulate eligibility of foods to display health claims in Australia and New Zealand. The main difference between the NPSC score and the original FSA-NPS is the addition of an extra category for oils, spreads and cheese and a category for beverages(33). Baseline points for foods in this extra category for oils, spreads and cheese were extended linearly to 11 points for energy, 30 points for saturated fat, and 30 points for Na. The scoring scales for baseline nutrients for other foods and beverages remained unchanged, that is, maximum 10 points. Additional changes to the original FSA-NPS included enabling starchy vegetables to score fruit, vegetable, nut and legume points (reflecting national dietary guidelines); amending the eligibility cap to score protein points (13 points instead of 11) and increasing the number of points scored by a food that was 100 % of fruit, vegetable, nut and legume (8 points instead of 5); and increasing the starting point for total sugar (from 4·5 to 5 g/100 g) to ensure plain milks were eligible to display health claims.
The Health Star Rating nutrient profiling system
The Health Star Rating-NPS was adapted from the NPSC by a multi-stakeholder committee with guidance from the Food Standards Australia New Zealand for the purpose of the Health Star Rating system, a government-led voluntary front-of-pack nutrition labelling system implemented in Australia and New Zealand since 2014. In the Health Star Rating-NPS, products are assigned to one of six categories (dairy beverages, other beverages, dairy foods, oils and spreads, cheese and processed cheese, all foods that are not included in previous categories). The NPSC scoring for oils and spreads, cheese and processed cheeses was maintained; however, the scoring scales for baseline nutrients for dairy and non-dairy foods/beverages were extended to 11 points for energy, 30 points for saturated fat, 22 points for total sugars and 30 points for Na; the scoring scale for fruit, vegetables, nuts and legumes was expanded from 5 to 8 points, whilst those for fibre and protein were expanded from 5 to 15 points. The modifications were made to ensure better discrimination of the nutrient profile for foods within the same category.
The French High Council for Public Health nutrient profiling system
The original FSA-NPS was adapted in France for the purpose of front-of-pack nutrition labelling, namely the Nutri-Score, by the French HCSP in 2015(34). The HCSP-NPS considers four specific food categories: beverages, fats and oils, cheese and a generic category for all other foods. The generic food category is the same as the original FSA-NPS. For the other three categories, the modifications were made on the allocation grid for specific components of the scoring system but maintaining its original structure and thus leading to a final score still based on a discrete continuous scale from −15 to +40 points(34). For beverages, the thresholds for points’ attribution in energy and total sugars were modified and the maximum number of points for fruit, vegetable and nut was doubled. For the fats category, the calculation of the saturated fat component was modified to take into account the ratio of saturated fat on total fats. For cheeses, the final score takes into account the protein content, whatever the score of negative components. The modifications were made to ensure better discrimination of the nutrient profile for foods within the same category and align these food categories with national nutritional recommendations.
Dietary indices computation (at the individual level)
For each of the four NPS included in the present study, a dietary index(Reference Julia, Touvier and Méjean14) was computed at the individual diet level (accounting for the whole diet) using arithmetic energy-weighted means with the following equation:
 $${\rm{Dietary}}\,{\rm{index}} = {{\sum\nolimits_{i = 1}^n {F{S_i}{E_i}} } \over {\sum\nolimits_{i = 1}^n {{E_i}} }}$$
where i represents a food or beverage consumed by the participant, FS i the food (or beverage) score, E i the mean daily energy intake from this food (or beverage) and n the number of different foods. A higher dietary index reflects a lower nutritional quality of the individual’s overall diet. Given the similarity of the four scores’ computation at the food level, the same approach was used for the four nutrient profiles.
Statistical analyses
Participants from the NutriNet-Santé cohort, except pregnant women (n 2890), with three dietary 24-h records at baseline were eligible for the present study. Participants with energy underreporting (n 14 170), with no anthropometrics or socio-demographic data (n 14 001), or dieting during the dietary data collection period (n 12 977) were excluded from the analyses, resulting in a population sample of 71 403 participants. We computed the distribution of the four dietary indices (mean, standard deviation, median, minimum and maximum) and the correlation coefficients between the indices using Spearman correlations. We described socio-demographic and lifestyle characteristics of the NutriNet-Santé sample by sex-specific tertile of each of the four dietary indices and then compared them across tertiles for each index using χ 2 or Mantel–Haenszel tests as appropriate. Individual characteristics included age (18–25, 26–45, 46–65 and >65 years), sex, educational level (primary, secondary and university), monthly income (<900, 900–2700 and >2700 €/month), smoking status (non-smoker, former smoker and current smoker), marital status (in couple, single/divorced/widowed), physical activity level (low, moderate and high) and BMI (<18·5, 18·5–24, 25–29 and >30 kg/m2). We calculated nutrient intakes across sex-specific tertiles of each dietary index using linear regression and applying the residual method to take into account energy intake(Reference Willett and Stampfer35), and we then compared them across tertile for each dietary index using ANOVA. Multiple testing was taken into account using a false discovery rate approach(Reference Benjamini and Hochberg36).
Weight gain
For each dietary index, we represented graphically the change of BMI over time by sex-specific tertile. We measured the associations between each of the four individual dietary indices (as sex-specific tertiles) and BMI over time using mixed models for repeated measures (PROC MIXED in the statistical software SAS), with dietary indices as fixed effect, and intercept and time as random effects. Given the non-normal distribution of BMI, a logarithmic transformation was used to normalise the dependent variable in the models. The outcome modelled was the relative change in BMI. Models were adjusted for age, sex, educational level, level of monthly income, smoking status, marital status, physical activity level, energy intake, alcohol intake and season of dietary data collection. Participants with at least one measurement contributed to the models on BMI change over time. Using linear mixed effects models, participants with only one measurement contributed to the population level estimates of BMI at the time of their measurement and inferences based on the distribution of BMI measurements allowed for estimates of slopes for these participants.
Overweight and obesity
Two sets of analyses were carried out, one for overweight (including obesity) and another for obesity separately. In each analysis, we excluded prevalent cases of overweight (n 18 433) or obesity (n 4824) at baseline, respectively, and participants with missing covariates. Participants with at least 1 year of follow-up were included in the analyses, leading, respectively, to 40 096 participants for overweight analyses and 50 569 for obesity analyses. We characterised the association between individual dietary indices (sex-specific tertiles) and overweight or obesity onset (hazard ratio (HR) and 95 % CI) using multivariable Cox proportional hazard models with age as the primary time variable(Reference Korn, Graubard and Midthune37). We verified the assumptions of risk proportionality through examination of the log–log (survival) v. log–time plots and Schoenfeld residuals, and the log-linearity assumption through the Martingale residuals plot. Participants contributed person time to the Cox model until the date of onset of overweight or obesity for cases (defined as the middle date between the anthropometrics questionnaire in which the participant’s self-reported weight corresponding to overweight or obesity, and the previous one(Reference Ahn, Lim and Paik38)) or the date of last completed anthropometrics questionnaire for non-cases. Models were adjusted for age (timescale), sex, educational level, level of monthly income, smoking status, marital status, physical activity, energy intake, alcohol intake and season of dietary data collection. Significant associations of the four dietary indices with overweight and obesity risk were formally compared two by two by including simultaneously two dietary indices in the model and using a Wald test(Reference Chiuve, Fung and Rimm39).
Sensitivity analyses were conducted with an additional adjustment for all models on the proportion of ultra-processed food intake in the diet. The proportion of ultra-processed foods in the diet was estimated for each participant using the NOVA classification(Reference Monteiro, Cannon and Moubarac40) and expressed as an energy ratio (% energy/d). All analyses were carried out using the SAS software (version 9.4; SAS Institute Inc.) and a P value ≤ 0·05 was considered statistically significant.
Results
The flow chart of the present study with the different samples depending on the conducted analyses (descriptive, weight gain, overweight or obesity) is shown in Fig. 1.
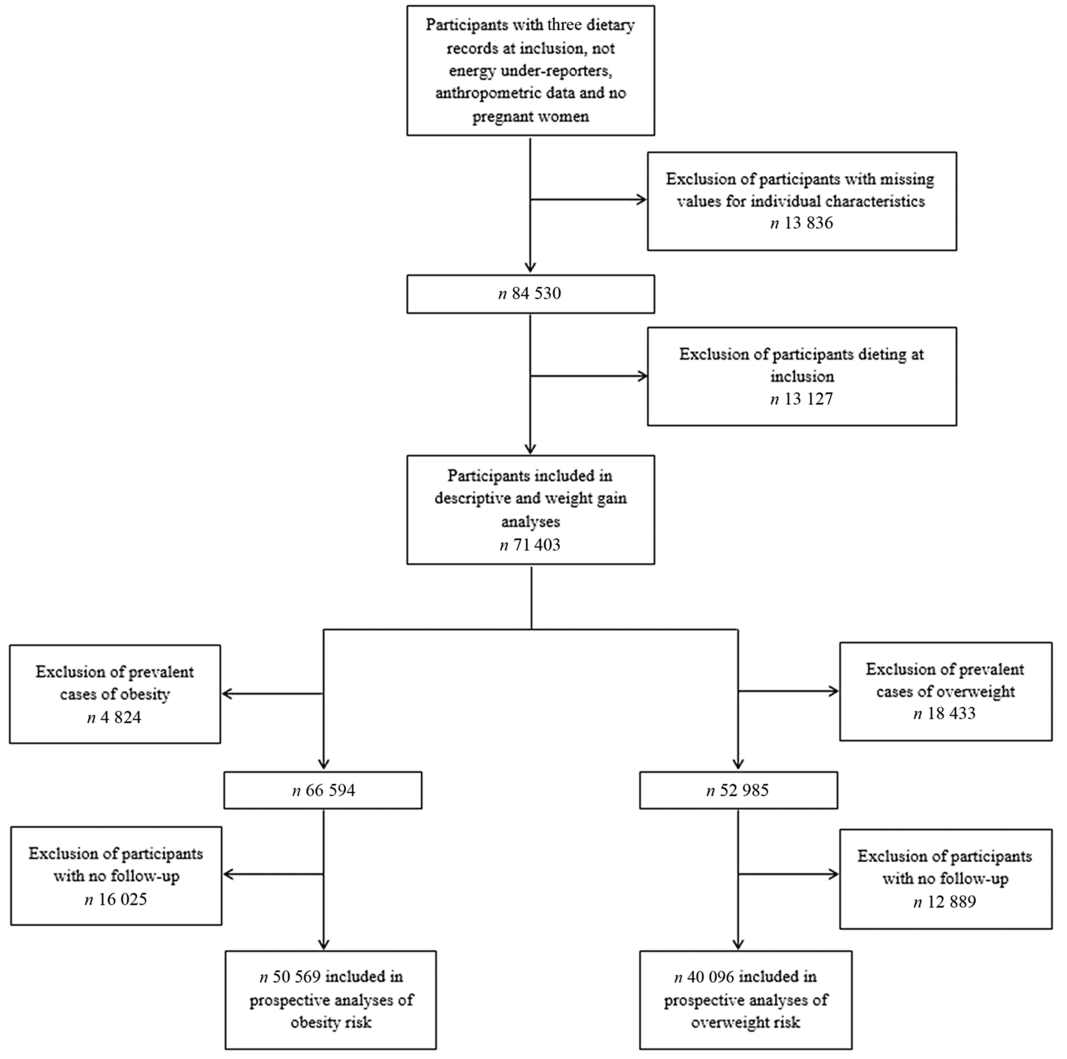
Fig. 1. Flow chart of the study populations.
Descriptive analyses
The distribution of the four dietary indices and the correlation coefficients between them are presented in online Supplementary Table S1. Among the participants, the mean dietary index was 6·95 (sd 2·50) points with the original FSA-NPS, 7·26 (sd 2·91) points with the NPSC, 7·09 (sd 3·33) points with the Health Star Rating-NPS and 6·66 (sd 2·54) points with the HCSP-NPS. The four dietary indices were highly correlated (all Spearman coefficients over 0·90 for continuous variables).
The description of socio-demographic and lifestyle characteristics of the study sample (n 71 403) at baseline by sex-specific tertile of each of the four individual dietary indices is presented in Table 1. For the four NPS, participants with a higher individual dietary index, reflecting a lower overall nutritional quality of their diet, tended to be younger, with a university educational level, a lower income per household unit, to be smokers and less physically active compared with participants with lower individual dietary index. Regarding the marital status, participants in the extreme tertiles (tertiles 1 and 3) were more likely to live alone. Nutrient intakes across each dietary index are displayed in Table 2. Participants with a higher individual dietary index (tertile 3) had significantly higher intakes of energy, total fat, cholesterol, saturated fat, alcohol, added sugars and Na (except for the HCSP-NPS regarding the latter) and lower intakes of carbohydrates, simple sugars, protein, polyunsaturated fat, fibres, vitamins and minerals.
Table 1. Description of the population by sex-specific tertiles of individual dietary indices (NutriNet-Santé sample, n 71 403)
(Percentages of participants in the tertile samples)
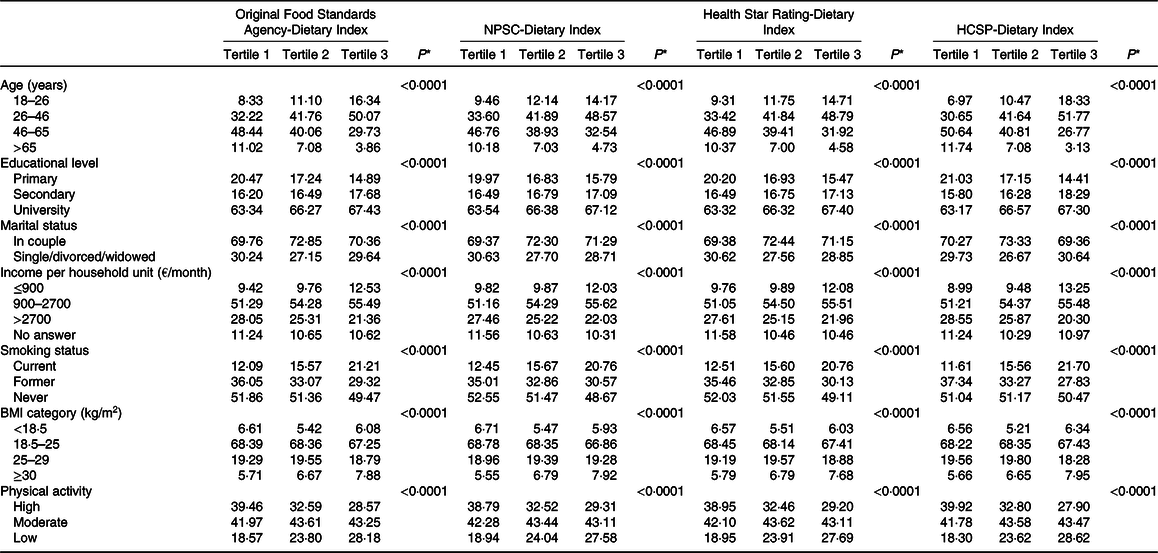
NPSC, Nutrient Profiling System Criterion; HCSP, High Council for Public Health.
* P values from χ 2 or Mantel–Haenszel tests as appropriate, after correction for multiple testing.
Table 2. Nutrient intakes across sex-specific tertiles of individual dietary indices (NutriNet-Santé sample, n 71 403)*
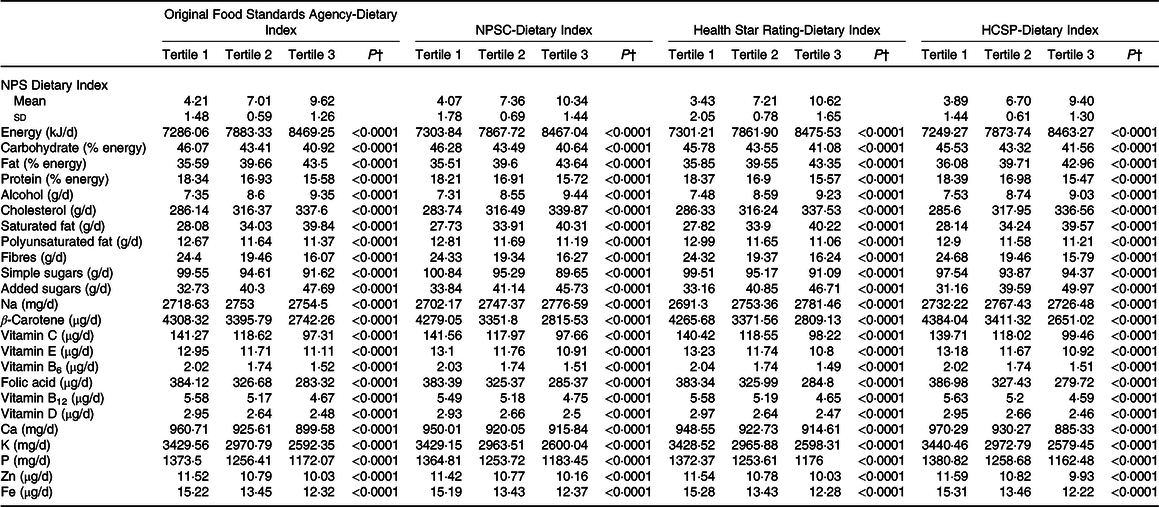
NPSC, Nutrient Profiling System Criterion; HCSP, High Council for Public Health.
* Cut-offs for sex-specific tertiles of original Food Standards Agency-Dietary Index were 5·92/8·04 for men and 5·97/8·05 for women; cut-offs for sex-specific tertiles of NPSC-Dietary Index were 6·08/8·54 for men and 6·16/8·56 for women; cut-offs for sex-specific tertiles of Health Star Rating-Dietary Index were 5·74/8·56 for men and 5·85/8·58 for women; and cut-offs for sex-specific tertiles of HCSP-Dietary Index were 5·8/7·74 for men and 5·63/7·78 for women.
† P values for trend across tertiles derived from ANOVA adjusted for sex and age, after correction for multiple testing. Nutrient intakes are adjusted for energy using the residual method. Values of the NPS-DI are mean values and standard deviations.
Prospective analyses
A total of 71 403 participants were included in the weight gain analyses (measured using the BMI), with a median follow-up of 3·14 (sd 2·76) years. BMI change over time by sex-specific tertile of dietary indices is shown in Fig. 2. The mean BMI for each year and each tertile of dietary index is presented along with the 95 % CI of the mean. Graphically, while an increase of BMI was observed in all tertiles of each individual dietary index, the BMI gain appeared to be higher for participants in tertile 2 and particularly in tertile 3 of all dietary indexes (individuals with a lower overall dietary quality) compared with individuals from tertile 1. Results of the prospective associations between the four dietary indices and BMI change are shown in Table 3. For the four NPS, participants in tertiles 2 and 3, having lower dietary nutritional quality, had higher BMI at baseline (β-coefficients for tertiles 2 and 3 > 0) compared with those in the first tertile (reference in the model). In the four NPS, participants in the first tertile of dietary index had a significant increase in BMI over time (β-coefficients for time significantly >0). However, participants in tertile 2 and especially in tertile 3 of each dietary index had a significantly higher increase of BMI over time compared with tertile 1 (β-coefficients for interactions terms between time and tertile >0), with a significantly higher effect magnitude for the HCSP-Dietary Index (β T3 × time = 0·18 (0·16–0·20), P < 0·0001), followed by the original FSA-Dietary Index (β T3 × time = 0·14 (0·11–0·16), P < 0·0001), and then the NPSC-Dietary Index (β T3 × time = 0·09 (0·06–0·11), P < 0·0001) and the Health Star Rating-Dietary Index (β T3 × time = 0·09 (0·07–0·11), P < 0·0001).

Fig. 2. Change in BMI over time in years, by tertiles (T) of dietary indices. (a) BMI change over time according to Food Standards Agency-Dietary Index (FSA-DI) tertiles, (b) BMI change over time according to Nutrient Profiling Scoring Criterion-Dietary Index (NPSC-DI) tertiles, (c) BMI change over time according to High Council for Public Health-Dietary Index (HCSP-DI) tertiles, (d) BMI change over time according to Health Star Rating-Dietary Index (HSR-DI) tertiles. ![]() , T1;
, T1; ![]() , T2;
, T2; ![]() , T3.
, T3.
Table 3. Association between the four individual dietary indices and weight gain (NutriNet-Santé sample, n 71 403)*
(β-Coefficients and 95 % confidence intervals)
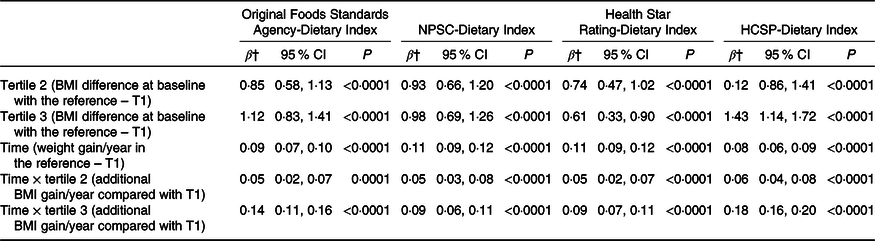
NPSC, Nutrient Profiling System Criterion; HCSP, High Council for Public Health; T, tertile.
* Models were adjusted for age, sex, level of monthly income, educational level, marital status, physical activity, energy intake, alcohol intake, and season of dietary data collection. Analyses were computed overall, and by sex.
† Estimates β′ of parameters, corresponding to the modelling of log(BMI), were thus transformed to obtain β as follows β = (exponential(β′)−1) × 100, interpreted as a variation of BMI in percentage.
Similar trends were observed when models were adjusted for the proportion of ultra-processed food intake in the diet (online Supplementary Table S2).
Results of the associations between the four dietary indices and overweight (n 40 096 participants, 4·96 (sd 2·93) years of median follow-up) or obesity (n 50 569 participants, 5·32 (sd 2·90) years of median follow-up) risks are presented in Table 4. During the course of the follow-up, 4488 participants developed overweight and 1582 obesity. Overall, participants with a higher dietary index reflecting a lower diet quality (tertile 2 and particularly tertile 3) had a significant increased risk of overweight compared with tertile 1: HR T3 v. T1 = 1·27 (95 % CI 1·17, 1·37) (P trend < 0·0001) for the HCSP-Dietary Index, followed by the original FSA-Dietary Index with HR T3 v. T1 = 1·18 (95 % CI 1·09, 1·28) (P trend < 0·0001), the NPSC-Dietary Index with HR T3 v. T1 = 1·14 (95 % CI 1·06, 1·24) (P trend = 0·0008) and then the Health Star Rating-Dietary Index, HR T3 v. T1 = 1·12 (95 % CI 1·04, 1·21) (P trend = 0·003). No association was found between any of the four dietary indexes and the risk of obesity. Similar trends were observed when models were adjusted for the proportion of ultra-processed food intake in the diet; however, just the association between the HCSP-Dietary Index and overweight risk remained statistically significant (HR T3 v. T1 = 1·16 (95 % CI 1·06, 1·26); P = 0·001; online Supplementary Table S3).
Table 4. Prospective associations between the four individual dietary indices and overweight or obesity risk*
(Hazard ratios (HR) and 95 % confidence intervals)
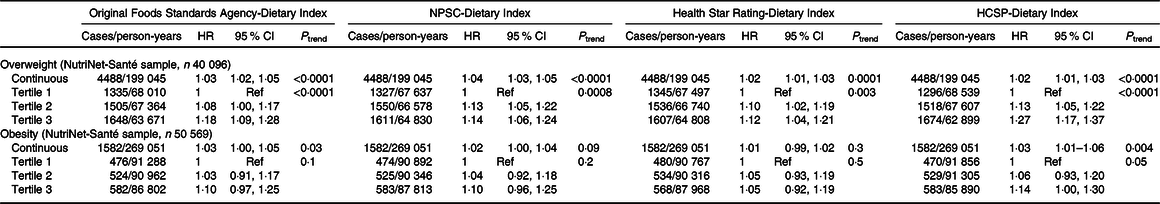
NPSC, Nutrient Profiling System Criterion; HCSP, High Council for Public Health; Ref, reference.
* Models were adjusted for age (timescale), sex, level of monthly income, educational level, physical activity, energy intake, alcohol intake, number of dietary records and season of dietary data collection.
Associations between the four NPS with overweight risk were compared (Table 5); no comparison was made for obesity given the non-significant results. When both the HCSP-Dietary Index and the original FSA-Dietary Index were included in the model, the HCSP-Dietary Index was associated with a significant increased risk of overweight while the original FSA-Dietary Index was associated with a significantly decreased risk. Similar results were observed when both the HCSP-Dietary Index and NPSC-Dietary Index, or the HCSP-Dietary Index and Health Star Rating-Dietary Index, were included in the model: the HCSP-Dietary Index was associated with a significantly increased risk while the other index was associated with a significantly decreased risk. Conversely, when both the NPSC-Dietary Index and the original FSA-Dietary Index, or the Health Star Rating-Dietary Index and the original FSA-Dietary Index, were included in the model, the original FSA-Dietary Index was associated with a significantly increased risk of overweight while the NPSC-Dietary Index or the Health Star Rating-Dietary Index was associated with a significantly decreased risk. When both NPSC and Health Star Rating dietary indices were included in the model, neither index was significantly associated with risk of overweight.
Table 5. Comparisons of the associations between the four individual dietary indexes and overweight risk (NutriNet-Santé sample, n 40 096)*
(Risk ratios (RR) and 95 % confidence intervals)
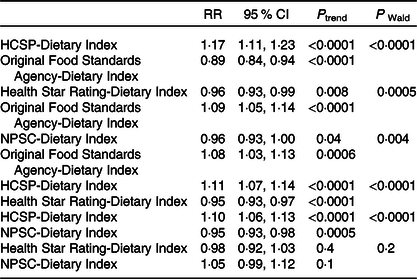
HCSP, High Council for Public Health; NPSC, Nutrient Profiling System Criterion.
* To test whether the β-coefficients for two dietary indices were different, the method of Chiuve et al. (Reference Chiuve, Fung and Rimm39) was used: the Wald statistic was calculated using the following formula χ 2 = ((β 1 − β 2)/√(var(β 1 − β 2)))2 where β 1 is the β-coefficient of the first dietary index, β 2 the β-coefficient of the second dietary index and var(β 1 − β 2) = var(β 1) + var(β 2) − 2 × cov(β 1, β 2).
Discussion
In the present study, participants with a lower nutritional quality diet, measured by higher dietary indices based on the four NPS, had a higher increase in BMI over time and were at higher risk of becoming overweight. The HCSP-Dietary Index appeared to be more strongly associated with risk of becoming overweight, followed by the original FSA-Dietary Index, and then the NPSC-Dietary Index and Health Star Rating-Dietary Index.
Very few studies to date have investigated the associations between NPS, either FSA-NPS or its variants, and anthropometric measurements(Reference Julia, Ducrot and Lassale21,Reference Murakami41) . One study conducted in another French cohort found that participants with poorer diet measured by a higher HCSP-Dietary Index had a higher weight and BMI gain, and an increased risk of overweight, and obesity (among men only)(Reference Julia, Ducrot and Lassale21). Another study investigated the relationship between the nutritional quality of meals and snacks assessed using the original FSA-NPS with BMI and waist circumference in British adults and observed a positive association between the FSA-Dietary Index of snacks consumption only, and BMI and waist circumference among women(Reference Murakami41).
Several assumptions could explain the associations of the NPS observed in the study with weight gain or overweight. First, the computation of the scores at the food level using the four NPS tested in the study is based on the composition of the food product in energy, saturated fats, sugars, protein, fibre and fruits, vegetables and nuts. The inclusion of these key components leads to an association between higher dietary indexes and higher intakes of energy, fats, saturated fats, added sugars and potentially Na, and lower intakes of carbohydrates, protein and fibre (together with higher/lower levels of nutrients and other components not included in the NPS), a finding consistent with previous work(Reference Julia, Touvier and Méjean14). Given that individuals tend to maintain a constant volume of food intake, diet rich in fats would lead to a passive over-consumption related to their high energy:volume ratio, promoting energy intake(Reference Jéquier42,Reference Roberts, McCrory and Saltzman43) . In contrast, it has been suggested that other macronutrients – proteins and carbohydrates to a lesser extent – have a positive effect on satiety(Reference Jéquier42,44) . Regarding fibres, several physiological effects could explain their effect on energy regulation, including notably a positive impact on satiety or on a decrease in fat and protein absorption(Reference Roberts, McCrory and Saltzman43,44) . Thus, weight gain and overweight could be related to these dietary factors, influencing the energy balance of individuals(Reference Giskes, Avendaňo and Brug45). Nevertheless, it can be noticed that large difference in energies intakes between tertiles of dietary indices in our study was not reflected in higher HR. This might be partly explained by the fact that weight gain over time would be related to the excess of energies over requirements (ratios of energy intakes on energy expenditure estimating at 0·96 (sd 0·27) approximately in tertile 1 of the dietary indices and 1·14 (sd 0·32) in tertile 3 of the dietary indices) rather than energies intakes in absolute. Our findings on the associations between dietary indices and nutrient intakes are consistent with a study where a higher HCSP-Dietary Index was associated with a higher consumption of food groups which can affect weight status and thus should be limited, such as sugary snacks, sweetened beverages, cheeses, fats and sauces, or processed meat, and a lower consumption of fruits, vegetables and legumes, for example(Reference Julia, Touvier and Méjean14,44) . Second, improved adherence to dietary guidelines by participants with a lower dietary index, which reflects a better overall diet nutritional quality, may lead to more favourable outcomes regarding weight status. Indeed, it has been previously demonstrated that the HCSP-Dietary Index was correlated with the Programme National Nutrition Santé – Guideline Score reflecting the adherence to the French nutritional recommendations of 2001(Reference Julia, Touvier and Méjean14).
The relative differences observed between the HCSP and the NPSC or Health Star Rating indices may be partly explained by: (1) the specific modification of the scoring system for sweetened beverages in the HCSP-NPS which are penalised more and have higher scores at the food level, and (2) the inclusion of starchy vegetables in the scoring of fruits, vegetables, nuts and legumes points for the NPSC and Health Star Rating-NPS, which may have improved their nutrient profile, including for processed foods such as potato chips or French fries.
Validation of a NPS requires several steps including an assessment of its content, construct and predictive validity(Reference Townsend46). However, although NPS are developed in the framework of non-communicable diseases prevention and thus their associations with health outcomes (predictive validity) are of major importance to test, this dimension of NPS validity is rarely verified(Reference Labonté, Poon and Gladanac8). More broadly, a recent systematic review has revealed that no information on validity testing could be found for 58 % of NPS models assessed in the review(Reference Labonté, Poon and Gladanac8). In the present study, significant associations were found between the four NPS and weight status, though of small amplitude. Weight gain is a multifactorial process that can greatly vary over time, making it more difficult to identify associations on a short period of time, as it was the case with the short median follow-up of our study, and results should be interpreted with caution. Nevertheless, the effect sizes that were found are consistent with other studies investigating the associations between individual dietary indices and nutrition-related chronic diseases(Reference Adriouch, Julia and Kesse-Guyot15,Reference Adriouch, Julia and Kesse-Guyot16,Reference Donnenfeld, Julia and Kesse-Guyot18,Reference Deschasaux, Julia and Kesse-Guyot19,Reference Mytton, Forouhi and Scarborough47–Reference Andreeva, Egnell and Galan51) . Significant associations with weight gain are particularly important in the validation of NPS supporting public health strategies (i.e. health claims, front-of-pack nutrition labels and marketing regulation) which aim to improve health status of populations through healthier diets. In addition, small effects sizes may have a great public health interest on a large population. This type of methodology might potentially guide the revision process of NPS by policy makers. When comparing the performance of the various indices, by including two indices at a time in the analyses, a significant relative risk over 1 for the first index while the relative risk of the second index is below 1 indicates that the first index is more strongly associated with the outcome and shows higher performance compared with the other index. In these analyses, we observed a higher performance of the HCSP-NPS compared with other indices, suggesting that the specific modifications of this NPS are leading to a stronger association with overweight. Conversely, NPSC and Health Star Rating did not appear to be associated with an improved performance compared with the original FSA. Nevertheless, the differences observed between the four NPS were of small magnitude. This suggests that the prospective associations mainly relate to the common core of the profiling system and that adaptations, including modification to the scoring or the use of food categories, have only a marginal impact on the association with weight gain or overweight. This finding suggests that the results of validation studies undertaken on a specific NPS might apply to adaptations of the same NPS. Our results also suggest two avenues to improve the health impact of NPS adaptations. On the one hand, testing the prospective associations with health may determine whether the adaptation yields significant improvements from the original, in particular in the view of preventing non-communicable diseases. On the other hand, a specific method to improve NPS specifically to take their prospective associations with health into account could be developed, to ensure that adaptation leads to significant health gains.
Strengths of the study include its prospective design and the large sample of participants. Moreover, the dietary data collected in the NutriNet-Santé cohort using 24-h dietary records were validated against an interview by a trained dietitian and blood and urinary biomarkers(Reference Touvier, Mejean and Kesse-Guyot25,Reference Lassale, Castetbon and Laporte28,Reference Lassale, Castetbon and Laporte29) . Regarding anthropometric measurements, self-reported online data were demonstrated to be consistent with face-to-face declarations(Reference Lassale, Peneau and Touvier26). Furthermore, very few other studies have investigated the associations between NPS and health outcomes, nor the potential impact of specific modifications of an original NPS on these associations.
However, limitations should be acknowledged. First, participants in the NutriNet-Santé cohort have higher educational level and monthly incomes, with more health-conscious behaviour and thereby may have healthier dietary indexes resulting in less weight gain and overweight or obesity, as compared with the general French population. Second, the relatively short follow-up period (median of 5·32 (sd 2·90) years) may partly explain the absence of significant results for obesity risk, which would develop over a longer period of time(Reference Mozaffarian, Hao and Rimm52,Reference Malhotra, Østbye and Riley53) . Repeating these analyses with a longer duration of follow-up would allow us to validate our findings, in particular for obesity. Third, the presence of residual confounding related to our exposure and outcomes measurement cannot be excluded. These issues may have resulted in underestimation of the associations between dietary indexes and health outcomes and may have impaired our ability to detect an association with obesity. However, such underestimation impacts all the indexes equally and therefore should not be considered as a bias in the comparison of the nutrient indexes. Another limitation which could be highlighted is the use of weight gain as health outcome which does not always reflect an unhealthy fat mass gain. Thus, it might be notably interesting to conduct similar analyses using other indicators than BMI, such as waist circumference measuring adiposity more precisely. Finally, the study was conducted among a French cohort, while the original FSA-NPS was adapted for use in the UK and the NPSC and Health Star Rating-NPS in New Zealand and Australia, where the local food supply and nutritional recommendations differ. These adaptations specific to a particular context may limit the extrapolation of the observed associations in populations from the UK, New Zealand and Australia. In addition, this comparative study focused on similar and highly correlated systems derived from the original FSA model. Nevertheless, it would be interesting to further compare various profiling systems, for example, the Chilean NPS used in multiple public health strategies. This type of research would however require the development and validation of a dietary index as in the present study.
In conclusion, the original FSA-NPS and the three systems adapted for specific application (HCSP, NPSC and Health Star Rating) all appear to be associated with weight gain and the risk of overweight, even if effect sizes remained of small amplitude. Thus, public health policies based on the NPS represent efficient tools to improve the health status of consumers, by informing and encouraging individuals towards healthier food choices and improving the food environment. With respect to the prospective aspect of NPS validity, modifications of the FSA system on scoring and use of categories seem to have marginal – though significant – impact on the association with weight outcomes.
Acknowledgements
We also thank Cédric Agaesse, Vristi Desan and Cynthia Perlin (dietitians); Thi Hong Van Duong, Younes Esseddik (IT manager), Paul Flanzy, Régis Gatibelza, Jagatjit Mohinder and Aladi Timera (computer scientists); Julien Allegre, Nathalie Arnault, Laurent Bourhis and Fabien Szabo de Edelenyi, PhD (supervisor) (data-manager/statisticians) for their technical contribution to the NutriNet-Santé study and Nathalie Druesne-Pecollo, PhD (operational manager). We thank all the volunteers of the NutriNet-Santé cohort.
The present study was funded by the New Zealand Ministry for Primary Industries. The NutriNet-Santé study is funded by French Ministry of Health and Social Affairs, Santé Publique France, Institut National de la Santé et de la Recherche Médicale, Institut National de la Recherche Agronomique, Conservatoire National des Arts et Métiers and Paris 13 University. The funders of the study had no role in the study design; in the collection, analysis or interpretation of the data; in the writing of the report; and in the decision to submit for publication. All authors had full access to all the data in the study and C. J. had final responsibility for the decision to submit for publication.
B. N., C. N. M., M. R., A. J., M. T., E. K. G., S. H. and J. C. designed research; M. E. and C. J. conducted research, M. E. performed statistical analyses in collaboration with L. S. and C. J.; all authors interpreted the data; M. E. drafted the paper in collaboration with C. J. and all authors critically revised the paper for important intellectual content. All authors read and approved the final manuscript.
All authors declare no competing interests.
Supplementary material
For supplementary materials referred to in this article, please visit https://doi.org/10.1017/S0007114520003384


