


The metabolic syndrome (MetS) is a cluster of metabolic disorders including abdominal obesity, insulin resistance, hyperglycaemia, dislipidaemia and hypertension( Reference Eckel, Grundy and Zimmet 1 ). It is reported that MetS increases risk of atherosclerotic CVD by threefold and is associated with all-cause mortality( Reference Ford 2 ). It is estimated that 20–25 % of adults suffer from MetS worldwide( Reference Eckel, Grundy and Zimmet 1 ).
Previous investigations have assessed the relationship between consumption of specific foods or nutrients and risk of MetS( Reference Radhika, Van Dam and Sudha 3 – Reference Pan, Franco and Ye 7 ); however, this assessment may have some limitations. First, people generally consume a combination of various foods and nutrients in each meal, not individual foods and nutrients. Second, single foods and nutrients do not show the interactive and synergistic effects of different foods and nutrients in a diet. Third, there is high correlation between many different nutrients and hence detection of an independent influence is hard. Therefore, another approach called ‘dietary pattern analysis’ has been developed to evaluate the effect of whole diets (instead of specific foods or nutrients) on incidence of chronic diseases. Dietary patterns can be determined using either the a priori or a posteriori approach. A priori approaches such as dietary indices are based on scientific knowledge, while a posteriori approaches such as factor analysis, principal component analysis (PCA) and cluster analysis are based on statistical methods.
Accumulating evidence suggests that there is a relationship between a posteriori dietary patterns and the risk of MetS( Reference Esmaillzadeh, Kimiagar and Mehrabi 8 – Reference Cho, Kim and Cho 11 ). However, findings vary substantially across studies. Some studies have found that dietary patterns characterized by high intakes of vegetables, fruits and fish are inversely associated with MetS( Reference Esmaillzadeh, Kimiagar and Mehrabi 8 ), whereas dietary patterns characterized by high intakes of red meat, processed meat, refined grains, alcohol and fried foods are associated with increased MetS risk( Reference Heidemann, Scheidt-Nave and Richter 9 ). In contrast, some studies did not detect a significant association between a dietary pattern characterized by meat and alcohol and MetS( Reference Hong, Song and Lee 10 , Reference Cho, Kim and Cho 11 ).
Therefore, we aimed to conduct a systematic review and meta-analysis of observational studies to assess the association between a posteriori dietary patterns and the risk of MetS in people aged 18–60 years.
Methods
Search strategies
The Preferred Reporting Items for Systematic Reviews and Meta-Analyses (PRISMA) statement was used to conduct the present systematic review and meta-analysis( 12 ). An electronic search for observational studies that investigated the association between a posteriori dietary patterns and risk of MetS was conducted in MEDLINE and EMBASE databases up to July 2015 with no time restriction. Search terms for PubMed included: dietary pattern* (tiab) OR eating pattern* (tiab) OR food* pattern* (tiab) OR dietary habit (tiab) OR dietary (tiab) AND factor analysis (tiab) OR principal component analysis (tiab) AND ‘metabolic syndrome X’ (MeSH) OR metabolic syndrome (tiab) OR MetS (tiab) OR MS (tiab) OR syndrome X (tiab) OR cardio metabolic risk factor (tiab) OR insulin resistance syndrome. (tiab) searches the title and abstract fields only, (MeSH) searches the Medical Subject Headings field only, and the truncation symbol * searches all words with this combination of letters at the beginning. The search strategy was adapted for the other database to fit its specific features. Reference lists of review articles were also checked to identify relevant studies.
Eligibility and study selection
The PICOS (population, intervention, comparator, outcome, study design) framework shown in Table 1 was used. All retrieved articles in the initial search were read independently by two reviewers (M.H. and S.S-B.). Any disagreements were discussed and resolved by consensus or a third independent reviewer (S.M.) if necessary.
Table 1 Description of the PICOS (population, intervention, comparator, outcome, study design) criteria used to define the research question
Relevant articles were included in the meta-analysis if they: (i) identified dietary patterns with factor analysis or PCA; (ii) reported an odds ratio (OR) or risk ratio (RR) for MetS; (iii) were conducted on adults (18–60 years old); (iv) presented their results in percentiles; and (v) used varimax rotation in their methodology. We included only those articles using a posteriori dietary patterns derived by PCA or factor analysis. Studies were excluded if they: (i) examined only individual nutrients or foods; (ii) did not report an OR or RR for MetS; (iii) comprised study samples that were not population based or focused only on a subgroup of individuals with nutritional needs that are different from the general population, including pregnant or lactating women, infants, children or adolescents; (iv) were animal studies; (v) were randomized clinical trials, reviews, case reports, conference and letters; (vi) applied cluster or reduced rank reduction analysis; and (vii) were dissertations.
Data extraction
The following information was extracted from included studies: first author, publication year and country, study design, sampling frame, sample size, number of cases and controls (if available), dietary assessment tool (FFQ or 24h recall), method of identifying dietary patterns, dietary patterns identified, confounders adjusted for in the analysis and main findings, including estimates of the association. When a study provided several estimates with adjustment for different confounders, results were reported for the one adjustment that covered the largest number of factors. Two reviewers independently performed the data extraction and settled differences by consensus. Where further detail was required, we contacted study authors for additional information.
Data synthesis
As all patterns used in the meta-analysis were extracted using varimax rotation, the method which leads to independent components, they can be used in the same model at the same time without having any issues regarding collinearity. Therefore, we extracted patterns and combined them based on the independence hypothesis of patterns and reported two types of patterns separately. We identified the two types of dietary patterns as healthy and unhealthy, which were considered for meta-analysis based on whether they had generally healthy characteristics or not. Because the labelling of dietary patterns varied across studies, so long as the selected patterns were similar with regard to the most frequently consumed foods, these studies were grouped and analysed together regardless of their original label. For example, most studies examined dietary patterns with high factor loadings for fruit and vegetables, fish and whole grains; these studies were pooled and analysed together and the corresponding overall dietary pattern was labelled ‘Healthy/Prudent’. The classification of each food was based on the recommendations of different consensus dietary guidelines such as the seventh edition of the Dietary Guidelines for Americans( 13 ).
Statistical analysis
We used OR of tertiles, quartiles and quintiles among included studies which reported adherence to a posteriori dietary patterns. Then, the pooled OR was used for the highest adherence to each dietary pattern (‘Healthy/Prudent’ and ‘Unhealthy/Western’) in comparison to the lowest adherence to assess the association between dietary patterns and risk of MetS. To pool the OR or RR for dietary patterns, the random-effects model (DerSimonian–Laird method) was used employing the user-written ‘metan’ command in the statistical software package Stata version 11( Reference Egger, Smith and Altman 14 ). Heterogeneity of studies was determined using Cochrane’s Q test (significant with a P value of <0·10) and the I 2 statistic. I 2 value equal to 25, 50 and 75 % was considered low, moderate and high level of heterogeneity, respectively( Reference Higgins, Thompson and Deeks 15 ). The 95 % CI were calculated for each I 2 statistic using the ‘heterogi’ command in Stata( Reference Orsini, Bottai and Higgins 16 ). We also estimated the between-study variance using the τ 2 statistic( Reference Higgins and Green 17 ). Outliers were identified through visual inspection of the forest plots. Then, we performed sensitivity analysis by excluding two studies( Reference Hong, Song and Lee 10 , Reference Akter, Nanri and Pham 18 ) as outliers. Sensitivity analyses were carried out by disaggregating results with the user-written ‘metan’ command in Stata version 11( Reference Egger, Smith and Altman 14 ). Publication bias was assessed using funnel plots and Egger’s asymmetry tests with the user-written ‘metabias’ command in Stata version 11( Reference Egger, Smith and Altman 14 , Reference Peters, Sutton and Jones 19 ). All statistical analyses were conducted using Stata version 11.
Results
Study selection
During the initial search 4511 papers were identified, of those 1142 duplicate articles were found. After screening the title and abstract, 3324 articles were excluded and forty-five papers were retrieved for full-text review. Thirty-seven articles were excluded due to lack of information and eleven studies were added manually; thus nineteen cross-sectional studies were included in our meta-analysis. The included articles were published between 2007 to 2015( Reference Heidemann, Scheidt-Nave and Richter 9 , Reference Hong, Song and Lee 10 , Reference Akter, Nanri and Pham 18 , Reference Kim and Jo 20 – Reference Suliga, Kozieł and Cieśla 35 ). If studies had several dietary patterns, each extracted dietary pattern considered healthy or unhealthy was included separately; hence twenty-two healthy and twenty-seven unhealthy dietary patterns were included in the meta-analysis. The flowchart of the literature search is shown in Fig. 1.
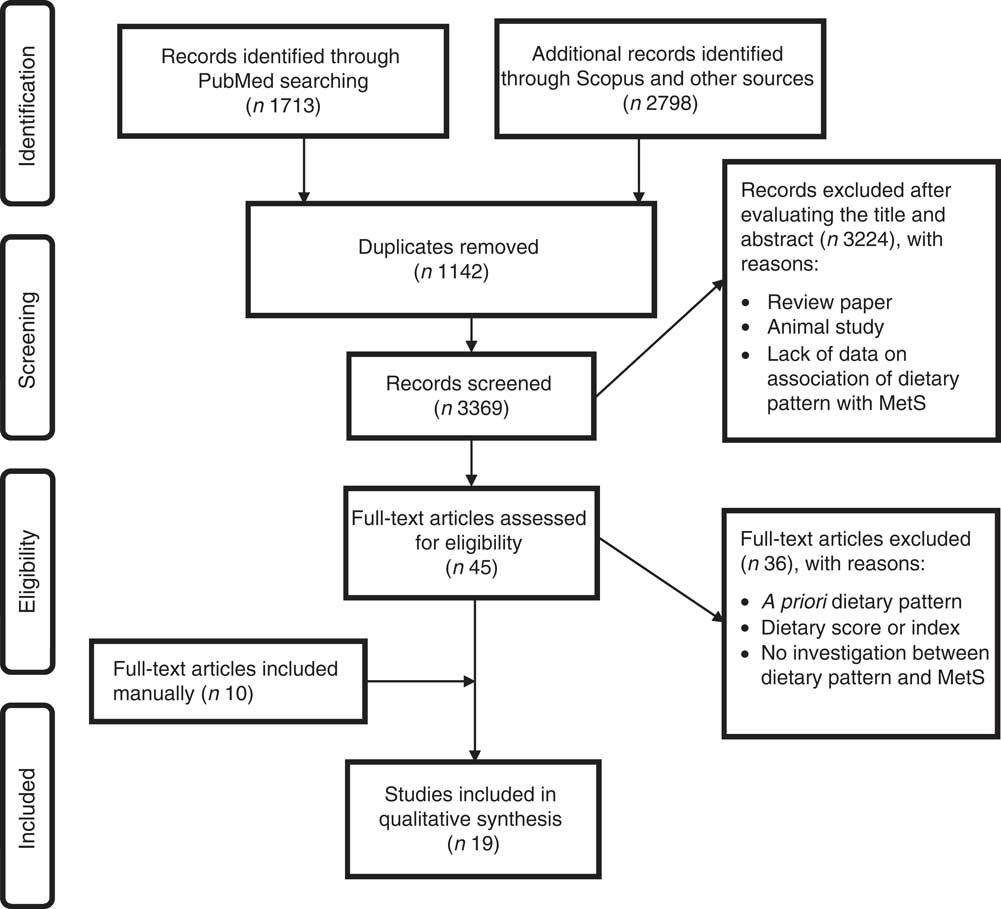
Fig. 1 Summary of the study methodology, processes of review, and outcomes of inclusion and exclusion criteria for the present systematic review and meta-analysis on a posteriori dietary patterns and metabolic syndrome (MetS)
Study characteristics
Characteristics of the included studies are shown in Table 2. Included studies were conducted in the USA( Reference Gadgil, Anderson and Kandula 21 , Reference DiBello, McGarvey and Kraft 23 , Reference Noel, Newby and Ordovas 24 , Reference Lutsey, Steffen and Stevens 26 , Reference Liu, Hickson and Musani 31 ), Mexico( Reference Denova-Gutiérrez, Castañón and Talavera 28 ), Japan( Reference Akter, Nanri and Pham 18 ), South Korea( Reference Hong, Song and Lee 10 , Reference Kim and Jo 20 , Reference Cho, Kim and Cho 29 , Reference Woo, Shin and Kim 33 , Reference Yoo, Suh and Lee 34 ), Iran( Reference Esmaillzadeh, Kimiagar and Mehrabi 8 , Reference Amini, Esmaillzadeh and Shafaeizadeh 27 ) Lebanon( Reference Naja, Nasreddine and Itani 32 ) and Europe( Reference Heidemann, Scheidt-Nave and Richter 9 , Reference Barbaresko, Siegert and Koch 25 , Reference Wagner, Dallongeville and Haas 30 , Reference Suliga, Kozieł and Cieśla 35 ). In fifteen studies( Reference Esmaillzadeh, Kimiagar and Mehrabi 8 , Reference Akter, Nanri and Pham 18 , Reference Gadgil, Anderson and Kandula 21 , Reference DiBello, McGarvey and Kraft 23 – Reference Cho, Kim and Cho 29 , Reference Liu, Hickson and Musani 31 – Reference Suliga, Kozieł and Cieśla 35 ) an FFQ was used to assess dietary intake, while the rest of them( Reference Heidemann, Scheidt-Nave and Richter 9 , Reference Hong, Song and Lee 10 , Reference Kim and Jo 20 , Reference Wagner, Dallongeville and Haas 30 ) used a 24 h recall or food record diary to collect dietary intake. In all studies, dietary patterns were derived using PCA and factor analysis. Regardless of differences in confounding variables and their categorizations among the included studies, the effect size was adjusted for major potential confounding variables including age, sex, BMI, education, energy intake and physical activity in all studies.
Table 2 Descriptions of the studies included in the present systematic review and meta-analysis on a posteriori dietary patterns (DP) and metabolic syndrome

DP, dietary pattern; F, female; M, male; PCA, principal component analysis; FA, factor analysis; PA, physical activity; EI, energy intake; AHA, American Heart Association; MET, metabolic equivalent of task.
‘Healthy/Prudent’ pattern
The forest plot of the association between the ‘Healthy/Prudent’ dietary pattern and MetS is indicated in Fig. 2. There was a significant inverse association between the ‘Healthy/Prudent’ pattern and risk of MetS (OR=0·89; 95 % CI 0·84, 0·94, P=0·002). There was moderate heterogeneity among included studies (I 2=68 %; 95 % CI 51, 80 %; P<0·001; τ 2=0·035). Sensitivity analysis showed that two studies significantly affected the pooled effect size( Reference Hong, Song and Lee 10 , Reference Akter, Nanri and Pham 18 ).
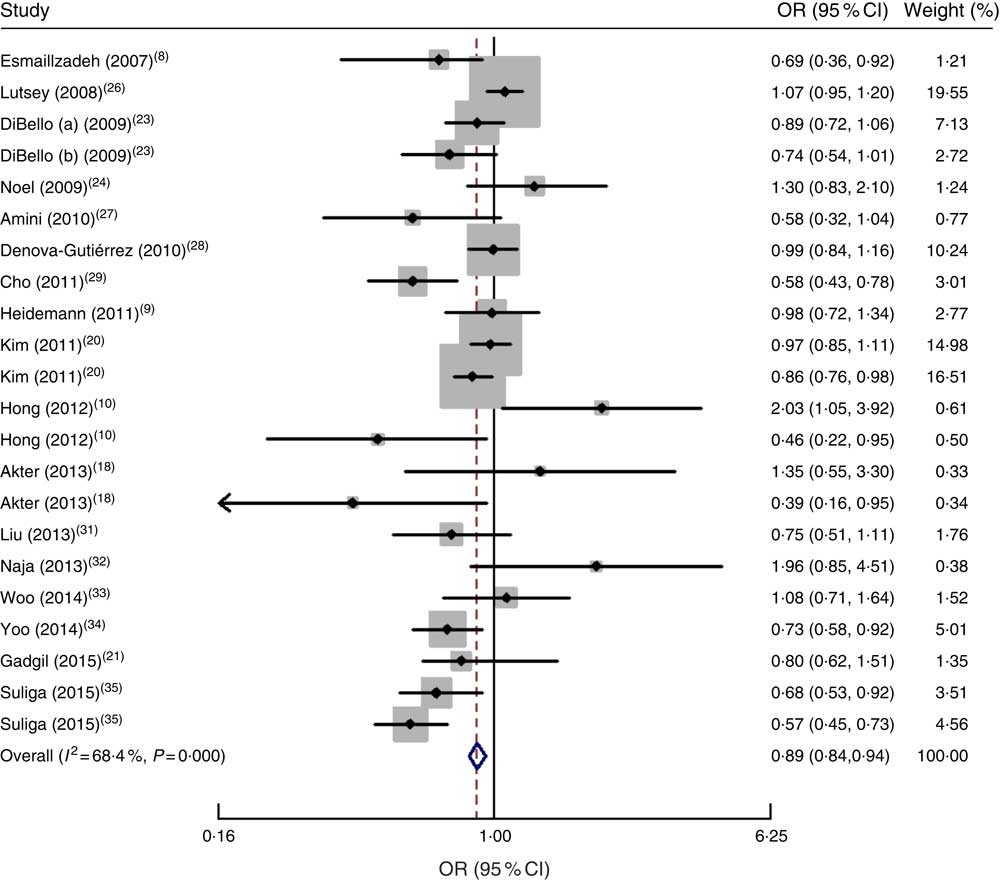
Fig. 2 Forest plot of ‘Healthy/Prudent’ dietary pattern and risk of metabolic syndrome for the highest category compared with the lowest. The study-specific OR and 95 % CI are represented by the black diamond and the horizontal line, respectively; the area of the grey square is proportional to the specific-study weight to the overall meta-analysis. The centre of the open diamond/vertical dashed line represents the pooled OR and the width of the open diamond represents the pooled 95 % CI
‘Unhealthy/Western’ pattern
The ‘Unhealthy/Western’ dietary pattern had a significant positive association with risk of MetS (OR=1·16; 95 % CI 1·11, 1·22; P<0·001). There was moderate heterogeneity in studies (I 2=68 %; 95 % CI 50, 78 %; P<0·001; τ 2=0·034), as shown in Fig. 3.
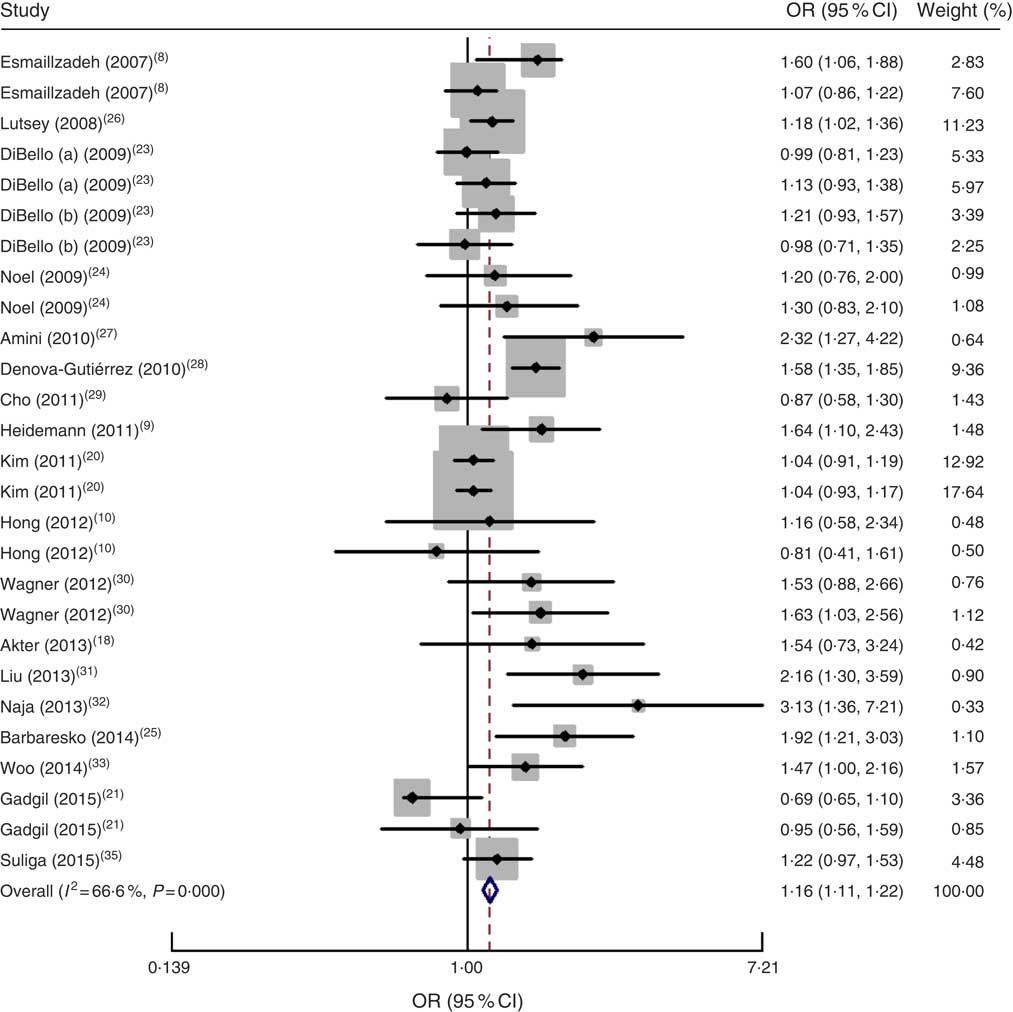
Fig. 3 Forest plot of ‘Unhealthy/Western’ dietary pattern and risk of metabolic syndrome for the highest category compared with the lowest. The study-specific OR and 95 % CI are represented by the black diamond and the horizontal line, respectively; the area of the grey square is proportional to the specific-study weight to the overall meta-analysis. The centre of the open diamond/vertical dashed line represents the pooled OR and the width of the open diamond represents the pooled 95 % CI
Publication bias
Funnel plots did not reveal asymmetry (Fig. 4). There was no publication bias for the ‘Healthy/Prudent’ dietary pattern (Egger’s test, P=0·65) or the ‘Unhealthy/Western’ dietary pattern (Egger’s test, P=0·34).
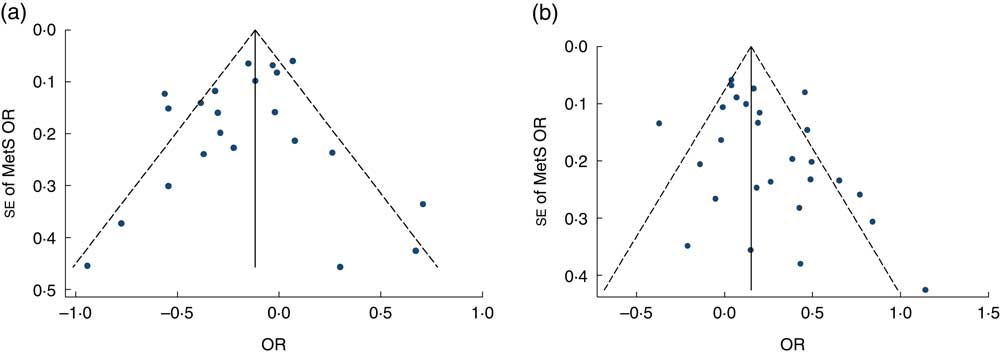
Fig. 4 Publication bias assessment of included studies on a posteriori dietary patterns and metabolic syndrome (MetS): funnel plot (●, individual study) with pseudo 95 % confidence limits (– – – – –) for (a) the ‘Healthy/Prudent’ dietary pattern and (b) the ‘Unhealthy/Western’ dietary pattern
Discussion
To our knowledge, the current systematic review and meta-analysis is the first that has assessed the association between a posteriori dietary patterns and risk of MetS. Our results indicated that a ‘Healthy/Prudent’ dietary pattern is inversely associated with risk of MetS, whereas a ‘Unhealthy/Western’ dietary pattern is positively associated with risk of MetS.
In the current study we used two common dietary patterns, i.e. ‘Healthy/Prudent’ and ‘Unhealthy/Western’, due to large variation in the number and description of dietary patterns. These two dietary patterns share most foods with similar factor loadings. Moreover, in the meta-analysis, we included studies that used PCA and factor analysis to derive dietary patterns. PCA has long-term reproducibility, stability and validity compared with other methods( Reference Hu 36 ) which could minimize the risk of bias and increase the accuracy of our results. We excluded studies which used cluster analysis for extracting dietary patterns. Cluster analysis is about grouping subjects (e.g. people) while factor analysis is about grouping variables. Obviously, cluster analysis and factor analysis yield different information about the data. In contrast to cluster analysis which implies an empirical classification or an a priori theoretically defined cluster structure, factor analysis uses the aspiration of establishing a theoretically based causal relationship between indicators (items)( Reference Krebs, Berger and Ferligoj 37 ). Another a posteriori method to study dietary patterns is reduced rank regression, which finds dietary patterns that are potentially relevant for a disease by using a priori knowledge, for example on biological risk factors or nutrients relevant for the disease of interest. In contrast to PCA and factor analysis, reduced rank regression does not describe naturally occurring patterns of the population under study but explains variation in biologically important risk factors( Reference Jankovic, Steppel and Kampman 38 , Reference Tucker 39 ).
In accordance with our study, a recent meta-analysis by Rodríguez-Monforte et al. showed that a prudent/healthy pattern is associated with a lower prevalence of MetS, whereas a Western/unhealthy pattern is associated with an increased risk for MetS( Reference Rodríguez-Monforte, Sánchez and Barrio 40 ). The risk for MetS through unhealthy dietary patterns was 1·22 in our study v. 1·28 in their study; however, the risk for MetS through healthy dietary patterns was 0·89 in our study v. 0·83 in Rodríguez-Monforte et al.’s study( Reference Rodríguez-Monforte, Sánchez and Barrio 40 ). It should be noted that their meta-analysis contained thirty-one studies including those which used cluster analysis. The dietary patterns identified using cluster methods could not be pooled with those identified by PCA or factor analysis because, as reported in other studies, large differences in factor scores between clusters have been observed, particularly for the factor with the largest variance. In a study by Smith et al. clusters were associated with high or low scores for a particular factor( Reference Smith, Emmett and Newby 41 ).
The ‘Healthy/Prudent’ dietary pattern was associated with lower risk of MetS. The ‘Healthy/Prudent’ dietary pattern included high factor loadings for fruits, vegetables, fish and whole grains, and low factor loadings for red and processed meat. However, we may have misclassification because the factor loadings of individual foods in the ‘Healthy/Prudent’ dietary pattern were not identical between studies and is a limitation for this type of analysis. Even modest amounts of measurement error may have a large impact on measures of MetS risk, and it is likely that the small inverse association shown is due to a combination of dietary measurement error and misclassification of populations into categories of dietary pattern. Additionally, PCA is a subjective technique with opportunities for variation at almost every step (e.g. a variation in the number and type of dietary patterns derived within each study and categories of dietary pattern score)( Reference Hu 36 , Reference Jacques and Tucker 42 ).
The ‘Healthy/Prudent’ dietary pattern is rich in fresh fruits, vegetables, whole grains and fish. It seems that high content of vitamins, minerals, antioxidants, fibre, MUFA and n-3 fatty acids in this dietary pattern is responsible for the protective effect of the ‘Healthy/Prudent’ dietary pattern against MetS and its components. In addition, higher adherence to the ‘Healthy/Prudent’ dietary pattern is associated with a lower risk of glucose intolerance, weight gain, inflammation and insulin resistance and a higher level of HDL cholesterol( Reference Fung, Willett and Stampfer 43 ). Furthermore, improvement in lipid profile, antioxidant capacity, systolic and diastolic blood pressure, arrhythmias and insulin sensitivity may be another possible explanation for the observed association( Reference Tourlouki, Matalas and Panagiotakos 44 ).
Our results showed that risk of MetS is higher in subjects who had higher level of adherence to an ‘Unhealthy/Western’ dietary pattern compared with subjects who had a lower level of adherence. The ‘Unhealthy/Western’ dietary pattern is composed of red meat, processed meat, refined grains, sweets, French fries, desserts, eggs and high-fat dairy products. The positive association between the ‘Unhealthy/Western’ dietary pattern and MetS may be related to high intakes of Fe( Reference Leiva, Mujica and Sepulveda 45 ), red meat( Reference Azadbakht and Esmaillzadeh 46 ) and high-glycaemic-index foods that increase the risk of MetS( Reference Finley, Barlow and Halton 47 ).
We found a moderate level of heterogeneity among included studies in both dietary patterns and risk of MetS, which may correlate to different versions of FFQ used to collect dietary intakes among included studies. Using different versions of FFQ could influence the selection of foods loaded on the dietary patterns. Moreover, various models used to control for confounding variables in included studies may explain the heterogeneity observed in the present study. However, in most of studies, the effect size was adjusted for major potential confounding variables including age, sex, BMI, education, energy intake and physical activity. It is possible that unmeasured variables such as cooking methods or food grouping may differ among studies and populations. Then it is inventible that we have very high levels of heterogeneity and some researchers may argue not to combine studies. However, heterogeneity seems to be always present( Reference Berlin 48 , Reference Kontopantelis, Springate and Reeves 49 ) and it may provide benefits for meta-analysis as we can explore the source of heterogeneity between studies( Reference Berlin 48 ). The other reason for heterogeneity in the current meta-analysis could be the broad range of age used in the original studies, because young adults have different dietary habits from older adults. Additionally, in PCA/factor analysis, the extracted components/factors are as many as the initial variables and in the published studies usually the main two or three major components are reported, based on eigenvalue. Then, if in a study an unhealthy pattern was extracted as a fifth component it will be missed out from our meta-analysis. The other limitation is the cross-sectional nature of studies included in the meta-analysis, which precludes causal inference, and another shortcoming of cross-sectional studies is the possibility that the dietary pattern may represent a post hoc event. To minimize and control all types of heterogeneity, individual patient data meta-analyses are recommended( Reference Oxman, Clarke and Stewart 50 ). Moreover, in our analysis, only the OR of being in the highest and the lowest quantile of healthy or unhealthy patterns have been used. This may be misleading as the presence of any trend cannot be evaluated. Finally, some studies might have used quintiles while others might have used tertiles, and this may have an effect on the OR.
Conclusion
In conclusion, our findings have indicated an inverse association between a ‘Healthy/Prudent’ dietary pattern and risk of MetS and a positive significant association between an ‘Unhealthy/Western’ dietary pattern and risk of MetS. To our knowledge, the present study is the first meta-analysis that has investigated the association between dietary patterns and risk of MetS; however, its limitations should be considered.
Acknowledgements
Financial support: This research received no specific grant from any funding agency in the public, commercial or not-for-profit sectors. Conflict of interest: The authors declare that there is no conflict of interest. Authorship: S.S.-B. and M.H. designed the study. S.S.-B. and M.H. contributed to the literature searches, data extraction and independent reviewing. M.G. and S.M. performed the statistical analyses. All authors contributed to the writing of the manuscript. M.G. and S.M. wrote a first draft of the manuscript and S.S.-B. prepared the final draft. All authors read the manuscript and approved it. Ethics of human subject participation: Not applicable.


