


I. INTRODUCTION
“Aminopentamide sulfate” (sold under the brand name Centrine®) is used to control vomiting, diarrhea, and gastrointestinal (GI) pain or spasms in dogs and cats. The observed antispasmodic properties of aminopentamide hydrogen sulfate can help control the discomfort associated with anorectal disease. The systematic name (CAS Registry Number 20701-77-3) is 4-(dimethylammonium)-2,2-diphenylpentanamide hydrogen sulfate. A two-dimensional molecular diagram is shown in Figure 1.
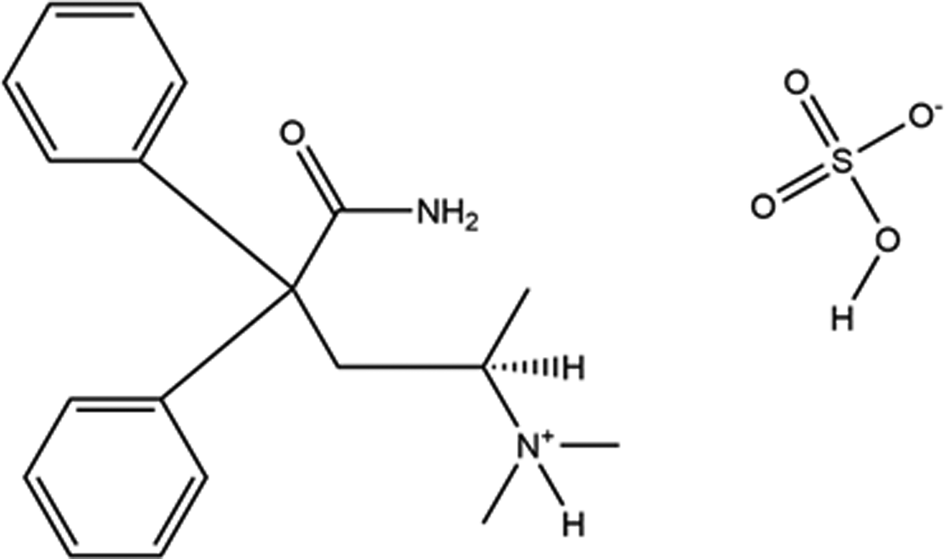
Figure 1. The 2D molecular structure of aminopentamide hydrogen sulfate.
The synthesis of aminopentamide was claimed in US Patent 2,647,926 (Speeter, Reference Speeter1953; Bristol Laboratories). The use of aminopentamide hydrogen sulfate in an anesthetic compound was claimed in US Patent 3,896,221 (Christie and Buckwalter, Reference Christie and Buckwalter1975; Bristol-Myers). The pharmacological activity of Centrine was reported in Hoekstra et al. (Reference Hoekstra, Tisch, Rakieten and Dickison1954). We are unaware of any published powder diffraction data on aminopentamide hydrogen sulfate.
This work was carried out as part of a project (Kaduk et al., Reference Kaduk, Crowder, Zhong, Fawcett and Suchomel2014) to determine the crystal structures of large-volume commercial pharmaceuticals and include high-quality powder diffraction data for them in the Powder Diffraction File (Gates-Rector and Blanton, Reference Gates-Rector and Blanton2019).
II. EXPERIMENTAL
Aminopentamide hydrogen sulfate was a commercial reagent, purchased from USP (Batch #F1B273), and was used as-received. The white powder was packed into a 1.5 mm diameter Kapton capillary and rotated during the measurement at ~50 Hz. The powder pattern was measured at 295 K at beamline 11-BM (Antao et al., Reference Antao, Hassan, Wang, Lee and Toby2008; Lee et al., Reference Lee, Shu, Ramanathan, Preissner, Wang, Beno, Von Dreele, Ribaud, Kurtz, Antao, Jiao and Toby2008; Wang et al., Reference Wang, Toby, Lee, Ribaud, Antao, Kurtz, Ramanathan, Von Dreele and Beno2008) of the Advanced Photon Source at Argonne National Laboratory using a wavelength of 0.458208(2) Å from 0.5 to 50° 2θ with a step size of 0.001° and a counting time of 0.1 s per step. The high-resolution powder diffraction data were collected using twelve silicon crystal analyzers that allow for high angular resolution, high precision, and accurate peak positions. A silicon (NIST SRM 640c) and alumina (SRM 676a) standard (ratio Al2O3:Si = 2:1 by weight) was used to calibrate the instrument and refine the monochromatic wavelength used in the experiment.
The pattern was difficult to index, until we allowed the possibility of up to 3 unindexed lines among the 20 peaks (I rel > 1%) using DICVOL14 (Louër and Boultif, Reference Louër and Boultif2014). A primitive monoclinic cell with a = 17.7176, b = 6.3740, c = 17.9396 Å, β = 96.537°, V = 2012.77 Å3, and Z = 4 was obtained, with figures of merit M(18) (de Wolff, Reference de Wolff1968) and F(18) (Smith and Snyder, Reference Smith and Snyder1979) = 20.7 and 178.6. A reduced cell search in the Cambridge Structural Database (Groom et al., Reference Groom, Bruno, Lightfoot and Ward2016) yielded five hits, but no structures of aminopentamide derivatives. Neither a name search on “aminopentamide” in the PDF-4 Organics database, nor a traditional search/match on the powder pattern yielded any hits.
An aminopentamide molecule was downloaded as Conformer3D_CID_22565.sdf from PubChem (Kim et al., Reference Kim, Chen, Cheng, Gindulyte, He, He, Li, Shoemaker, Thiessen, Yu, Zaslavsky, Zhang and Bolton2019). The file was converted to a *.mol2 file using Mercury (Macrae et al., Reference Macrae, Sovago, Cottrell, Galek, McCabe, Pidcock, Platings, Shields, Stevens, Towler and Wood2020) and to a Fenske-Hall Z-matrix using OpenBabel (O'Boyle et al., Reference O'Boyle, Banck, James, Morley, Vandermeersch and Hutchison2011). The structure was solved using Monte Carlo simulated annealing (parallel tempering) techniques as implemented in FOX (Favre-Nicolin and Černý, Reference Favre-Nicolin and Černý2002), with (sinθ/λ)max = 0.3 Å−1. The suggested space group was P21/c, which was confirmed by successful solution and refinement of the structure. Analysis of potential hydrogen bonding interactions indicated that N2 was protonated (N2⋯O50 = 2.612 Å), so H47 was added to it. The O49⋯O52 distance of 2.876 Å indicated that a proton was between these two atoms, so for the refinement H53 was placed at the midpoint of this interatomic vector. Twenty-two “extra” peaks could be indexed by DICVOL14 on a primitive monoclinic cell with a = 17.7067, b = 4.1812, c = 38.2550 Å, β = 94.907°, and V = 2821.82 Å3. This phase was added to the refinement as a second Le Bail phase. This Le Bail phase accounts for the non-overlapped impurity peaks, but has the potential to distort the intensities of the major phase in regions where there is peak overlap. Without a structure model or a pure sample of this phase, its concentration cannot be quantified without the addition of an internal standard.
Rietveld refinement was carried out using GSAS-II (Toby and Von Dreele, Reference Toby and Von Dreele2013). Only the 1.4–25.0° portion of the pattern was included in the refinement (d min = 1.058 Å). The region 1.60–1.95° 2θ, which contains scatter from the Kapton capillary, was excluded. All non-H bond distances and angles were subjected to restraints, based on a Mercury/Mogul Geometry Check (Bruno et al., Reference Bruno, Cole, Kessler, Luo, Motherwell, Purkis, Smith, Taylor, Cooper, Harris and Orpen2004; Sykes et al., Reference Sykes, McCabe, Allen, Battle, Bruno and Wood2011). The Mogul average and standard deviation for each quantity were used as the restraint parameters. The restraints contributed 1.8% to the final χ 2. The hydrogen atoms were included in calculated positions, which were recalculated during the refinement using Materials Studio (Dassault Systèmes, 2021). The U iso of the heavy atoms were grouped by chemical similarity. The U iso for the H atoms were fixed at 1.3× the U iso of the heavy atoms to which they are attached. The peak profiles were described using the generalized microstrain model. The background was modeled using a 6-term shifted Chebyshev polynomial, and a peak at 6.06° 2θ to model the scattering from the Kapton capillary and any amorphous component.
The final refinement of 110 variables using 23 279 observations and 75 restraints yielded the residuals R wp = 0.1161 and GOF = 2.02. The largest peak (at S48) and hole (1.37 Å from H44) in the difference Fourier map were 0.30(7) and −0.31(7) eÅ−3, respectively. The largest errors in the difference plot (Figure 2) are in the shapes and intensities of some of the strong low-angle peaks.
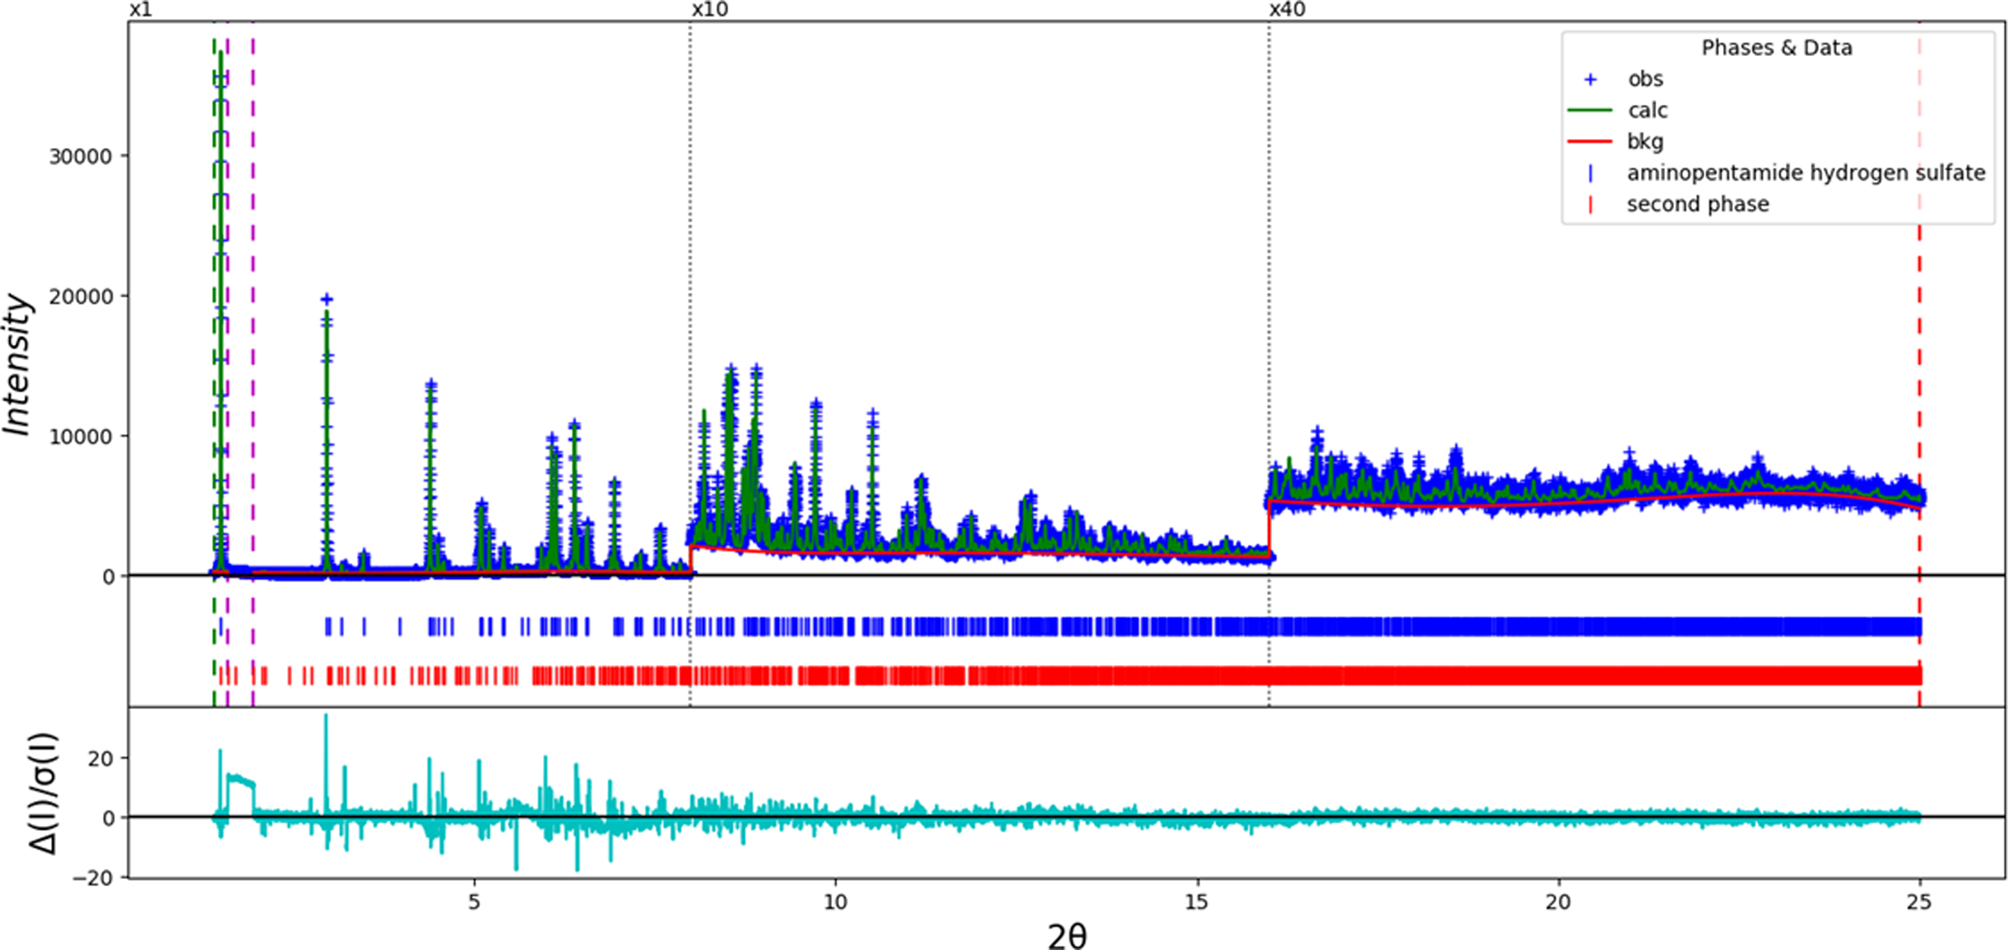
Figure 2. The Rietveld plot for the refinement of aminopentamide hydrogen sulfate. The blue crosses represent the observed data points, and the green line is the calculated pattern. The cyan curve is the normalized error plot. The vertical scale has been multiplied by a factor of 10× for 2θ > 8.0° and by 40× for 2θ > 16.0°. The row of blue tick marks indicates the calculated reflection positions of aminopentamide hydrogen sulfate, and the row of red tick marks indicates the peaks from the second unidentified phase.
The crystal structure was optimized using VASP (Kresse and Furthmüller, Reference Kresse and Furthmüller1996) (fixed experimental unit cell) through the MedeA graphical interface (Materials Design, 2016). The calculation was carried out on 16 2.4 GHz processors (each with 4 GB RAM) of a 64-processor HP Proliant DL580 Generation 7 Linux cluster at North Central College. The calculation used the GGA-PBE functional, a plane wave cutoff energy of 400.0 eV, and a k-point spacing of 0.5 Å−1 leading to a 1 × 2 × 1 mesh, and took ~42 h. A single-point density functional calculation (fixed experimental cell) and population analysis were carried out using CRYSTAL17 (Dovesi et al., Reference Dovesi, Erba, Orlando, Zicovich-Wilson, Civalleri, Maschio, Rerat, Casassa, Baima, Salustro and Kirtman2018). The basis sets for the H, C, N, and O atoms in the calculation were those of Gatti et al. (Reference Gatti, Saunders and Roetti1994), and that for S was that of Peintinger et al. (Reference Peintinger, Vilela Oliveira and Bredow2013). The calculations were run on a 3.5 GHz PC using 8 k-points and the B3LYP functional, and took ~3.3 h.
III. RESULTS AND DISCUSSION
The root-mean-square Cartesian displacement between the Rietveld-refined and DFT-optimized structures of the aminopentamide cation is 0.361 Å (Figure 3); the maximum difference is 0.769 Å at the methyl group C16. The agreement is at the upper end of the range of correct structures (van de Streek and Neumann, Reference van de Streek and Neumann2014). The agreement of the absolute positions of the cations and anions in the unit cell is reasonable (Figure 4). This discussion concentrates on the DFT-optimized structure. The asymmetric unit (with atom numbering) is illustrated in Figure 5. The best view of the crystal structure is down the b-axis (Figure 6). The structure consists of layers parallel to the bc-plane with hydrogen sulfate anions at the core and aminopentamide cations on the outside. The interlayer regions consist of parallel and herringbone stacking of phenyl rings.
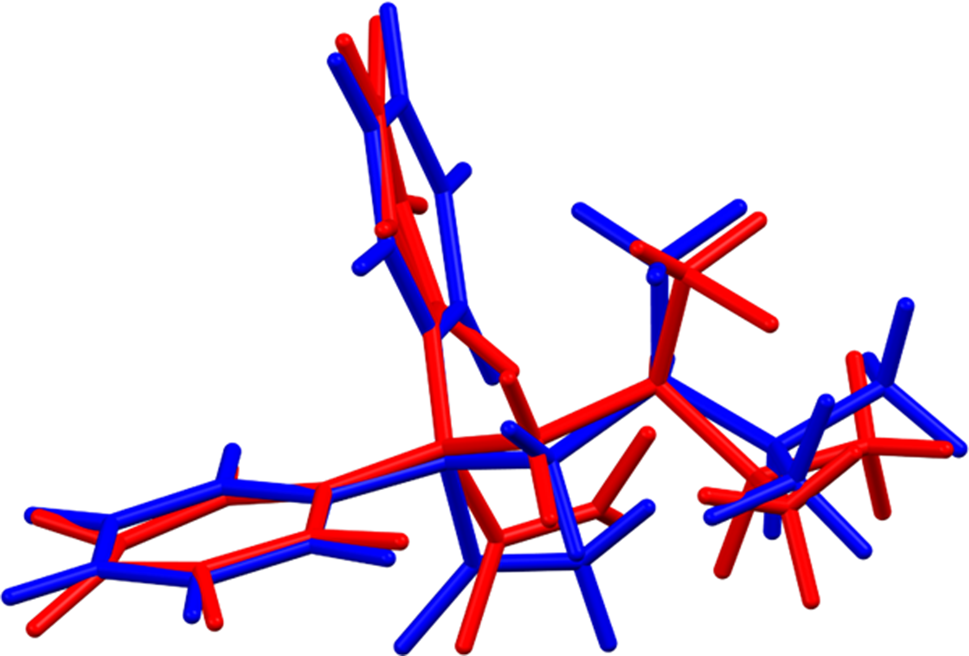
Figure 3. Comparison of the Rietveld-refined (red) and VASP-optimized (blue) structures of the aminopentamide cation. The rms Cartesian displacement is 0.361 Å. Image generated using Mercury (Macrae et al., Reference Macrae, Sovago, Cottrell, Galek, McCabe, Pidcock, Platings, Shields, Stevens, Towler and Wood2020).
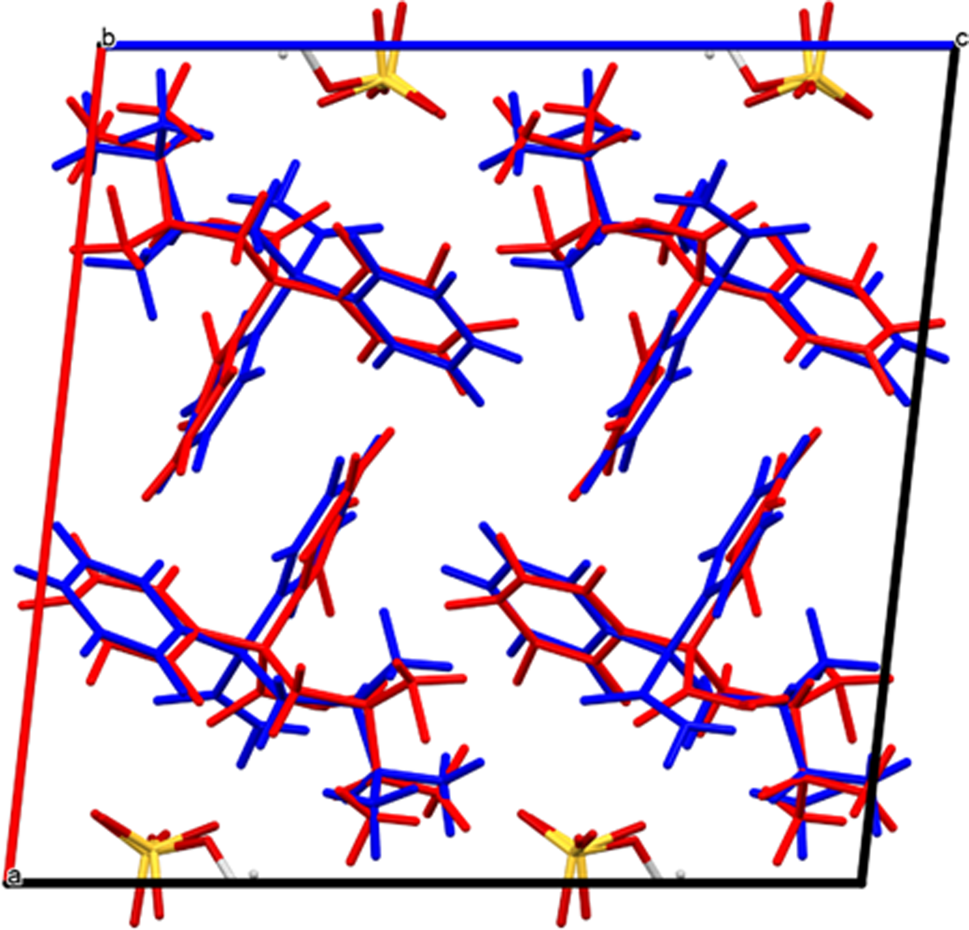
Figure 4. Comparison of the Rietveld-refined (red) and VASP-optimized (blue) structures of aminopentamide hydrogen sulfate. The cations are colored red and blue, while the hydrogen sulfate anions are colored by atom type for both structures.
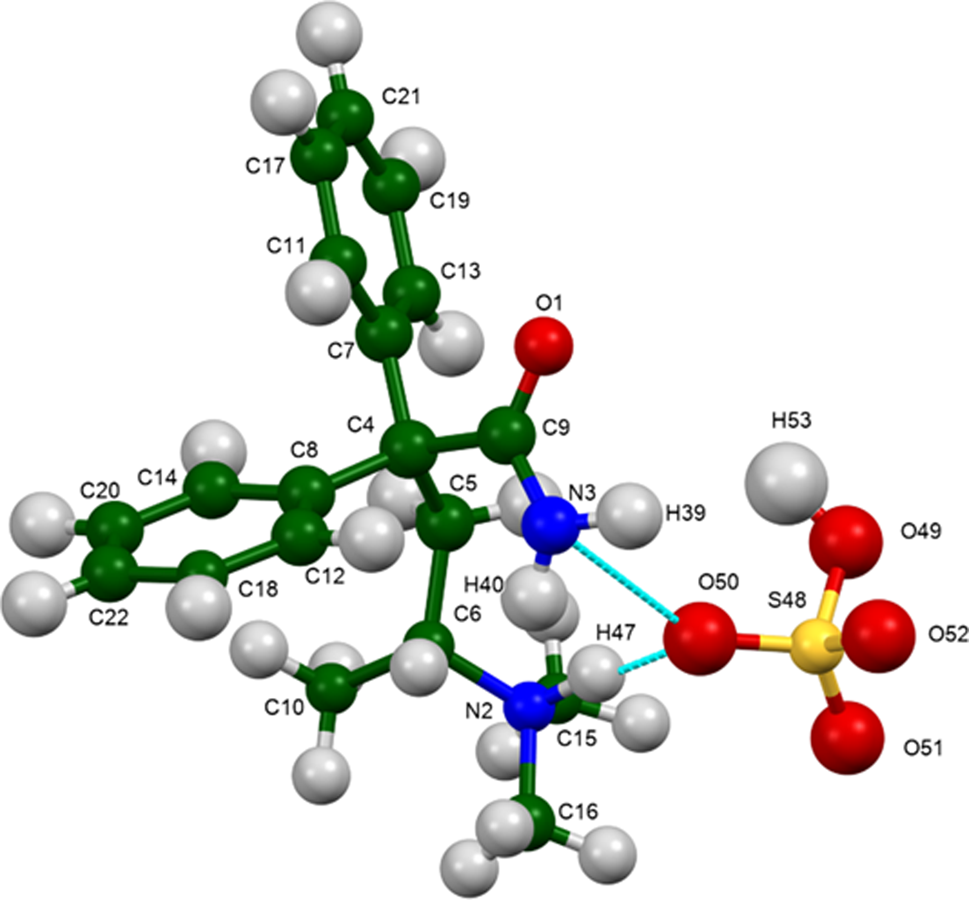
Figure 5. The asymmetric unit of aminopentamide hydrogen sulfate, with the atom numbering. The atoms are represented by 50% probability spheroids/ellipsoids. Image generated using Mercury (Macrae et al., Reference Macrae, Sovago, Cottrell, Galek, McCabe, Pidcock, Platings, Shields, Stevens, Towler and Wood2020).
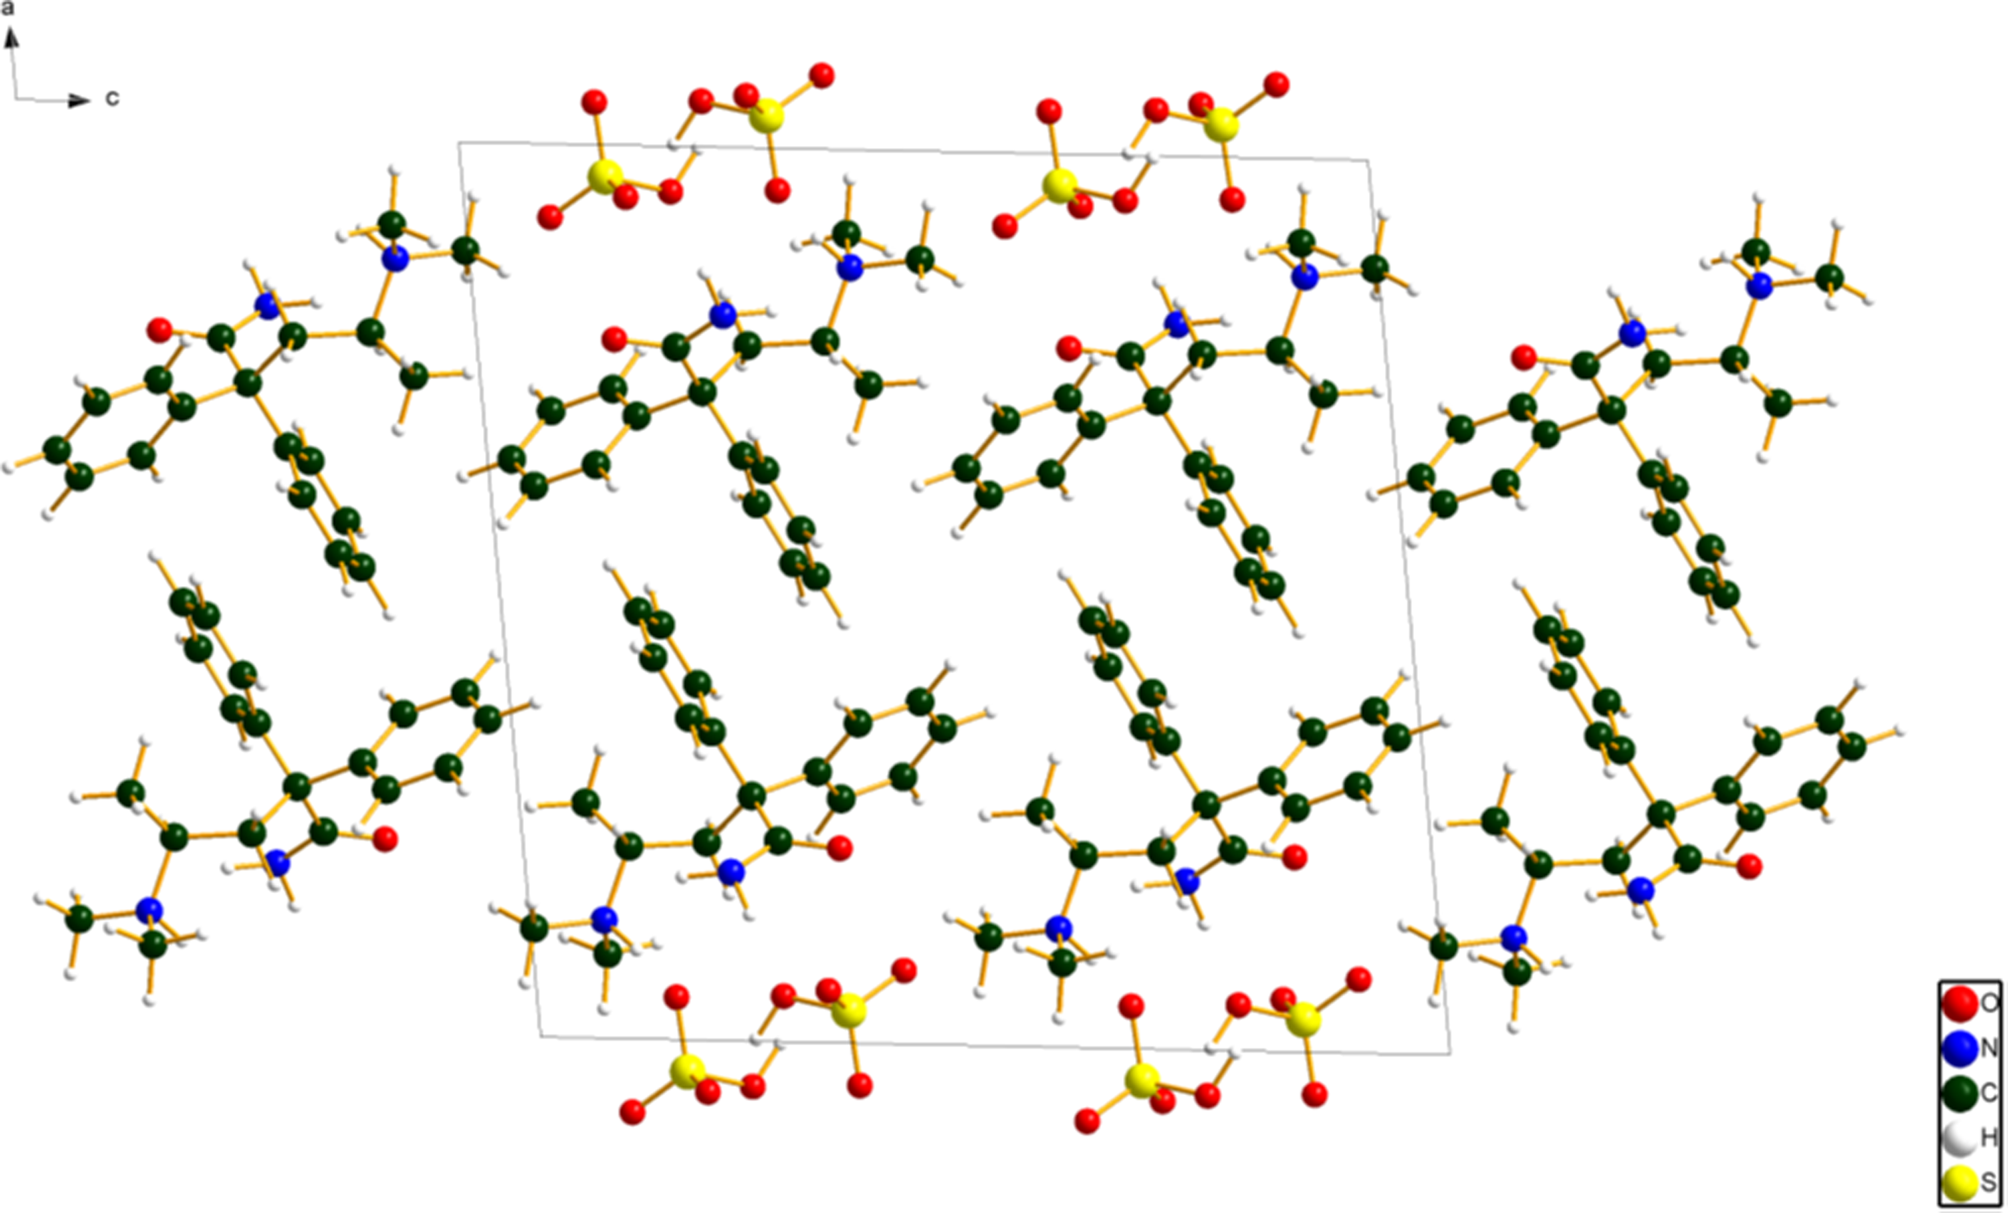
Figure 6. The crystal structure of aminopentamide hydrogen sulfate, viewed down the b-axis. Image generated using diamond (Crystal Impact, 2022).
All of the bond distances and angles fall within the normal ranges indicated by a Mercury/Mogul Geometry check (Macrae et al., Reference Macrae, Sovago, Cottrell, Galek, McCabe, Pidcock, Platings, Shields, Stevens, Towler and Wood2020). The torsion angle C9–C4–C5–C6 is flagged as unusual; this lies on the tail of a major gauche population of similar torsion angles. The unusual O1–C9–C4–C7 and C7–C4–C9–N3 torsion angles lie in a broad distribution of a small number of similar torsion angles. The C10–C6–C5–C4 torsion angle lies in a minor gauche population of mainly trans torsion angles. The conformation of the cation is slightly unusual.
Quantum chemical geometry optimization of the aminopentamide cation (DFT/B3LYP/6-31G*/water) using Spartan ‘18 (Wavefunction, Inc., 2020) indicated that the observed conformation is 10.2 kcal mol−1 higher in energy than the local minimum (Figure 7). A conformational analysis (MMFF force field) indicates that the minimum-energy conformation is 7.2 kcal mol−1 lower in energy; the conformational differences are spread throughout the cation (Figure 8). Intermolecular interactions thus affect the solid-state conformation.
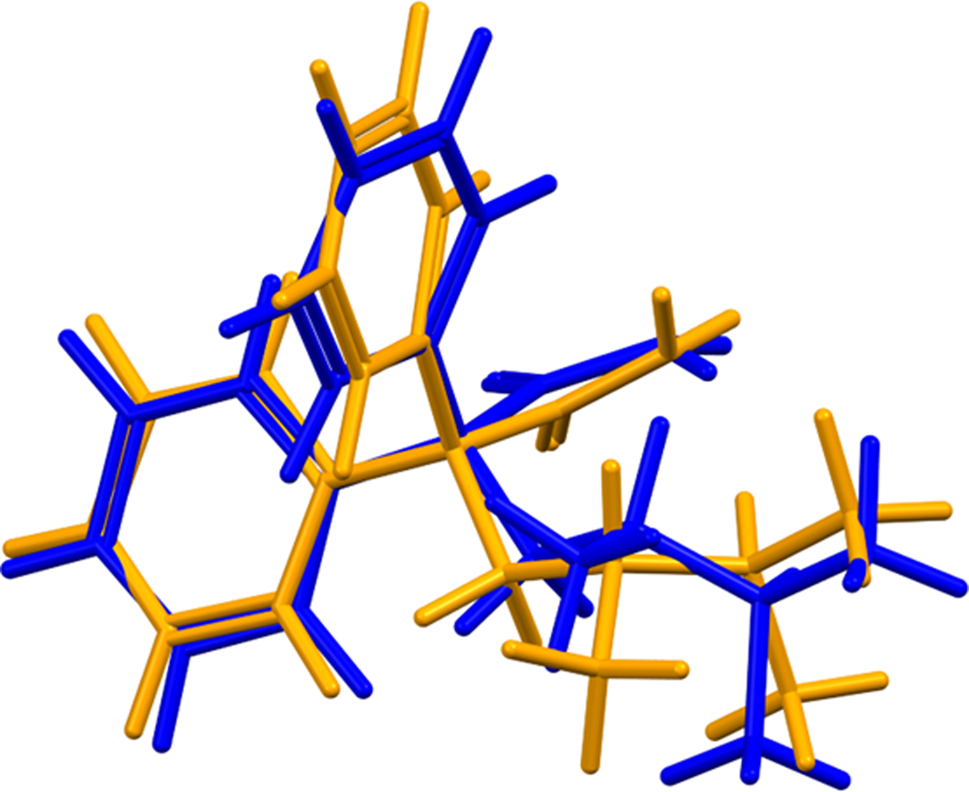
Figure 7. Comparison of the VASP-optimized (blue) and local minimum-energy conformations (orange) of the aminopentamide cation.
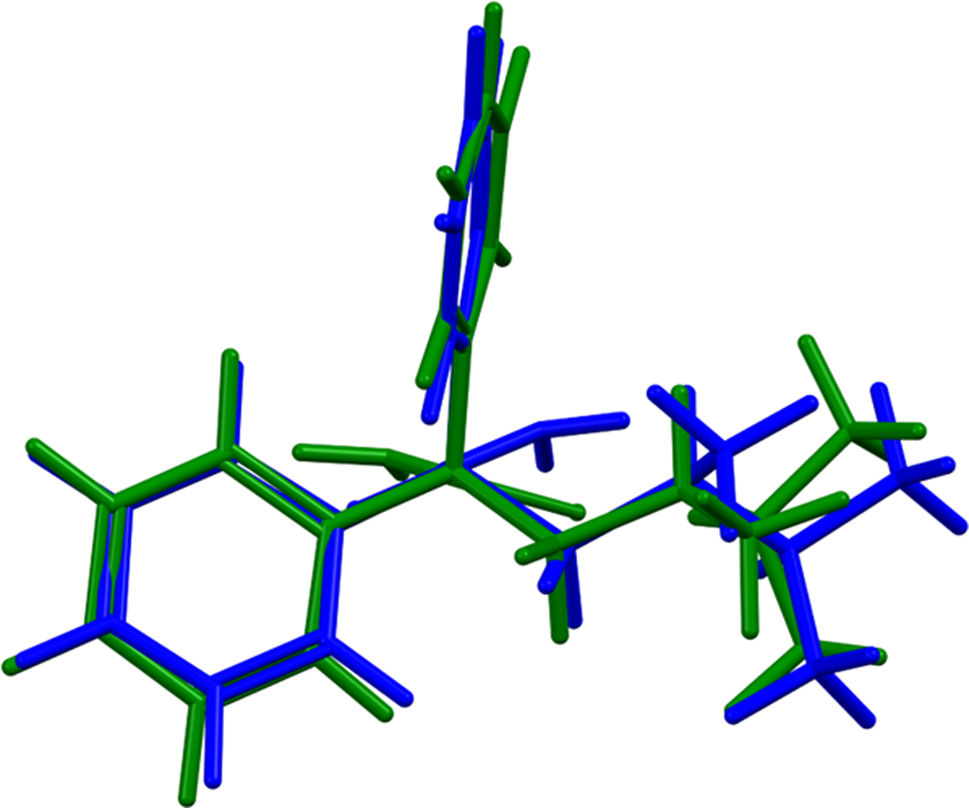
Figure 8. Comparison of the VASP-optimized (blue) and global minimum-energy conformations (green) of the aminopentamide cation.
Analysis of the contributions to the total crystal energy of the structure using the Forcite module of Materials Studio (Dassault Systèmes, 2021) suggests that the intramolecular deformation energy is dominated by angle deformation terms. The intermolecular energy is dominated by electrostatic attractions, which in this force field analysis also include hydrogen bonds. The hydrogen bonds are better analyzed using the results of the DFT calculation.
Hydrogen bonds are prominent in the structure (Table I). There is a strong charge-assisted O49–H53⋯O52 hydrogen bond between the hydrogen sulfate anions. The energy of this hydrogen bond was calculated using the correlation of Rammohan and Kaduk (Reference Rammohan and Kaduk2018). This hydrogen bond links the anions parallel to the b-axis in a chain with a graph set (Etter, Reference Etter1990; Bernstein et al., Reference Bernstein, Davis, Shimoni and Chang1995; Shields et al., Reference Shields, Raithby, Allen and Motherwell2000) C1,1(4). There is also a weaker O49–H53⋯S48 interaction. The cation forms a discrete N2–H47⋯O50 hydrogen bond to the anion. The energies of the N–H⋯O hydrogen bonds were calculated using the correlation of Wheatley and Kaduk (Reference Wheatley and Kaduk2019). The amide group N3/H39/H40 also forms two weaker discrete hydrogen bonds to the anion. The three N–H⋯O hydrogen bonds link the cations and anions into columns parallel to the b-axis. There are three C–H⋯O hydrogen bonds, both to the anion and to the carbonyl oxygen O1. The intramolecular C10–H28⋯C14 hydrogen bond links a methyl group and a phenyl ring. The C21–H45⋯C18 hydrogen bonds indicate an end-side phenyl–phenyl ring interaction.
Table I. Hydrogen bonds (CRYSTAL17) in aminopentamide hydrogen sulfate.
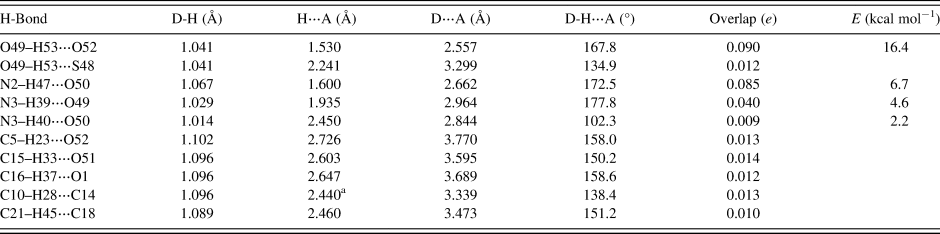
a Intramolecular.
The volume enclosed by the Hirshfeld surface of aminopentamide hydrogen sulfate (Figure 9; Hirshfeld, Reference Hirshfeld1977; Turner et al., Reference Turner, McKinnon, Wolff, Grimwood, Spackman, Jayatilaka and Spackman2017) is 487.96 Å3, 98.38% of 1/4 the unit cell volume. The packing density is thus fairly typical. The only significant close contacts (red in Figure 9) involve the hydrogen bonds. The average volume/non-hydrogen atom is 18.4 Å3.
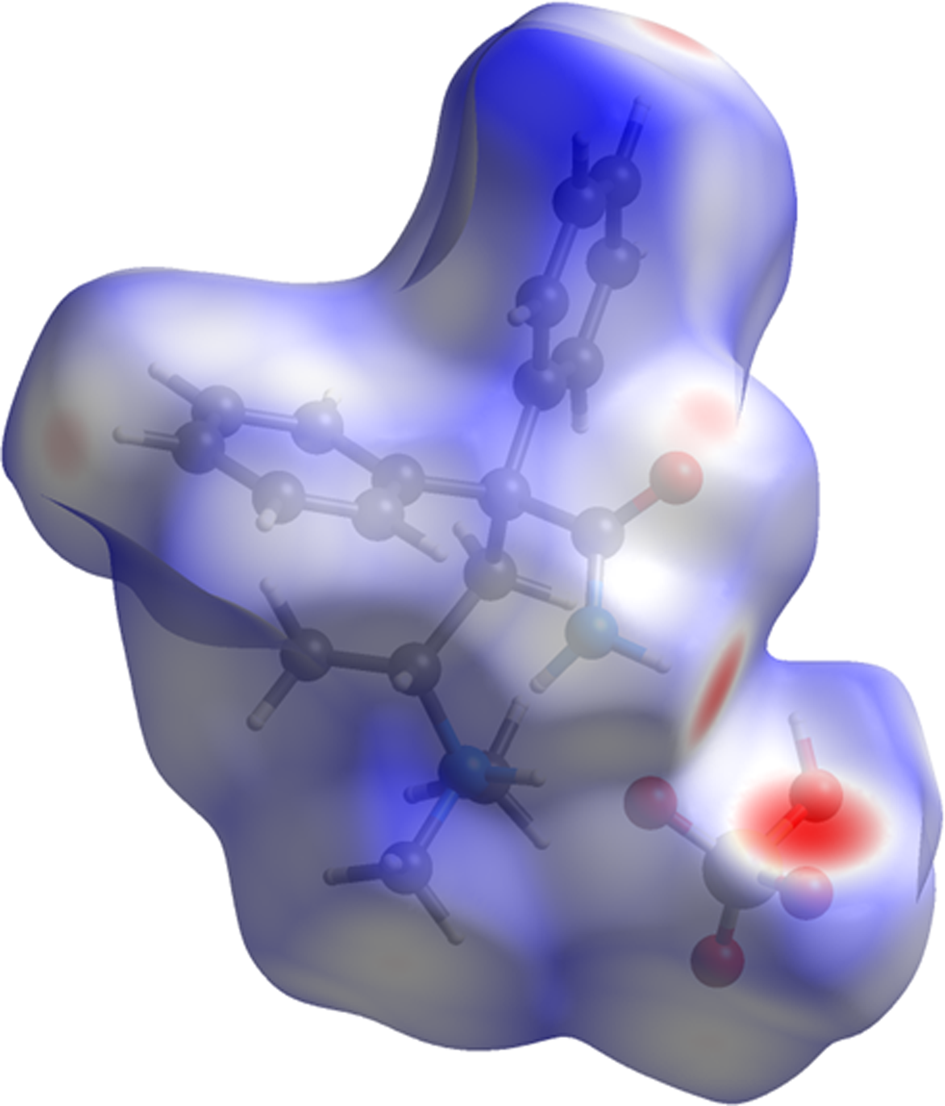
Figure 9. The Hirshfeld surface of aminopentamide hydrogen sulfate. Intermolecular contacts longer than the sums of the van der Waals radii are colored blue, and contacts shorter than the sums of the radii are colored red. Contacts equal to the sums of radii are white.
The Bravais–Friedel–Donnay–Harker (Bravais, Reference Bravais1866; Friedel, Reference Friedel1907; Donnay and Harker, Reference Donnay and Harker1937) morphology suggests that we might expect platy morphology for aminopentamide hydrogen sulfate, with {100} as the major faces. A second-order spherical harmonic model was included in the refinement. The texture index was 1.014(0), indicating that preferred orientation was slight in this rotated capillary specimen. The powder pattern of aminopentamide hydrogen sulfate from this synchrotron data set has been submitted to ICDD for inclusion in the Powder Diffraction File.
IV. DEPOSITED DATA
The Crystallographic Information Framework (CIF) files containing the results of the Rietveld refinement (including the raw data) and the DFT geometry optimization were deposited with the ICDD. The data can be requested at info@icdd.com.
ACKNOWLEDGEMENTS
The use of the Advanced Photon Source at Argonne National Laboratory was supported by the U.S. Department of Energy, Office of Science, Office of Basic Energy Sciences, under Contract No. DE-AC02-06CH11357. This work was partially supported by the International Centre for Diffraction Data. We thank Lynn Ribaud and Saul Lapidus for their assistance in the data collection.
CONFLICT OF INTEREST
The authors have no conflicts of interest to declare.


 Open access