
In the first edition I wrote: “Rapidly accumulating evidence indicates that sulfur deficiencies may be more widespread in the tropics than potassium deficiencies. Sulfur deficiencies have been unconsciously corrected by the use of sulfur-bearing fertilizers such as ammonium sulfate and single superphosphate. With the use of high-analysis sources that contain no sulfur, such as urea and triple superphosphate, reports of severe sulfur deficiencies have become widespread.” That was an understatement.
The sulfur-bearing fertilizers actually contain more sulfur (S) than nitrogen (N) or phosphorus (P) (ammonium sulfate contains 21 percent N and 24 percent S; single superphosphate contains 9 percent P and 12 percent S), thereby preventing sulfur deficiencies (Weil and Mughogho Reference Weil and Mughogho2000). On the positive side, atmospheric deposition of sulfur nowadays plays a major role, but higher-yielding crop cultivars require more nutrients because of their higher biomass. Weil and Mughogho also suspected that mineralization of soil organic sulfur, and manure applications that provide sufficient sulfur to produce 1 t/ha of grain crop yield, are unable to do so with higher-yielding cultivars (Fig. 15.1).

Fig. 15.1 Sulfur response in wheat in Arsi, Ethiopian Highlands. Nutrients added are indicated; CK = control plot.
Widespread sulfur deficiencies and crop yield responses to sulfur have been reported throughout the tropics for over half a century, with Greenwood’s (Reference Greenwood1951) work in the savannas of northern Nigeria being among the first. This contrasts with the history of field research on sulfur deficiency in the temperate region (Haneklaus et al. Reference Haneklaus, Bloem, Schnug and Jez2008), where major efforts started in the 1980s – with noteworthy exceptions, such as earlier research on Ultisols of the southeastern United States (Ensminger Reference Ensminger1954, Kamprath et al. Reference Kamprath, Nelson and Fitts1957).
One of the first tropical reports was from the Cerrado of Brazil, where McClung et al. (Reference McClung, de Freitas and Lott1959) observed crop responses to sulfur. In Central America, sulfur deficiencies are also widespread, particularly in Andisols, where their volcanic origin would lead one to assume that such soils would be high in available sulfur (Muller Reference Muller1965, Bornemisza and Llanos Reference Bornemisza and Llanos1967, Fitts Reference Fitts1970). Volcanic ash soils are often high in sulfates but sulfur is rapidly leached in humid climates (Hasan et al. Reference Hasan, Fox and Boyd1970). In Africa, sulfur is limiting in Alfisols and Oxisols with annual rainfall greater than 600 mm (Bolle-Jones Reference Bolle-Jones1964). Sulfur deficiencies are known to occur in Asia, particularly the Indo-Gangetic Plain of southern Asia and in Malaysia (Olson and Englestad Reference Olson and Englestad1972). They also have been reported in Australia (Williams Reference Williams and Donald1972), Hawaii (Fox et al. Reference Fox1971) and Zambia (Vogt Reference Vogt1966).
Since the 1980s, reports of sulfur deficiencies from all over the tropics have continued (Kanwar and Mudahar Reference Kanwar and Mudahar1986, Buri et al. Reference Buri, Masunaga and Wakatsuki2000, Itanna Reference Itanna2005, Lilienfein et al. Reference Lilienfein, Wilcke, Ayarza, Vilela, Lima and Zech2000, Weil and Mughogho Reference Weil and Mughogho2000, Ribeiro et al. Reference Ribeiro, Dias, Alvarez, Mello and Daniels2001, Yamada et al. Reference Yamada, Stipp and Vitti2007, Khurana et al. Reference Khurana, Sadana, Singh and Jez2008, Weil Reference Weil2011 and many others). From the temperate region, a book was published by the American Society of Agronomy with the noteworthy title, Sulfur: A Missing Link between Soils, Crops and Nutrition, edited by Joseph Jez (Jez Reference Jez2008). However, generally little attention continues to be given to sulfur deficiency in spite of the fact that it not only decreases crop yields but decreases the formation of two amino acids in plants, methionine and cysteine, and hence of protein, with the direct detriment to human and animal nutrition.
Sulfur deficiency to plant growth occurs in a wide variety of soils. These are often sandy, well-drained and subject to leaching, with variable- or permanent-charge mineralogy, and low in soil organic matter (SOM). Soils subject to repeated annual burning are often sulfur-deficient because most of the plant sulfur is volatilized by fire. Sulfur-deficient soils generally occur in unpolluted inland areas where the atmosphere is low in sulfur.
Unlike nitrogen deficiency, which starts as chlorosis (yellowing) of the older leaves, sulfur deficiency starts as chlorosis of the younger leaves (shown Fig. 12.1). Chlorophyll meters or other spectrally based instruments can establish the degree of deficiency of nitrogen when aimed at the older leaves and for sulfur when aimed at the younger leaves. Iron deficiencies show similar symptoms, but since they occur only on calcareous soils, chlorosis of the youngest leaves in soils below pH 7.2 is likely to indicate sulfur deficiency.
15.1 The Sulfur Cycle
The sulfur cycle contains elements of both the nitrogen and phosphorus cycle. It resembles the nitrogen cycle in that the atmosphere plays an important role, although its sulfur content is very small. It also resembles the nitrogen cycle, in that most of the topsoil’s sulfur is in the organic form and that sulfur undergoes similar mineralization–immobilization processes; and also as sulfate anions, like nitrate, can both be retained in subsoils by anion exchange and can be leached. The sulfur cycle resembles the phosphorus cycle in that the original sources of sulfur are primary minerals and that sulfur retention is important in soils high in iron and aluminum oxides. It differs from both cycles in that microbial oxidation–reduction (redox) reactions play a central role. Figure 15.2 shows the main stocks and flows.

Fig. 15.2 The global soil sulfur cycle. Assembled from Stevenson (Reference Stevenson1986), Parton et al. (Reference Parton, Sanford, Sanchez, Stewart, Coleman, Oades and Uehara1989), Ribeiro et al. (Reference Ribeiro, Dias, Alvarez, Mello and Daniels2001), Aita and Giacomini (Reference Aita, Giacomini, Yamada, Stipp and Vitti2007), Brady and Weil (Reference Brady and Weil2008), Dick et al. (Reference Dick, Kost, Chen and Jez2008), Schoenau and Malhi (Reference Schoenau, Malhi and Jez2008) and my own ideas. Stocks in green are mainly in the oxidized state, those in red are in the reduced state and those in purple are in both. The legend for the flows is in different colors.
Redox reactions are central to the sulfur cycle, and most are carried out by bacteria. Oxidation of elemental sulfur, sulfides and thiosulfates to sulfate are carried by the autotrophic genus Thiobacillus and the heterotrophic genera Pseudomonas, Arthrobacter and Bacillus. Autotrophic bacteria of the genera Desulfovibrio and Desulfotomacalum are responsible for the reduction of sulfates into sulfides and elemental sulfur (Brady and Weil Reference Brady and Weil2008, Schoenau and Malhi Reference Schoenau, Malhi and Jez2008). The main oxidation reactions are the oxidation of hydrogen sulfide (H2S) and elemental sulfur (S) to sulfate (SO42–):
Equation 15.2 is relevant when applying elemental sulfur as fertilizer, which is in the reduced state. This equation also partly explains the acidifying effect of ammonium sulfate fertilizers.
The main reduction reaction is the reduction of sulfate to sulfide using an electron acceptor, in this case an alcohol (RCH2OH):
15.1.1 Sources of Soil Sulfur
The main sulfur inputs to soils are from primary minerals, organic inputs and atmospheric deposition of sulfur.
The primary soil minerals are gypsum (CaSO4·2H2O) and pyrite (FeS2) in igneous rocks, also known as fool’s gold. Gypsum is highly soluble in acid soils, rapidly producing SO42– ions. It can accumulate in Aridisols (suborder Gypsids), which cover 28 million hectares in tropical deserts. Such accumulation has been recorded in Aridisols of northern Kenya (Hesse Reference Hesse1957) and the Ethiopian Rift Valley (Itanna Reference Itanna2005). Pyrite requires microbial oxidation to transform S into SO42- as indicated in Fig. 15.2. The SO42– ions are readily taken up by roots. Sulfide ions (S2-) and S are in the reduced state and are not available to plants.
Organic inputs of plant origin, including manures, generally contain about 0.3 percent S in dry mass, but low-quality cattle manures in Africa contain about 0.1 percent (Chapter 11). The factors affecting their decomposition in soils are presumed to be similar to organic nitrogen inputs, described in Chapter 13.
The atmosphere contains various forms of sulfur gases, including sulfur dioxide (SO2), carbonyl sulphide (COS), H2S, plus solid aerosols. Their main sources are volcanic eruptions, biomass burning, H2S emissions from soils and wetlands, sea spray, SO2 from electricity generation (burning high-sulfur coal) and the combustion of high-sulfur diesel fuels. The decomposition of organic resources, particularly under anaerobic conditions, also produces H2S emissions. These gases are eventually oxidized to sulfuric acid (H2SO4) in the atmosphere, which along with nitric acid causes acid rain. Rainfall contributes sulfur from sea spray near the oceans. Atmospheric deposition rates were as high as 200 kg S/ha per year, downwind from industrial areas with no pollution controls (Stevenson Reference Stevenson1986). They are now 8–15 kg S/ha per year around industrial areas with effective clean-air controls in rich countries, but not around rapidly developing industrial areas in the tropics. Brady and Weil (Reference Brady and Weil2008) estimate the atmospheric deposition to be very small, 1–4 kg S/ha per year, in Africa.
Atmospheric sulfur gases such as SO2 can also be taken up by the stomata of plant leaves and by the surfaces of fruits and then converted into SO42–. Dick et al. (Reference Dick, Kost, Chen and Jez2008) consider that a concentration of at least 60 ppm S in the atmosphere can provide adequate sulfur nutrition to plants, absorbed both by soils and the plants themselves.
15.1.2 Total Sulfur
In the temperate region, total topsoil sulfur is positively correlated with SOM content and inversely correlated with the degree of weathering. Olson and Englestad (Reference Olson and Englestad1972) provided the following average topsoil values for total sulfur in the temperate region: 500 mg/kg for Mollisols, 400 mg/kg for Alfisols and 200 mg/kg for Ultisols. Following this reasoning, they assumed that most tropical soils would average about 100 mg/kg. A summary of eastern Australian soils by Williams and Steinbergs (Reference Williams and Steinbergs1958) shows an average content of 167 mg/kg S. Andisols that are high in organic matter and allophane, however, have large quantities of total sulfur. A Eutrudand from Hawaii contained 1280 mg/kg S in its topsoil (Fox et al. Reference Fox1971), while a clayey Oxisol under native savanna contained 251 mg/kg S and a sandy Ultisol only 40 mg/kg S, the latter two from Brazil (McClung et al. Reference McClung, de Freitas and Lott1959).
Unlike phosphorus, the subsoil often contains significant quantities of sulfur, which is very relevant to soil fertility management, especially in the tropics.
In neutral and alkaline soils, sulfate salts of calcium and magnesium can accumulate.
15.1.3 Organic Sulfur
Most (> 95 percent) of the sulfur in topsoils outside of arid climates is in the organic form. In subsoils with variable-charge clays, the relationship often flips over, with the vast majority being inorganic sulfur because of sulfate retention processes (Fig. 15.2). Hesse (Reference Hesse1957) was probably the first to report such a profile pattern, in forest soils of Kenya, Uganda and Tanzania. The C:N:S ratio of SOM is about 126:10:1 for soils of Nigeria and eastern Australia, according to surveys by Oke (Reference Oke1971) and Williams and Steinbergs (Reference Williams and Steinbergs1958).
Soil organic sulfur stocks can be grouped into three fractions depending on their redox status and turnover rates: ester sulfates, carbon-bonded sulfur and inert organic sulfur (So) (Fig. 15.2). The oxidized forms are the ester sulfates (R–O–S) and thioglucosides and sulfamates (R–N–S) where carbon is not directly bonded to sulfur. They are easily hydrolyzed into sulfates, and in the case of the esters they are easily cleaved by extracellular enzymes, largely aryl sulfatase, as in the ester phosphates described in the previous chapter. Carbon-bonded sulfides (R–C–S) comprise complex reduced forms that include the amino acids methionine, cysteine and cystine. Many are chemically recalcitrant to mineralization (Schoenau and Malhi Reference Schoenau, Malhi and Jez2008). Inert organic sulfur can range from 3 percent to 59 percent of the organic sulfur and has very slow turnover (Aita and Giacomini Reference Aita, Giacomini, Yamada, Stipp and Vitti2007).
These three fractions resemble the active, slow and passive soil organic carbon (SOC) fractions in the Century model (Parton et al. Reference Parton, Sanford, Sanchez, Stewart, Coleman, Oades and Uehara1989). They are eventually mineralized under aerobic conditions at different turnover rates into SO42– ions, which are taken up by plants (Fig. 15.2).
15.1.4 Mineralization
Barrow (Reference Barrow1961) found that organic sulfur mineralization occurs at C:S ratios lower than 200, while organic compounds with a C:S ratio > 400 or a sulfur concentration of less than 0.15 percent S are immobilized into microbial biomass, but eventually mineralized. The processes could go either way in ratios between 200 and 400 C:S (Dick et al. Reference Dick, Kost, Chen and Jez2008). Andisols and other soils that are high in allophane are often high in organic sulfur, but plants growing on these soils are often deficient in sulfur because the mineralization rate of SOM is very slow when intimately associated with allophane (Munévar and Wollum Reference 429Munévar and Wollum1977).
Flushes of sulfur mineralization upon wetting of previously dried soils have also been observed by Barrow (Reference Barrow1961). It seems logical to assume that the processes involved are similar to those governing nitrogen flushes – the Birch effect. In fact, Cooper (Reference Cooper1972) found increased aryl sulfatase activity at the start of the rainy season after a 6-month dry season in Alfisols of northern Nigeria. This ectoenzyme is responsible for the mineralization of sulfate esters. The fate of the mineralized sulfur, however, may be different from that of nitrates because of the sulfur sorption capacity of many soils of the tropics.
15.1.5 Inorganic Sulfur
Sulfates are the main inorganic form of sulfur in aerobic soils, and plants take it directly from the soil solution by mass flow pulled by the transpiration stream. Sulfates represent less than 5 percent of the total soil sulfur in the topsoil since most sulfur is present in the three organic pools shown in Fig. 15.2. Sulfate fertilizers like gypsum rapidly dissolve in acid soils and are immediately available to plants unless microorganisms immobilize them earlier to satisfy their needs, but then they are subsequently mineralized and made available to plants – just like nitrogen.
Reduced sulfur fertilizers like elemental sulfur have to be oxidized into sulfate before they can be taken up by plants. The same is the case with the primary mineral pyrite. In anaerobic soils, most of the oxidized forms of sulfate (gypsum [either as a primary mineral or fertilizer], some of the organic ester sulfates and soil solution SO42–) are reduced to sulfites and H2S. Some of the H2S is volatilized and some reacts with reduced iron to form pyrite (not shown in Fig. 15.2). So, how do rice and other plants that thrive under anaerobic conditions take up sulfur? Oxidation occurs in the rhizosphere of such plants and oxygen is thus actually transported from the shoots to the roots and exuded to the rhizosphere – like a sort of snorkel effect, similar to that used by divers (Chapter 17).
15.1.6 Plant Uptake
Plant roots only take up sulfur in the oxidized sulfate form, which is reduced to sulfides (S2–) after entering the plants and later converted to the amino acid cysteine (Malavolta and Moraes Reference Malavolta, Moraes, Yamada, Stipp and Vitti2007). Cysteine is then converted into methionine and most other organic sulfur compounds (Kovar and Grant Reference Kovar, Grant, Hatfield and Sauer2011). As mentioned before, stomata in plant leaves and some fruits also take up sulfur from the air.
Although we focus on the role of sulfur in amino acids and protein formation, Malavolta and Moraes (Reference Malavolta, Moraes, Yamada, Stipp and Vitti2007) remind us that “sulfur is present in all functions and processes that are part of the life of higher plants, from ion uptake to RNA and DNA.”
15.1.7 Changes with Cultivation
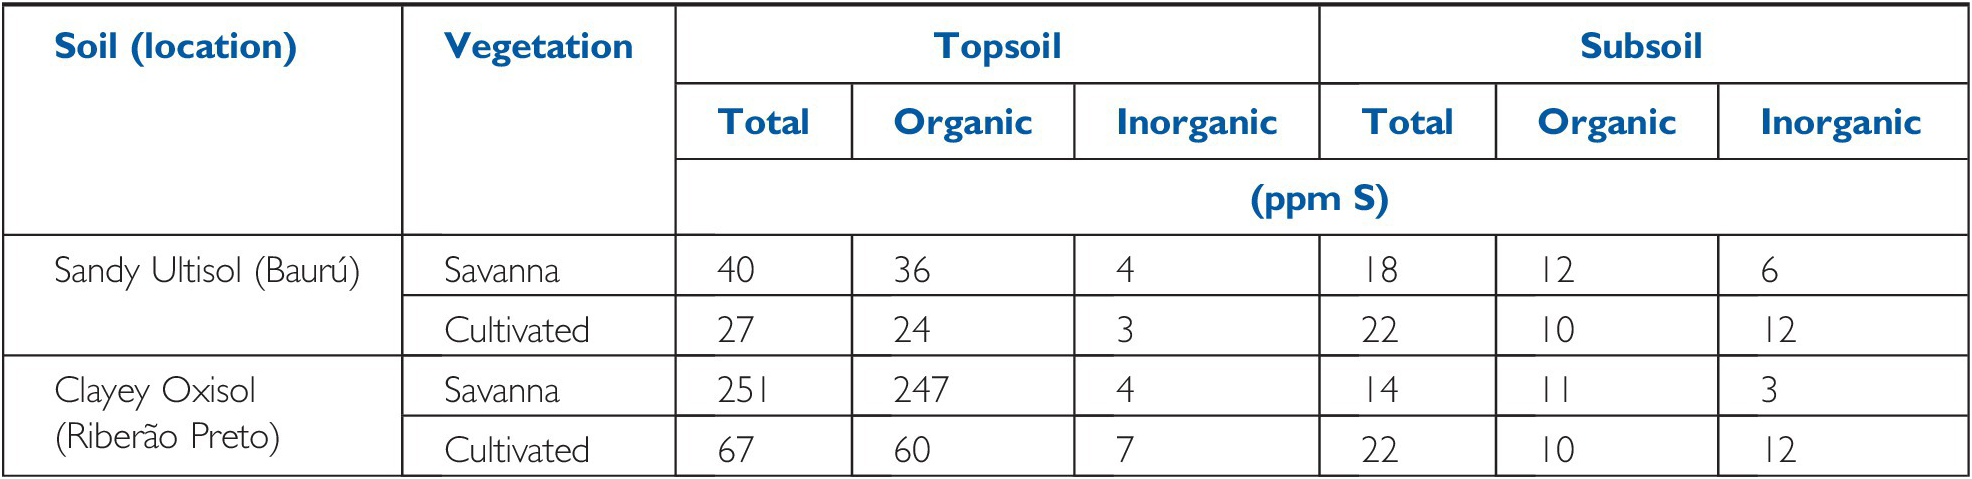
As in the case with nitrogen, cultivation reduces the topsoil organic sulfur content because of the increased SOM decomposition rates. McClung et al. (Reference McClung, de Freitas and Lott1959) observed that the main decrease with cultivation was in the topsoil organic sulfur fraction, coupled by an increase in inorganic sulfur in the subsoil, suggesting organic sulfur mineralization and some leaching of sulfates into the subsoil (Table 15.1).
Table 15.1 Total, organic and inorganic topsoil sulfur in two Cerrado soils of São Paulo, Brazil, under native savanna vegetation, and after 20–30 years of cultivation. Adapted from McClung et al. (Reference McClung, de Freitas and Lott1959).
| Soil (location) | Vegetation | Topsoil | Subsoil | ||||
|---|---|---|---|---|---|---|---|
| Total | Organic | Inorganic | Total | Organic | Inorganic | ||
| (ppm S) | |||||||
| Sandy Ultisol (Baurú) | Savanna | 40 | 36 | 4 | 18 | 12 | 6 |
| Cultivated | 27 | 24 | 3 | 22 | 10 | 12 | |
| Clayey Oxisol (Riberão Preto) | Savanna | 251 | 247 | 4 | 14 | 11 | 3 |
| Cultivated | 67 | 60 | 7 | 22 | 10 | 12 | |
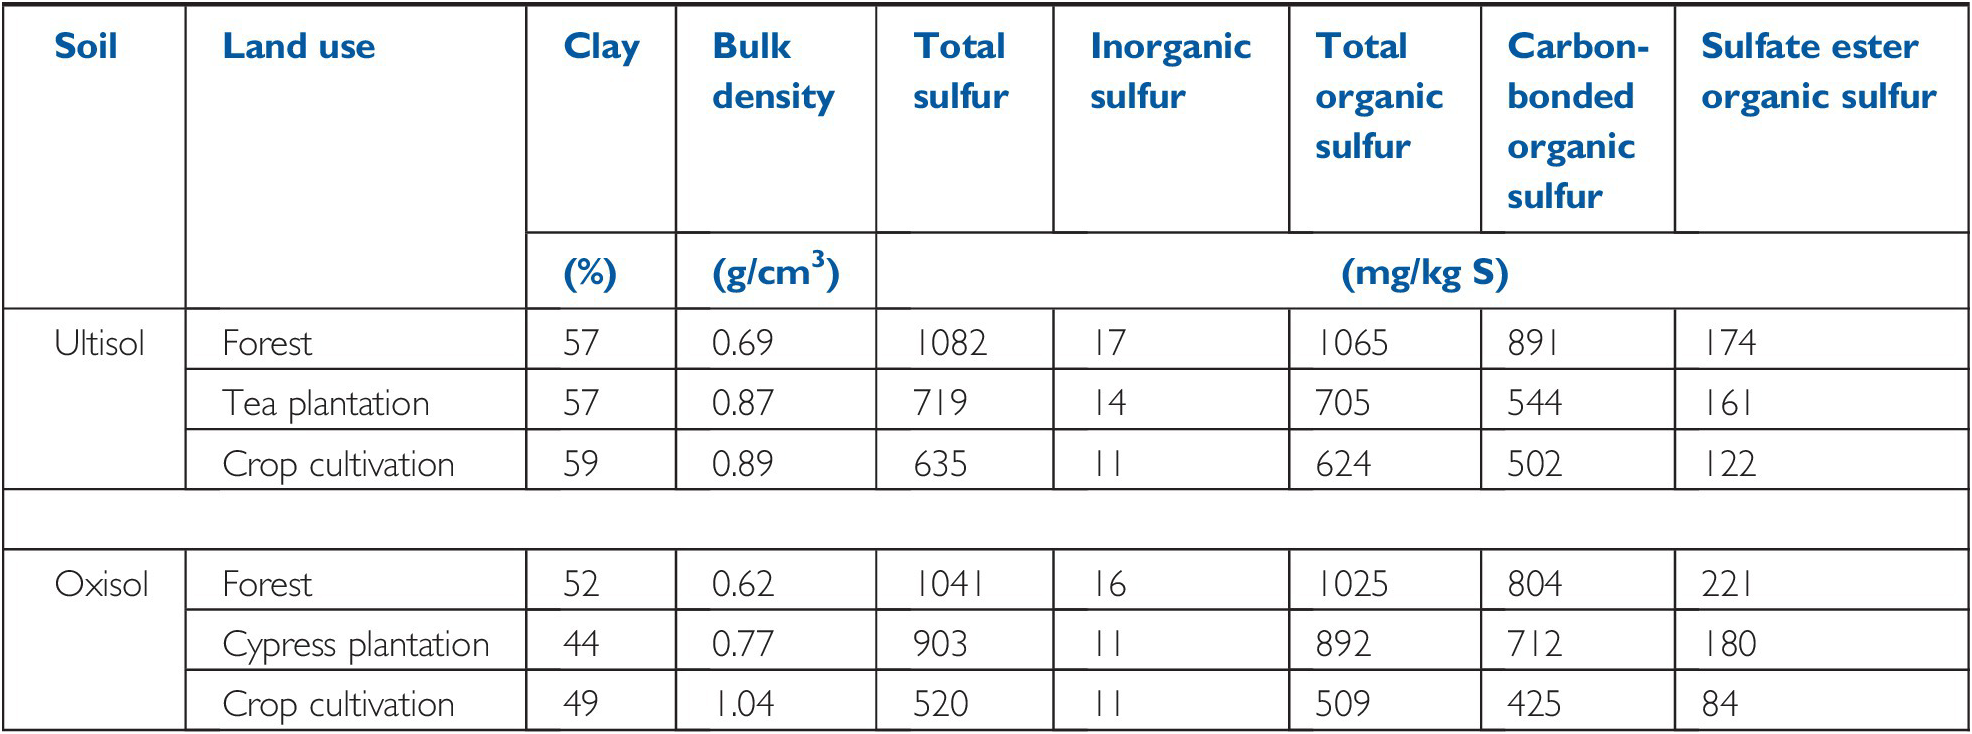
In volcanic soils of the Ethiopian highlands, Solomon et al. (Reference Solomon, Lehmann, Tekalign, Frizsche and Zech2001) compared topsoils under natural forest, a tree plantation and cultivated areas with maize and sorghum without fertilization (Table 15.2). The plantations and cultivated areas were cleared from tropical mountain forests, 25–35 years before. Like the previous example, topsoil organic sulfur decreased under the two types of cultivation, with little change in inorganic sulfur. Solomon and co-workers also found that the carbon-bonded organic fraction also exhibited a significant decrease, while the sulfate ester fraction changed the least.
Table 15.2 Changes in topsoil sulfur fractions upon 25–35 years of land-use change at two volcanic sites in the Ethiopian highlands. Adapted from Solomon et al. (Reference Solomon, Lehmann, Tekalign, Frizsche and Zech2001).
| Soil | Land use | Clay | Bulk density | Total sulfur | Inorganic sulfur | Total organic sulfur | Carbon-bonded organic sulfur | Sulfate ester organic sulfur |
|---|---|---|---|---|---|---|---|---|
| (%) | (g/cm3) | (mg/kg S) | ||||||
| Ultisol | Forest | 57 | 0.69 | 1082 | 17 | 1065 | 891 | 174 |
| Tea plantation | 57 | 0.87 | 719 | 14 | 705 | 544 | 161 | |
| Crop cultivation | 59 | 0.89 | 635 | 11 | 624 | 502 | 122 | |
| Oxisol | Forest | 52 | 0.62 | 1041 | 16 | 1025 | 804 | 221 |
| Cypress plantation | 44 | 0.77 | 903 | 11 | 892 | 712 | 180 | |
| Crop cultivation | 49 | 1.04 | 520 | 11 | 509 | 425 | 84 | |
15.1.8 Acid Sulfate Soils
An extreme situation occurs in the 12.5 million hectares of the tropical soils classified as Sulfaquepts and Sulfaquents, also known as cat clays or acid sulfate soils. They are defined by the sulfidic c attribute in the Soil Functional Classification (FCC) system. They occur in some coastal areas where sulfate from ocean waters reacts with large quantities of reduced iron, forming pyrite. They have pH values of about 7 then they remain anaerobic, but when drained, pyrite is oxidized to sulfate and even forms free sulfuric acid, with a pH of 1.5–3, which make them toxic to plants and harmful to life in drainage waters. There is more on how to manage these extreme soils in Chapter 17.
15.2 Sulfur Sorption
There are two mechanisms of sulfur retention in soils high in iron and aluminum oxides: anion exchange and sulfur sorption. The first process is similar to nitrate anions, and the second one, sorption, is similar to what happens to phosphate anions. Because SO42– is subject to leaching like NO3–, but unlike H2PO4–, many of these processes take place primarily in the subsoil. Figure 15.3 compares the organic and inorganic sulfur profiles in a Mollisol and an Oxisol (Brady and Weil Reference Brady and Weil2008). The Mollisols do not have anion exchange capacity or sulfur sorption in the subsoil, but often have gypsum in the parent material, as in this example. Even in topsoils such relationships hold between Brazilian soils (mainly Oxisols) and Iowa soils (mainly Mollisols) (Neptune et al. Reference Neptune, Tabatabai and Hanway1975).
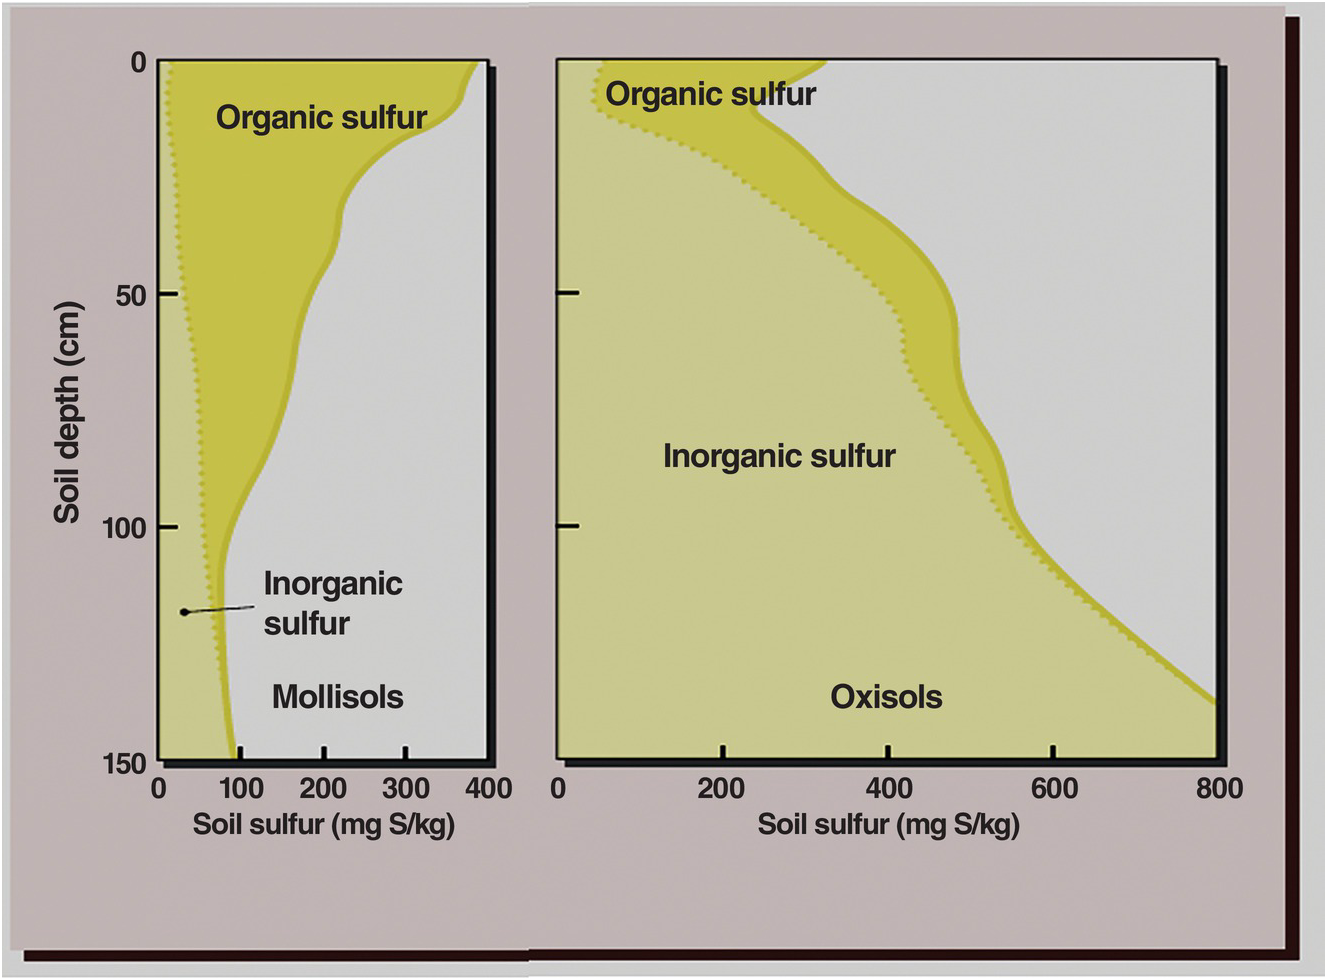
Fig. 15.3 While organic sulfur predominates in the topsoil of both Mollisols and Oxisols, inorganic sulfur (SO42–) predominates in the subsoils, but for different reasons.
15.2.1 Anion Exchange
Anions are held by positive charges and sorption sites at different bonding strengths. Among the macronutrients, H2PO4– is held the tightest, followed by SO42–, and last by NO3–.
Anion exchange occurs primarily when clay surfaces of iron and aluminum oxides (defined in Chapter 14 to include hydroxides and other species of iron and aluminum) have net positive charge because they are below the zero point of charge and have positive ΔpH values (Chapter 8). Most anion exchange capacity is located in the subsoil since topsoils usually have negative ΔpH even in oxidic mineralogies because SOM reacts with such minerals. H2PO4– anions seldom leach into the subsoil.
SO42– can displace NO3– from these positive exchange sites. Anion exchange levels are generally low, 1–2 cmolc/kg of soil, but such subsoil layers can be very deep, retaining large quantities of anions, as shown in Chapter 13 for NO3– and in Fig. 15.3 for SO42–.
15.2.2 Sorption
The second mechanism is sorption. Sulfate ions are adsorbed by ligand exchange between SO42– and OH–, in soils high in iron and aluminum oxides. This is shown in Eq. 15.4:

This reaction also occurs in exchange sites along the edges of kaolinite particles and positively charged organic radicals. In subsoils it may result in pH increases of 0.3 to 0.9 units.
Adsorbed sulfates are readily available to plant roots (Kovar and Grant Reference Kovar, Grant, Hatfield and Sauer2011), in sharp contrast with adsorbed phosphates, which are not available to plant roots. Sulfate anions are retained more tightly by sorption than by anion exchange.
In addition, sulfates can also be absorbed when the SO42– ions become part of an aluminum oxide matrix such as:
This happens in Andisols of Nicaragua (Delfosse et al. Reference Delfosse, Delmelle and Delvaux2006), perhaps in a similar way as Barrow’s (Reference Barrow1974) slow reaction of phosphate absorption.
The sorption and desorption properties of sulfur can be characterized by “sorption isotherms,” better termed sulfur retention curves, in a similar way to those used for phosphorus. Figure 15.4 shows examples of these relationships in some soils of the tropics. The smectitic, permanent-charge Mollisol from the Cauca Valley of Colombia does not exhibit any sulfur sorption, a finding typical also of other soils with similar mineralogy from Hawaii and Australia, and of course the temperate region (Fox et al. Reference Fox1971). Sandy and loamy Inceptisols and Entisols of the Indo-Gangetic Plain, which are derived from permanent-charge alluvium, also do not show sulfate sorption or anion exchange; most of them are deficient in sulfur (Khurana et al. Reference Khurana, Sadana, Singh and Jez2008).

Fig. 15.4 Sulfate sorption retention curve of a permanently charged, clayey Mollisol shows negligible sorption, in contrast with strong sorption by two clayey Oxisols. The strength of sorption depends on the Oxisols’ mineralogy, being higher in the oxidic Gibbsihumox than in the kaolinitic Haplustox.
It is important to remember at this juncture that although this book focuses on variable-charge soils of the tropics, 10 percent of tropical soils have permanent charge, like the Mollisols, Entisols and Inceptisols indicated, and an additional 30 percent have a mixture of variable and permanent charge (Chapter 8). So, permanent-charge soils are important in the tropics, also because many of them are inherently fertile and are cultivated by high human populations, like in the Indo-Gangetic Plain of South Asia.
Several Oxisols show strong sulfur sorption, the Hawaiian Gibbsihumox showing stronger sorption capacity than the less oxidic Colombian Haplustox (Fig. 15.4). Figure 15.5 shows how much lower the sulfur sorption of the topsoil is than in the subsoil because of the higher SOM content of the topsoil that can block sorption sites.

How does sulfur retention compare with phosphorus retention? Figure 15.6 shows both retention curves with the same soils (Fox et al. Reference Fox1971). The first observation is that the amounts of phosphorus sorbed are an order of magnitude higher than SO42–-S sorbed. The second is that the curves give an indication of the mineralogy (the Gibbsihumox is oxidic, the Haplustox is kaolinitic and the Aqualf is probably siliceous).

Fig. 15.6 Comparison of phosphate and sulfate retention curves in soils of different mineralogies.
Finally, the critical level of sulfur in soil solution obtained by Fox et al. (Reference Fox1971) for maximum yields of Pennisetum clandestinum (kikuyu grass) was 5 mg/L SO42–-S (1.6 mg/L S), an order of magnitude higher than the 0.2 mg/L P level commonly believed at that time to be the critical level, and two orders of magnitude higher than the 0.01 mg/L P proposed in the previous chapter. This shows that sorbed sulfur is held much less tightly than sorbed phosphorus by the same soils.
Sulfur retention is affected by the three core soil properties – texture, mineralogy and SOM, with mineralogy playing the predominant role. Since retention takes place in the clay fraction, the finer the texture the higher the potential to retain sulfur. Mineralogy is paramount, retaining sulfur in the following order: andic (allophanic) > oxidic > kaolinitic > smectitic, siliceous. SOM decreases sulfur retention because it can bond with clay surfaces that otherwise retain sulfates. In addition, phosphorus applications can kick sulfate ions out from the sites of retention and subject them to leaching. Ribeiro et al. (Reference Ribeiro, Dias, Alvarez, Mello and Daniels2001) showed how differing textures and SOM levels affect sulfur retention among 13 Oxisols with similar clay mineralogy.
The two sulfate retention mechanisms (anion exchange and sorption) put sulfate ions in an intermediate but good position for plant uptake – they are not too easily displaced from subsoil anion exchange sites, as nitrate ions are, and they are not so strongly retained, like phosphate, which makes the uptake of sulfate by plant roots easier.
15.3 Crop Requirements
Sulfur uptake levels by crops are similar to those of phosphorus (Table 15.3). Therefore, sulfur is a macronutrient and should be considered in the same group as nitrogen, phosphorus and potassium.
Table 15.3 Sulfur uptake of tropical crops as compared with phosphorus uptake. Adapted from Howeler (Reference Howeler, Hillocks, Thresh and Bellotti2002), Oliveira et al. (Reference Oliveira, Machado, Bernardi, Naumov, Yamada and Roberts2005), Vitti and Heirinchs (Reference Vitti, Heirinchs, Yamada, Stipp and Vitti2007), Fancelli and Tsumanuma (Reference Fancelli, Tsumanuma, Yamada, Stipp and Vitti2007), Khurana et al. (Reference Khurana, Sadana, Singh and Jez2008), Dick et al. (Reference Dick, Kost, Chen and Jez2008).
Sulfur concentrations in plant tissue are also similar to phosphorus concentrations, ranging from 0.1 percent to 0.3 percent S, as is the range of nutrient uptake by crops (7–45 kg S/ha and 6–29 kg P/ha). A good indication of sulfur deficiency is a decline in the N:S ratio of tissues below 17:1 because the ratio of protein nitrogen to protein sulfur is 15:1.
The sulfur requirements of crops varies among crops, their cultivars, plant parts and the stage of growth, often decreasing as the crop matures. Cereals and root crops have the lowest sulfur contents, while oilseeds, legumes and the Brassica genus have the highest. Table 15.3 shows there is considerable variability in this generalization.
15.4 Nutrition
Crop yields and nutritional quality are affected by sulfur, with important effects on animal and human nutrition. I use data from Kanwar and Mudahar (Reference Kanwar and Mudahar1986), Malavolta and Moraes (Reference Malavolta, Moraes, Yamada, Stipp and Vitti2007), Brady and Weil (Reference Brady and Weil2008) and Kovar and Grant (Reference Kovar, Grant, Hatfield and Sauer2011) to summarize the nutritional effects as follows:
Deficiencies in the sulfur-containing amino acids methionine, cysteine and cystine, caused by inadequate sulfur uptake, can result in serious malnutrition in monogastric animals such as humans and pigs.
Sulfur increases the methionine content in cereal proteins, increasing their nutritional value.
Sulfur also increases the protein content of grain legumes, important in the diets of humans.
Baking quality and loaf volume decreases with sulfur deficiency in wheat when used in bread-making. The critical level is an N:S ratio of 16:1.
Sulfur fertilization often increases yields and protein content of grass and legume pastures, as well as vitamin A content in alfalfa and the chlorophyll content of red clover, thereby improving feed quality and ruminant performance. Sulfur contents of feed should range from 0.18 percent S to 0.25 percent S in ruminant diets.
The joint additions of nitrogen and sulfur help reduce high nitrate levels in animal feed.
Several sulfur compounds are responsible for the flavors of garlic, onion, asparagus, lettuce and cabbage.
Vegetables that are low in sulfur are hard, with low commercial value.
Good sulfur nutrition of plants enhances several secondary metabolites, which improves defense mechanisms against pests and diseases.
15.4.1 Sulfur Fertilization
Sulfur fertilization in sulfur-deficient Entisols and Inceptisols of the Indo-Gangetic Plain increases protein and oil content in various oilseed crops (Khurana et al. Reference Khurana, Sadana, Singh and Jez2008), with concomitant general increases in the amino acids methionine and cysteine, as shown in Table 15.4. Considering that hundreds of millions of people inhabit this region, sulfur fertilization has a major positive effect on these people’s well-being.
Table 15.4 Sulfur fertilization increases protein, methionine and cysteine levels in mungbean grain (Phaseolus aureus) that is grown in a sulfur-deficient alluvial soil of the Indo-Gangetic Plain. Adapted from Kamat et al. (Reference Kamat, Kankute, Puranik, Kohadkar and Joshi1981).
| Applied sulfur | Protein | Methionine | Cysteine |
|---|---|---|---|
| kg S/ha | (%) | (% total protein) | |
| 0 | 24.4 | 2.42 | 2.63 |
| 10 | 24.5 | 2.45 | 2.25 |
| 20 | 24.8 | 3.02 | 4.58 |
| 30 | 26.3 | 3.13 | 3.80 |
15.5 Soil Testing
Water, 1 M potassium chloride (KCl), 0.01 M calcium chloride (CaCl2), 0.01 M calcium phosphate [Ca(H2PO4)2], 0.5 M sodium bicarbonate (NaHCO3), ammonium acetate in acetic acid, and the Mehlich 3 double acid are the main extractants used to estimate available sulfur in soils (Fox et al. Reference Fox1971, Ribeiro et al. Reference Ribeiro, Dias, Alvarez, Mello and Daniels2001, Dick et al. Reference Dick, Kost, Chen and Jez2008). The first three provide variable results because they extract mostly sulfate in the soil solution. Calcium phosphate also extracts some sorbed sulfur and has provided the best correlations with plant growth (Probert Reference Probert1976). Using the isotope 35S in five topsoils of North Queensland grown with Stylosanthes guianensis in pots, Probert also found a near full recovery of the sulfur extracted by calcium phosphate in the plants’ tissue in four of the five soils. The exception was a sodic, permanent-charge soil, probably a Natraqualf, with little sulfur sorption capacity. Research by Ribeiro et al. (Reference Ribeiro, Dias, Alvarez, Mello and Daniels2001) in Brazil and Weil and Mughogho (Reference Weil and Mughogho2000) in Malawi indicated a less clear advantage of the calcium phosphate extractant.
Nevertheless, the calcium phosphate extraction is the most common soil test for sulfur. In general, the critical levels are 5–10 mg/kg S (Dick et al. Reference Dick, Kost, Chen and Jez2008), while in Brazil it is mainly 10 mg/kg S (Malavolta and Moraes Reference Malavolta, Moraes, Yamada, Stipp and Vitti2007), and in Hawaii, 8–10 mg/kg S (Hasan et al. Reference Hasan, Fox and Boyd1970), all with the calcium phosphate extraction.
A soil test performed in the topsoil, however, tells only part of the picture. In sandy Ultisols, where the topsoil is deficient in sulfur, crops show symptoms of sulfur deficiency until the roots penetrate clayey, oxidic or kaolinitic subsoils that are loaded with sulfate, retained by anion exchange or sorption. Sulfur deficiency gradually disappears as the roots come in contact with the SO42–-rich subsoil. This was first observed in North Carolina Ultisols by Kamprath et al. (Reference Kamprath, Nelson and Fitts1957), although it happens all over the tropics. Therefore, subsoil sampling may be a good management practice in Ultisols and Alfisols of contrasting textural profiles, or in Oxisols and Andisols in general. Since sulfur retention is not as tight as phosphorus retention, plants can tap much of the retained sulfates.
15.6 Sulfur Fertilization
15.6.1 Sources
Most of these sulfur requirements are small enough that many nitrogen and phosphorus carriers can supply them. An application of 50 kg N/ha as ammonium sulfate provides 12 kg S/ha, while an application of 50 kg P/ha as single superphosphate provides 6 kg S/ha. When urea and diammonium phosphate are used, there is no sulfur added. Although triple superphosphate should contain zero sulfur, an actual analysis that was conducted by Weil and Mughogho (Reference Weil and Mughogho2000) using commercial triple superphosphate fertilizers showed that it contained 2–3 percent.
The ability to return crop residues or to incorporate manure may add enough sulfur to a crop without mineral fertilization. An application of 5 t/ha of high-quality cattle manure containing 0.3 percent S would provide 15 kg S/ha, but the same application using low-quality manure would provide only about 5 kg S/ha.
Elemental sulfur and gypsum are also used to reduce the pH and ameliorate sodic soils, those with the n FCC attribute. Gypsum is used extensively in Oxisols to bring calcium (Ca2+) ions into the subsoil (Chapter 9) and supply calcium to peanuts and other high-calcium-requiring crops. Ammonium thiosulfate is used in fertigation and in blends with other fertilizers (Dick et al. Reference Dick, Kost, Chen and Jez2008).
The main fertilizer sources of sulfur are shown in Table 15.5.
Table 15.5 Main sulfur fertilizers (Vitti and Heirinchs Reference Vitti, Heirinchs, Yamada, Stipp and Vitti2007, Dick et al. Reference Dick, Kost, Chen and Jez2008, Chapter 13, Kirchmann and Pettersson Reference Kirchmann and Pettersson1995 for urine).
15.6.2 Rates
In general, rates on the order of 5–50 kg S/ha are sufficient to overcome sulfur deficiencies. The average sulfur application rate for crops in Brazil is 20 kg S/ha (Malavolta and Moraes Reference Malavolta, Moraes, Yamada, Stipp and Vitti2007). Jones and Quagliato (Reference Jones and Quagliato1970) showed that 10–20 kg S/ha is sufficient for most tropical pasture legumes and alfalfa. For coffee, an annual rate of 30 kg S/ha increased yields by 82 percent over a 10-year period in Brazil (de Freitas et al. Reference de Freitas, Tanaka, Lobato and Soares1972).
In Brazil, a country with a majority of variable-charge soils, deficient in sulfur, the generally recommended rates are as follows, all in bands or close to trees at planting time (Vitti and Heirinchs Reference Vitti, Heirinchs, Yamada, Stipp and Vitti2007):
annual crops: 30 kg S/ha
perennial crops: 30–40 kg S/ha
sugar cane: 50 kg S/ha per cut
vegetable crops: 40–50 kg S/ha
reforestation: 30 kg S/ha.
In Africa, with lower crop yields than Brazil, the recommended rates are lower. Weil and Mughogho (Reference Weil and Mughogho2000) conducted replicated trials in 20 farmer fields for two years in four major agroecolgical zones of Malawi. Nineteen of the 20 trials showed yield responses to sulfur. They also found that a critical N:S ratio of 11.5:1 in maize ear leaves was the best predictor of sulfur deficiency. Rates of 5–6 kg S/ha were found to be best, with few differences among agroecological zones, two of them dominated by variable-charge red Alfisols, Oxisols and Ultisols, while the other two, closer to Lake Malawi, had permanent-charge soils (Fig. 15.7). They also noted that nitrogen had to be applied before sulfur responses were observed, a classic “law of the minimum” situation where nitrogen deficiency has to be overcome before addition of sulfur. Results from many previous field experiments in Malawi convinced the Ministry of Agriculture to add four units of sulfur in their special blend, imported by the Malawian government (23 N–21 P–0 K–4 S). This undoubtedly has reduced sulfur deficiency in this country.
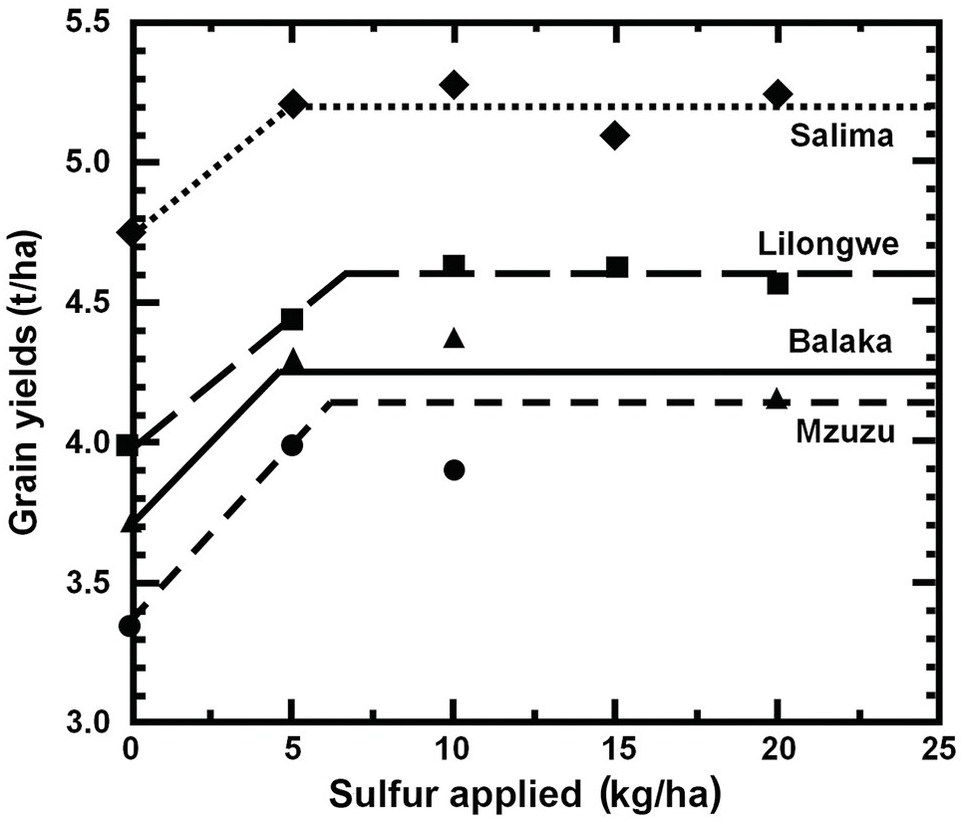
Fig. 15.7 Maize responds to 5–7 kg S/ha in four agroecolgical zones of Malawi. Salima and Balaka regions have mainly permanent-charge soils and are close to Lake Malawi. Lilongwe and Mzuzu are upland areas with mainly variable-charge Alfisols (Weil and Mughogho Reference Weil and Mughogho2000).
15.6.3 Timing and Placement
All sulfur fertilization should be incorporated at planting time for food crops because it helps in root development and the early synthesis of amino acids, as well as in stimulating biological nitrogen fixation in legumes (Fancelli and Tsumanuma Reference Fancelli, Tsumanuma, Yamada, Stipp and Vitti2007). When elemental sulfur is used it should be applied 2–4 weeks before planting so it oxidizes into SO42– by the time seeds are planted. Gypsum is also applied at the pegging time for peanuts because of the high demand for calcium at this time. In cases where sulfur deficiency is diagnosed during plant growth it is possible to correct it by fertilizing while the plant is growing (Kovar and Grant Reference Kovar, Grant, Hatfield and Sauer2011).
15.6.4 Agronomic Efficiency and Fertilizer Recovery
The agronomic efficiency of sulfur fertilization (AES) was in the range 3–13 kg grain/kg S applied to oilseed crops, and 17–19 kg grain/kg S applied to rice and wheat in India (Khurana et al. Reference Khurana, Sadana, Singh and Jez2008). These values are lower than the agronomic efficiency of nitrogen (AEN) reported in Chapter 13.
The fertilizer recovery of sulfur (RES) by the first crop is rather low, ranging from 7 percent to 23 percent in India, but higher recoveries (37–73 percent) have been recorded with cotton in temperate North Carolina, according to a compilation by Kanwar and Mudahar (Reference Kanwar and Mudahar1986). This may be due to soil differences. Most of the Indian data comes from Entisols and Inceptisols of the Indo-Gangetic Plain, which do not have a subsoil with sulfur retention capacity and thus much of the sulfur applied may be lost by leaching. North Carolina Ultisols usually have an argillic B horizon, rich in iron and aluminum oxides, which, as mentioned before, when the crop roots reach it, can take up much of the sorbed sulfur (Kamprath et al. Reference Kamprath, Nelson and Fitts1957).
Residual effects of sulfur fertilization are likely to be better than those of nitrogen (most of it in the first crop and a small amount in the second crop – Chapter 13). Khurana et al. (Reference Khurana, Sadana, Singh and Jez2008) reported that in the rice–wheat rotations in the Indo-Gangetic Plain the first crop recovered 33–82 percent of the applied sulfur while the subsequent crop recovered the remaining 18–67 percent. In one case, the residual effect of sulfur was felt up to the fourth crop of an annual rice–wheat rotation. In general, this is much better than nitrogen even though these soils usually do not have subsoil sulfur retention.
The only long-term trial I was able to find in the literature is the work of Donald and Williams (Reference Donald and Williams1955) and Williams and Donald (Reference Williams1957) in which they sampled grazed paddocks with introduced subterranean clover with periodic single superphosphate applications, for up to 26 years of sheep grazing, located in a “podzolic soil” (probably an Ultisol) in the Crockwell District of New South Wales, Australia. Amazingly, they found that all the sulfur applied as single superphosphate (156 kg S/ha over 26 years) was accounted for in the top 10 cm of soils, presumably in an organic fraction. Being an efficient grazing system, the sheep excreta generally recycles about 70–80 percent of the nutrients they ingest (more on that in Chapter 18). The soils must have an argillic, sulfur-retaining B horizon, where the pasture species certainly tapped inorganic sulfur. This is probably the best example I have read of the synchrony principle. Obviously, more research is needed on the long-term effects of sulfur applications.
15.7 Summary and Conclusions
Sulfur should be considered a macronutrient, along with nitrogen, phosphorus and potassium. The reason for this proposal is that the sulfur content of plants is similar to that of phosphorus (0.1–0.3 percent in both cases), as is the range of nutrient uptake by crops (7–45 kg S/ha and 6–29 kg P/ha). Most importantly, the current response to sulfur fertilization is as frequent or probably more so than that of phosphorus. The NPK paradigm should be updated to NPKS in practical agronomy.
Most sulfur requirements are small enough that many nitrogen and phosphorus carriers can supply them. An application of 50 kg N/ha as ammonium sulfate provides 12 kg S/ha, while an application of 50 kg P/ha as single superphosphate provides 6 kg S/ha.
Sulfur deficiencies are increasing throughout the tropics as well as worldwide. The main reasons are the increasing use of high-analysis fertilizers that contain no sulfur, the increasing use of higher-yielding crop cultivars that require more sulfur, and the decreased atmospheric deposition downwind from industrial urban centers that have air-pollution control.
Sulfur deficiency in crops occurs in a wide variety of soils. They are often sandy, well-drained, subject to leaching, with variable- or permanent-charge mineralogy and low in soil organic matter (SOM). They generally occur in unpolluted, inland areas where the atmosphere is low in sulfur. Unlike nitrogen deficiency, which starts as chlorosis (yellowing) of the older leaves, sulfur deficiency starts as chlorosis of the younger leaves.
The sulfur cycle resembles the nitrogen cycle in that the atmosphere plays an important role, that most of the topsoil’s sulfur is in the organic form, that sulfur undergoes similar mineralization–immobilization processes and as sulfate anions can be retained in subsoils by anion exchange and also leached, similarly to nitrates. The sulfur cycle resembles the phosphorus cycle in that the original sources of sulfur are primary minerals and that sulfur retention is important in soils that are high in iron and aluminum oxides. It differs from both cycles in that microbial oxidation–reduction (redox) reactions play a central role.
The main sulfur inputs to soils are primary minerals (gypsum and pyrite), organic inputs and atmospheric deposition of sulfur gases. Organic inputs of plant origin, including manures, generally contain about 0.3 percent S in dry mass, except for low-quality cattle manures in Africa, which contain about 0.1 percent S.
The atmosphere contains various forms of sulfur gases. These gases are eventually oxidized to sulfuric acid, which along with nitric acid causes acid rain. Atmospheric deposition rates were as high as 200 kg S/ha per year downwind from industrial areas with no pollution controls. Atmospheric deposition rates are 8–15 kg S/ha per year around industrial areas with effective clean-air controls in rich countries, but not around rapidly developing industrial areas in the tropics. Atmospheric deposition in Africa is about 1–4 kg S/ha per year.
Total topsoil sulfur in the tropics varies from very high in Andisols (1280 mg/kg S) to very low (40 mg/kg S) in sandy Ultisols. Unlike phosphorus, the subsoil often contains significant quantities of sulfur, which are very relevant to soil fertility management in the tropics.
Most (> 95 percent) of the sulfur in topsoils outside of arid climates is in the organic form. In subsoils with variable-charge clays, the relationship often flips over, with the vast majority being inorganic sulfur because of sulfate retention processes.
Soil organic sulfur stocks can be grouped into three fractions depending on their redox status and turnover rates: ester sulfates, carbon-bonded sulfur and inert organic sulfur. Ester sulfates are easily hydrolyzed into sulfates. Carbon-bonded sulfur comprises complex reduced forms that include the amino acids methionine, cysteine and cystine. Inert organic sulfur can range from 3 percent to 59 percent of the organic sulfur and has a very slow turnover.
Mineralization of organic sulfur occurs at C:S ratios lower than 200, while organic compounds with a C:S ratio > 400 produce net immobilization. Organic compounds with a sulfur concentration less than 0.15 percent S are immobilized into microbial biomass but eventually mineralized. The processes could go either way in ratios between C:S values of 200 and 400.
Flushes of sulfur mineralization upon wetting of previously dried soils have also been observed in the tropics. The processes involved are similar to those governing nitrogen flushes – the Birch effect.
There are two mechanisms of sulfur retention in subsoils that are high in iron and aluminum oxides: anion exchange and sulfur sorption. The first process is similar to that for nitrates (NO3–) – anion exchange; and the second one, sorption, is similar to what happens to phosphate (H2PO4–) anions. Because sulfate ions (SO42–) are subject to leaching, like NO3– but unlike H2PO4– , many of these processes take place primarily in the subsoil.
Anions are held by positive charges and sorption sites at different bonding strengths. Among the macronutrients, H2PO4– is held the tightest, followed by SO42–, and last by NO3–. Adsorbed sulfates are readily available to plant roots in sharp contrast with adsorbed phosphates, which are not readily available. Sulfate anions are retained more tightly by sorption than by anion exchange.
Sulfur retention curves resemble phosphorus retention curves, but the amounts of sulfate sorbed are an order of magnitude lower than sorbed phosphate, while the critical level in the soil solution that approaches maximum yield (1.6 mg/L S) is two orders of magnitude higher than that of phosphorus (0.01 mg/L P). This shows that sorbed sulfur is held much less tightly than sorbed phosphorus by the same soils.
Sulfur retention is affected by the three core soil properties – texture, mineralogy and SOM, with mineralogy playing the dominant role. Since retention takes place in the clay fraction, the finer the texture the higher the potential to retain sulfur. Mineralogy is paramount, retaining sulfur in the following order: andic (allophanic) > oxidic > kaolinitic > smectitic, siliceous. SOM decreases sulfur retention because it can bind with clay surfaces that otherwise retain sulfates. This is why sulfur retention is lower in topsoils than subsoils. In addition, phosphorus applications can kick sulfate ions out from the sites of retention and subject them to leaching.
The two sulfate retention mechanisms (anion exchange and sorption) put sulfate ions in an intermediate but good position for plant uptake – they are not too easily displaced from subsoil anion exchange sites, as nitrate ions are, and thus leached, and they are not so strongly sorbed like phosphate, which makes the uptake of sulfate by plant roots easier.
The sulfur requirement of crops varies among crops, their cultivars, plant parts and the stage of growth, but it depends on the seed protein content. Cereals and root crops have the lowest sulfur contents, while oilseeds, legumes and the Brassica genus (canola, cabbage) have the highest.
Crop yields and nutritional quality are affected by sulfur, with important effects on animal and human nutrition. Deficiencies in the sulfur-containing amino acids methionine, cysteine and cystine, caused by inadequate sulfur uptake, can result in serious malnutrition in monogastric animals. Sulfur increases the methionine content of cereal proteins, thereby increasing their nutritional value. Sulfur also increases the protein content of grain legumes.
Baking quality and loaf volume decreases with sulfur deficiency in wheat when used in bread making. The critical level is an N:S ratio lower than 16:1.
Sulfur fertilization often increases yields and protein content of grass and legume pastures, improving feed quality and ruminant performance. Sulfur content of feed should range from 0.18 percent to 0.25 percent S in ruminant diets. The joint additions of nitrogen and sulfur help reduce high nitrate levels in animal feed.
Several sulfur compounds are responsible for the flavors of garlic, onion, asparagus, lettuce and cabbage. Vegetables that are low in sulfur are hard, with low commercial value.
Good sulfur nutrition of plants enhances several secondary metabolites, which improves defense mechanisms against pests and diseases.
Sulfur fertilization in sulfur-deficient Entisols and Inceptisols of the Indo-Gangetic Plain increases protein and oil content in various oilseed crops, with concomitant increases in the amino acids methionine and cysteine. Considering that hundreds of millions of people inhabit this region, sulfur fertilization has a major positive effect on these people’s well-being.
Calcium phosphate extraction is the most commonly used soil test for sulfur. In general, the critical levels are 5–10 mg/kg S. Other methods can be used.
A soil test performed in the topsoil, however, tells only part of the picture. In sandy Ultisols, where the topsoil is deficient in sulfur, crops show symptoms of sulfur deficiency until the roots penetrate the clayey, oxidic or kaolinitic subsoil, loaded with sulfate that is retained by anion exchange or sorption. Sulfur deficiency gradually disappears as the roots come into contact with the sulfate-rich subsoil.
The ability to return crop residues or to incorporate manure may add enough sulfur to a crop, without mineral fertilization. An application of 5 t/ha of high-quality cattle manure containing 0.3 percent S would provide 15 kg S/ha, but the same application using low-quality manure would provide only about 5 kg S/ha.
In general, rates on the order of 5–50 kg S/ha are sufficient to overcome sulfur deficiencies. The average sulfur application rate for crops in Brazil is 20 kg S/ha. In Africa, where there are lower crop yields, the recommended rates are lower, 5–6 kg S/ha. In Malawi, nitrogen had to be applied before sulfur responses were observed, a classic “law of the minimum” situation.
Results from many previous field experiments in Malawi convinced the Ministry of Agriculture to add four units of sulfur in their special blend, imported by the Malawian government. This undoubtedly has reduced sulfur deficiency in this country.
All sulfur fertilization (organic or mineral) should be incorporated at planting time for food crops because it helps in root development and the early synthesis of amino acids, as well as in stimulating biological nitrogen fixation in legumes.
When elemental sulfur is used, it should be applied 2–4 weeks before planting so it oxidizes into SO42– by the time seeds are planted.
Gypsum is also applied at the pegging time of peanuts because of the high demand for calcium at this time. In cases where sulfur deficiency is diagnosed during plant growth it is possible to correct it by fertilizing while the plant is growing.
The agronomic efficiency of sulfur fertilization (AES) was in the range of 3–13 kg grain/kg S applied in oilseed crops, and 17–19 kg grain/kg S applied in rice and wheat in India. These values are lower than the agronomic efficiency of nitrogen (AEN) reported in Chapter 13.
The residual effect of sulfur fertilization seems to be better than that of nitrogen. Sulfur recovery by the first crop is higher when a sulfur-retaining subsoil is present.
The long-term effect of periodic single superphosphate applications for up to 26 years of sheep grazing an Ultisol in Australia resulted in all the applied single superphosphate (156 kg S/ha over 26 years) being accounted for in the top 10 cm of the soil, presumably as organic sulfur. This is probably due to the high recycling rate of sulfur as it goes through the sheep. This the best example I have read of the synchrony principle.