


The problem of malnutrition (under- and overnutrition) is a global problem that is increasingly affecting low- and middle-income countries with enormous repercussions on the well-being of the populations and their development(1). The coexistence of both forms of malnutrition usually affects the most vulnerable individuals (children under 5 years, women of reproductive age and indigenous peoples) and has a negative effect on the economic and social capital of a country(2,Reference Van de Poel, Hosseinpoor and Speybroeck3) . In Bolivia, the nutritional situation is not different from the overall tendency and transitions occurring worldwide. Bolivia is a landlocked country located in western-central South America, its population is around 11 million and is one of the poorest countries in Latin America with more than half of the total population living under the national poverty line(Reference Gigler4,5) . It is geographically diverse and is home to important different ethnic groups, approximately 62·2 % of the population self-identifies as indigenous(Reference Cruz-Saco6). This majority of the population remains highly marginalised in economic terms and continues to live in extreme poverty(Reference Björn-Sören7), making it especially vulnerable to malnutrition. Nevertheless, during the past decades, Bolivia’s undernutrition rates declined in vulnerable groups. The prevalence of stunting (height/age) in children below 5 years of age improved from 38 % in 1989 to 16 % in 2016, whereas the prevalence of wasting (weight/height) today in this age group is 1·9 percent. Among women (15–49 years), the prevalence of short stature (<145 cm) decreased from 13 % in 1994 to 7·0 % in 2016(8–10). Nonetheless, despite some progress in addressing nutrition problems, important differences in the levels of malnutrition persist in Bolivia according to socioeconomic level. The probability that a child under the age of three suffers from chronic malnutrition that is 1·8 times higher in rural areas (25·9 percent) than in urban areas (14·6 percent) and amongst the poorest populations nearly 46 percent of children are malnourished compared with 6·5 per cent of children among the richest populations(11). In the same way, dietary patterns and lifestyles are changing fast in Bolivia, leading to a rapid increase in the prevalence of overweight and obesity, particularly in the past 2 decades(Reference Aguilar Liendo, Zamora and Barrientos12,Reference Masuet-Aumatell, Maria Ramon-Torrell and Banqué-Navarro13) . Approximately, 57·7 % of women of 15–49 years are overweight or obese(10). Considering this growing phenomenon, Bolivia needs reliable information and together with this, a greater understanding of social inequalities in all forms of malnutrition is necessary. The most representative survey of health and nutrition of maternal and child population in Bolivia is the Demographic and Health Survey (DHS), these surveys have been taken place every 4–5 years, and they constitute the most representative surveys at a national level. Recently, the National Demographic and Health Survey 2016 was carried out by the Ministry of Health of Bolivia and the National Institute of Statistics (INE), however, this last document put more emphasis on specific indicators.
This article provides estimates of the malnutrition problem (undernutrition and excess BMI) by socio economic, wealth and educational level among children <5 years and women of reproductive age from Bolivia.
Methods
This study is part of a supplement assessing malnutrition inequalities in Latin America. Thus, to ensure comparability between countries, we analysed the same age groups and applied the same methodology as other Latin American countries carrying out similar analyses.
The data presented here come from the 2008 Bolivian Demographic and Health Survey (DHS). This survey is cross-sectional, applied a probabilistic, multistage, stratified cluster-sampling procedure to select a nationally representative sample that included 19·564 households, which are represented by vulnerable individuals in their composition (women of childbearing age and their corresponding children under 5 years). It was carried out between January 2008 and October 2009.
The sample for this analysis comprised 5·903 children <5 years, 3·345 women adolescents (15–19 years) and 12·297 adult women (20–49 years) with available information on anthropometric measurements. The subsample of individuals for whom haemoglobin concentrations was analysed included 2·551 children 6–59 months old, 1·108 adolescent women (15–19 years) and 4·161 adult women (15–49 years).
Malnutrition indicators
By using the 2008 DHS, we estimated national malnutrition prevalence and its distribution by wealth, education level and ethnicity.
The survey provided data on haemoglobin concentration; weight and height measured using standard techniques by trained researchers. Weight was measured to the nearest 0·1 kg using a digital weighing scale (SECA model 770, Brooklyn, NY), and participants were instructed to wear light clothing and remove shoes. Height was measured to the nearest 1·0 cm with a portable stadiometer (Shorr Productions, Onley, MD), and length was measured in children 2 years or younger in a prone position, following established protocols.
As indicators of malnutrition, we considered overweight, obesity and overweight/obesity (excess BMI); wasting/underweight, stunting/short stature and anaemia (undernutrition). We estimated BMI as weight (kg) divided by height (m) squared (kg/m2). Definitions were based on the WHO(Reference de Onis, Adelheid and Borghi14–Reference de Onis, Onyang and Borghi15). Overweight was defined as BMI-for-age z-score >2 and ≤3 for children <5 years; BMI-for-age z-score >1 and ≤2 for women 11—19 years and BMI ≥25 and <30 for women 20—49 years. Obesity was defined as BMI-for-age z-score >3 for children <5 years; BMI-for-age z-score >2 for women 11—19 years and BMI ≥30 for women 20—49 years. Wasting was defined as weight-for-height z score <–2 for children <5 years, underweight as a BMI-for-age z-score <–2 for women 11—19 years and BMI <18·5 for women 20—49 years. Stunting was defined as height-for-age <–2 for children <5 years, height-for-age z score <–2 for women 15—19 years and short stature as height <1·49 m. for women 20—49 years. We excluded values with height-for-age z score <–6 or >6, weight-for-height z score <–5 or >5, BMI-for-age z-score <–5 or >5 and among women 20—49 years if BMI was <10 or >58 kg/m2.
Haemoglobin concentration was measured in capillary blood with a portable photometer (HemoCue, Angelholm, Sweden). Anaemia in children and in women of childbearing age was defined as haemoglobin below 11 mg/dl and 12 mg/dl, adjusted by altitude according to the formula of Dirren et al.(Reference Dirren, Logman and Barclay16).
Socioeconomic characteristics
We used wealth index, education level and ethnicity as socioeconomic indicators. We categorised the wealth index constructed by DHS survey into tertiles. This index is calculated using easy-to-collect data on a household’s ownership of selected assets, such as televisions and bicycles; materials used for housing construction and types of water access and sanitation facilities.
We categorised education level, according to the number of education years attained, into low level (0–6 years), medium level (7–12 years) and high level (>12 years). We defined indigenous/non-indigenous at the household level as self-reported.
Data analyses
We analysed the data using the Statistical Package for the Social Sciences (SPSS) version 23. As nutritional indicators and wealth variables were approximately normally distributed, parametric analyses were chosen. We calculated means or proportions and 95 % CIs for nutritional measures in children <5 years, adolescent women (15–49 years) and adult women (20–49 years) stratified by tertiles of wealth, education level and race/ethnicity.
Differences in prevalence of malnutrition between the comparison groups were evaluated statistically by using Chi square test. P-value < 0·05 was considered significant.
Results
The characteristics of the overall sample are shown in Table 1 (age, sex and education level) as well as the ethnicity, household characteristics and goods by tertiles of wealth index. In general, we can see that 36·45 % and 21·07 % women of 20–49 years have medium and high education level, respectively. Households with a low wealth index compared with high tertile of wealth had a higher proportion of women with low education level 74·66 % v. 12·42 %. At household level (n 16·939), the prevalence of indigenous households was 59·57 %. Note that households of low wealth tertile have a higher proportion of indigenous population (77·18 %) relative to households from high wealth tertile (42·15 %). Low wealth index households were characterised for having a high proportion of houses with bare-earth floor (63·34 %), use firewood or carbon for cooking (73·34 %) and live in houses without a public water network, electricity, motor vehicle, telephone and refrigerator (Table 1).
Table 1 Sample characteristics by socioeconomic wealth in Bolivia (ENDSA 2008)

Prevalence of malnutrition by wealth status among age groups is shown in Table 2. In children <5 years, the highest prevalence of undernutrition is for anaemia (63·11 %) followed by stunting (23·22 %) and wasting (1·68 %). There were no significant differences in excess BMI among tertiles of wealth and mother’s education level. However, there were large inequities in the distribution of stunting and anaemia within this group of age, with significantly higher prevalence among those with low wealth compared with those with high wealth (35·52 % v. 7·91 % for stunting; 69·30 v. 46·46 % for anaemia), in indigenous children v. no indigenous (28·51 v. 14·24 % for stunting; 67·24 v. 55·87 % for anaemia) and children with mothers with low education level (34·02 v. 9·53 % for stunting; 65·15 v. 47·27 % for anaemia) (Table 2 and Fig. 1).
Table 2 Malnutrition’s prevalence by wealth status, education level and ethnicity by demographic group in Bolivia (Demographic & Health Survey, 2008)

‡ Weighted %.
§ Overweight: BMI-for-age z score >2 and ≤3 for children <5 years; BMI-for-age z score >1 and ≤2 for women 11—19 years and BMI ≥25 and <30 for women 20—49 years.
‖ Obesity: BMI-for-age z score >3 for children <5 years; BMI-for-age z score >2 for women 11—19 years and BMI ≥30 for women 20—49 years.
¶ Overweight/obesity: BMI-for-age z score >2 for children <5 years; BMI-for-age z score >1 for adolescents 15—19 years and BMI ≥25 kg/m2 for women 20—49 years.
** Wasting: Weight-for-height z score <–2 for children <5 years; underweight: BMI-for-age z score <-2 for women 11—19 years and BMI <18·5 for women 20—49 years.
†† Stunting: Height-for-age <-2 for children <5 years; height-for-age z score <-2 for women 11—19 years and short stature: height <1·49 m for women 20—49 years.
‡‡ Anaemia: Haemoglobin adjusted using the Cohen and Haas equation <110 g/l for children <5 years; and <120 g/l for women 11—49 years. The sample size for anaemia was 1709 for children <5 years; 1108 for women 11—19 years and 4161 among women 20—49 years.
* P < 0·05 v. low tercile/low education/indigenous; †P < 0·05 v. medium tercile/medium education.
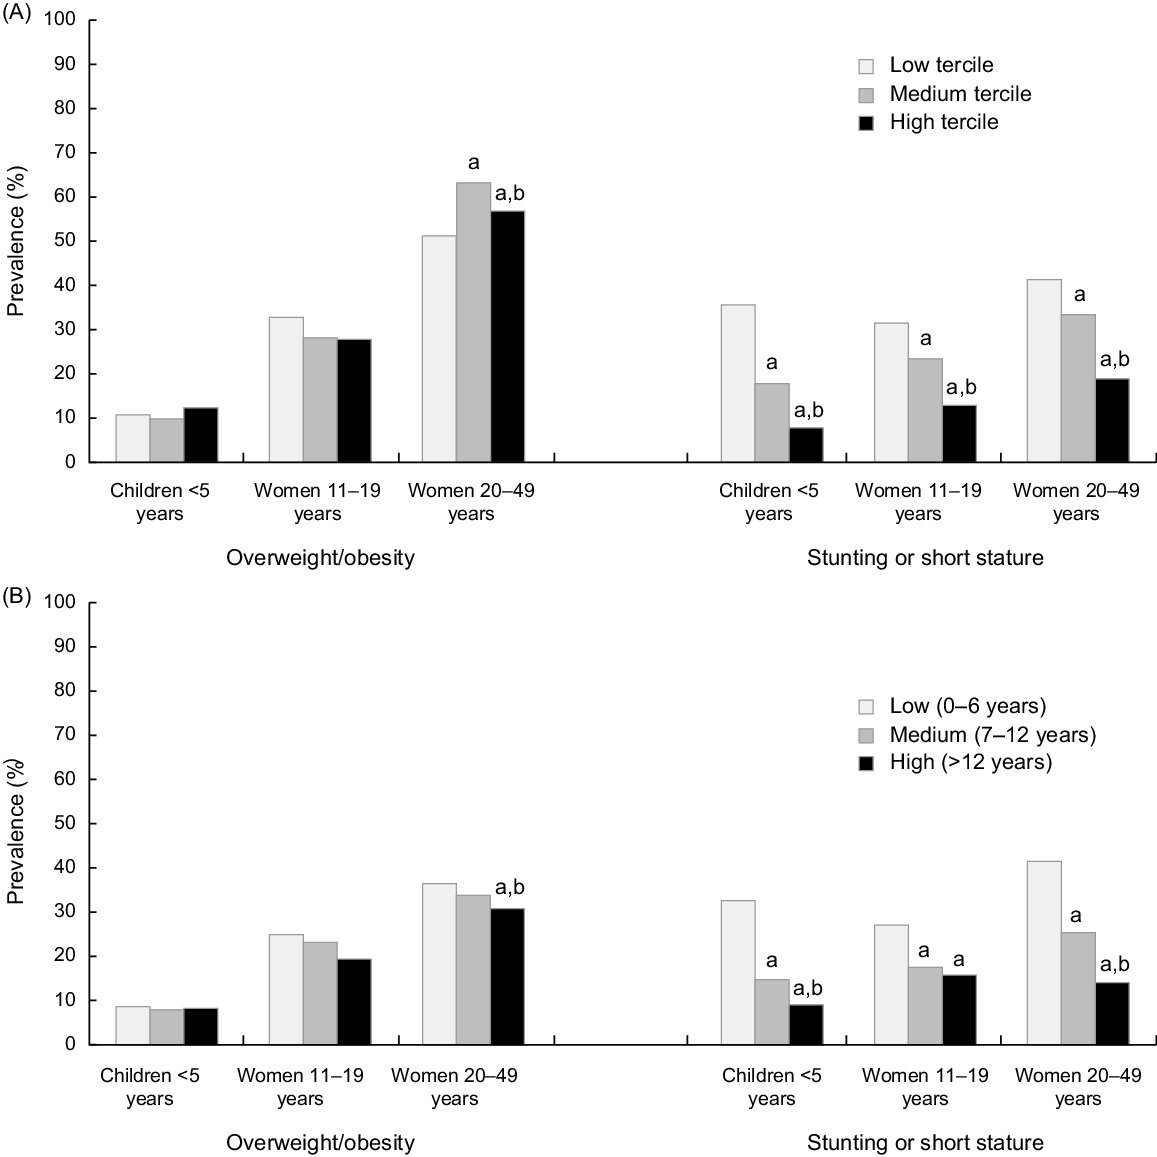
Fig. 1 Prevalence of overweight/obesity and stunting or short stature by wealth status (A) and education level (B) among age groups in Bolivia. Education level is based on years of education and is based on mother’s education level for children <5 years and girls 11–19 years. Data are from Bolivian DHS survey 2008. aP < 0·05 v. low tercile/low education/indigenous; bP < 0·05 v. medium tercile/medium education
In adolescents (15–19 years), in general, the prevalence of anaemia remains high (36·61 %), followed by stunting (22·78 %). The prevalence of stunting and anaemia in the group of adolescents was significantly higher in indigenous and in the low tercile of wealth and education status. Significant differences in the prevalence of overweight between medium/high tertiles and the low tertile were observed (22·24/22·50 % v. 28·93 %). Similarly, the prevalence of overweigh/obesity was significantly lower (P < 0·05) in the high tercile compared with the low (Table 3, Fig. 1).
Regarding undernutrition, 37·38 % of women (20–49 years) are anaemic and 31 % have short stature. Inequalities were observed between the different terciles of wealth (43·10 % high v. 30·74 % low for anaemia; 41·28 % high v. 18·80 % low for short stature), levels of education (43·27 % high v. 14·63 % low for short stature) and between indigenous and non-indigenous (40·93 % indigenous v. 31·45 % non-indigenous for anaemia; 38·11 % indigenous v. 19·89 % non-indigenous for short stature), in this two indicators. With respect to excess BMI, the highest tertiles of wealth are heavier than those in the lowest tertiles; however, all wealth tertiles groups presented prevalence of overweight and obesity over 50 %. It was observed that as education of women improves the prevalence of overweight/obesity decreases.
Discussion
This study provides evidence that in Bolivia all forms of malnutrition coexist with high prevalence of overweight/obesity (29·4–56·8 % across women groups), moderate to high prevalence of anaemia (36·4–63·1 % in women and children) and stunting (22·7–31·0 %) in children under five years, using data from the 2008 DHS survey which, in our belief, represented to the date of the analysis the magnitude of the main nutrition public problems of the country. Although it is important to mention that since that date a recent DHS national survey was concluded (EDSA 2016), this last document put more emphasis on specific indicators as indicated in the title: ‘Prioritized Indicators of the Demography and Health Survey 2016’(10). However, we found the same trend for overweight analysing both surveys, at least for the group of women (20–49 years) from which the indicators BMI excess could be analysed (35·88 % ENDSA 2008 v. 35·10 % EDSA 2016). On the other hand, there was an increase in the prevalence of obesity in this group (21·00 % ENDSA 2008 v. 32·50 % EDSA 2016). Another issue to mention is that in 2012, it was carried out the ESNUT (Health and Nutrition Assessment Survey), but this survey does not have data on maternal weight and haemoglobin(17).
Despite the reduction in under-fives’ stunting trends shown by DHS surveys (1989–2008), gaps between children in the low tertile v. the high tertile of wealth and children of indigenous ethnicity vs non-indigenous remain large. The risk for stunting is five times higher in the low wealth tertile than in the high groups; 3·5 times more in children of mothers with low education level v. children of mothers with high education level and 2 times more in children of indigenous ethnicity compared with non-indigenous children. Similar differences of lesser magnitude are applied to anaemia. Compared with past DHS surveys, this study highlights an increment in the prevalence of overweight/obesity in this group of age. With DHS 2008, one in ten children under five years of age suffers this problem which positions the country over the average for the region of Americas(18). Overall, only 25 % of children under 5 years of age were not stunted, overweight or had anaemia; 75 % had one or more nutritional problems. This increment in the prevalence of overweight and obesity in children under 5 years of age with the combination of stunting is likely to increase the risk of chronic non-communicable diseases in later life.(Reference Kimani-Murage, Kahn and Petiffor19). Integrated Management of Childhood Illnesses is the principal strategy for childcare in Bolivia, which is mainly directed to the prevention and management of stunting, wasting and anaemia; it is advisable to review carefully the strategy’s interventions to ensure that they are promoting adequate growth without contributing to excessive weight gain as was described in other countries.(Reference Kain, Vio and Albala20)
In the group of women as in the children, we continue to observe high prevalence of short stature and anaemia, but a result to be highlighted is the trend to an increase in the prevalence of overweight from 1994 (27·1 %) to 2008 (35·8 %), increase that from our point of view is following the classical demographic spread from adults to adolescents and finally to children(Reference Popkin, Conde and Hou21). Although this prevalence is lower than developed countries(Reference Hyde22,Reference Lobstein and Millstone23) , it suggest that Bolivian women are gaining weight steadily, and this rate of increase is higher among the low tertiles of wealth, showing a risk of overweight/obesity of 1·17 times more in the low tertile of wealth group compared to the high. Furthermore, this study shows that the indigenous women have a major risk of overweight/obesity compared with non-indigenous women. The greater prevalence of overweight/obesity found in indigenous women may suggest that the malnutrition problem has sociodemographic determinants, especially those associated with poverty. As with many other aspects of indigenous health, geographical, historical, social, economic and infrastructure factors are likely to be the major contributors to overweight and obesity among indigenous peoples, but it has been suggested that genetic factors also contribute(Reference O’Dea24). According to the Neel’s ‘thrifty’ genotype hypothesis, traditional populations with a hunter-gatherer lifestyle may have developed a degree of insulin resistance (a precursor of type 2 diabetes) in response to ‘feast or famine’ conditions(Reference Neel25). In environments with abundant food and less physical activity, the thrifty genotype can lead to rapid weight gain, obesity and diabetes(Reference Neel25). Indigenous populations exposed to rapid change to a ‘westernised’ lifestyle are seen as particularly vulnerable to syndrome X (also known as the metabolic syndrome, a constellation of metabolic disorders (including type 2 diabetes)(Reference O’Dea24). As well as rapid westernisation, it is likely that foetal undernutrition also contributes to the development of syndrome X.
Although the problem described in this paper is common to many other countries in the region and beyond, the magnitude and the particularities related to the Bolivian population have scarcely been discussed or addressed in published documents or in specific policies. The data presented in this document will be relevant to tune up different programs, policies and regulations on public nutrition. Currently, there are schemes of food distribution for pregnant women and children under two years of age and conditional cash transfer programs, which if not targeted carefully could have negative effects. There are in place relevant regulations, such as the law 775, law 622 school complementary feeding, which are closely related to promotion of adequate food habits for the general population and food distribution to school-age children, which need to be fully implemented considering the diversity of the nutritional problems and how they behave at different SES levels. The paper also calls for attention for the need of a good quality, reliable and timely nutritional monitoring system, and a continuous analysis of data from existing surveys(Reference Perez-Cueto, Velasco and Almaza26,Reference Pérez-Cueto, Naska and Monterrey27) which show how low-income households had steadily increased energy-dense sources of food and decreased the foods of plant origin, by simply knowing the preferences and factors influencing food consumption, different education, communication or other types of intervention could be proposed.
Finally, we consider that currently there are institutional and normative conditions to expand current actions and interventions performed to reduce undernutrition to cover the rising of excess BMI problem in the course of life, the full acknowledgment of the wide range of problems, its interactions and complications by the policy makers is required to promote actions. We expect that this paper would contribute to this effort.
Our study had strengths and limitations. The analysis included a large and national-representative data of women with available information about nutritional status, household income and education level, and to the best of our knowledge, this is the one of the first published study assessing malnutrition-related disparities in Bolivia. The main limitation is the cross-sectional nature of the survey, which does not enable us to infer causality among socioeconomic indicators and malnutrition. Another important limitation is the fact that the sample only considers women; however, it is important to mention that this manuscript is part of a supplemental issue where it was decided to limit the analysis to a common sample across countries.
Conclusions
In sum, we found that Bolivia is in a transitional stage and faces not only the problem of undernutrition but also those of overnutrition. Stunting and anaemia in children decreased over the time but continues to be the main undernutrition problems. Meanwhile, overweight has emerged as a public problem, especially in the group of women of childbearing age.
This study calls for state-specific policies keeping in view of the nature of inequality in malnutrition in the country and its differential characteristics across wealth status.
Acknowledgements
Acknowledgements: The authors would like to thank Latin American Nutrition Leadership Program (Programa LILANUT) for coordination of the publication. Financial support: DSM Nutritional Products provided funds for the publication of this manuscript. DSM Nutritional Products had no role in the design, analysis or writing of this article. Conflict of interest: The authors declare that there are no conflicts of interest. Authorship: The authors’ responsibilities were as follows: M.M., A.B., A.M.A. designed the research. A.B., M.M. analysed the data. M.M., A.M.A. wrote the manuscript. All the authors read and approved the final manuscript. Ethics of human subject participation: This study was conducted according to the guidelines laid down in the Declaration of Helsinki, and all procedures involving research study participants were approved by the Ethics Committee of the Medicine School of San Andrés University.


