


High-fat diets consumption induces low-grade obesity-related inflammation(Reference Clark, Alloosh and Wenzel1). The blood-brain barrier (BBB) can be damaged by immune cells invasion facilitated by pro-inflammatory cytokines(Reference Banks2). Interestingly, omega 3 fatty acids inhibit the production of pro-inflammatory cytokines(Reference Parker, Gibson and Brotchie3), and omega 3 fatty acids supplementation (DHA) can increase the activity of the prefrontal cortex(Reference McNamara, Able and Jandacek4), which is one of the brain areas that was found deactivated in obese humans and minipigs(Reference Le, Pannacciulli and Chen5–Reference Volkow, Wang and Telang7). We hypothesized that a diet enriched with omega 3 might prevent the onset of central inflammation and protect some brain areas that are important for food intake control.
We decided to investigate this question in 15 obese minipigs fed with high-fat diets of which the lipids were provided by either fish oil rich in omega 3 (O3), sunflower oil rich in omega 6 (O6), or lard rich in saturated fat (S). Various measures were performed on these animals, including adiposity estimation by CT-scan, BBB permeability evaluation by dynamic injected CT-scan, and brain metabolism exploration by Positronic Emission Tomography (PET).
After five weeks of treatment, there was no significant difference between groups for the body weight, adiposity accumulation and distribution (P>0.10). The BBB was the most permeable in the O3 group, intermediary in the S group, and the least permeable in the O6 group for the cortical areas (P=0.0326 for O3 vs. O6 – Fig. 1). Basal metabolism differences were found in several brain regions involved in food intake control. For example, the anterior prefrontal cortex metabolism was lesser for O3, intermediary for S, and higher for O6 (P unc<0.0001 – Fig. 2). There was also a decreased activity in the nucleus accumbens (P unc=0.038) for O3 compared to O6. There was a significant correlation between the BBB permeability and the prefrontal cortex activity (R=0.55, P=0.041 – Fig. 3).
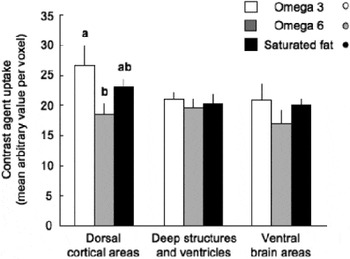
Fig. 1. Blood brain barrier permeability.
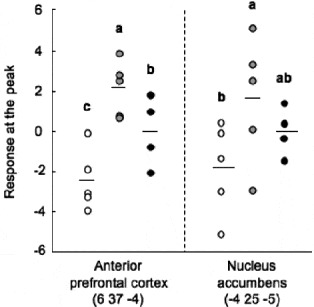
Fig. 2. Basal brain activity.
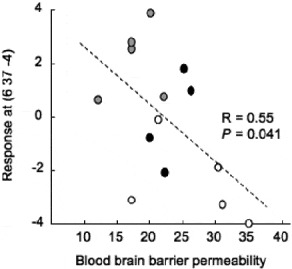
Fig. 3. Orthogonal validation of iTRAQ analysis.
Contrary to what was expected, these results demonstrate that a diet enriched with O3 did not protect the BBB nor the basal metabolism of brain areas (e.g. prefrontal cortex and basal nuclei) usually altered by obesity and high-fat diets. Surprisingly, the O6 diet induced the least damage to the BBB and deactivation of the prefrontal cortex and nucleus accumbens. Further research is needed to elucidate whether a causal relationship between these two phenomena exists, and why the O6 diet, unlike O3, had this protective effect. Interestingly, our results are consistent with our data on intestinal permeability(Reference Lallès, Perrier and Val-Laillet8), suggesting global effects of the diets on the gut-brain axis.


