


According to the Sustainable Development Goal 3 (target 3.2), there should be efforts to end preventable deaths of children under 5 years of age and to reduce under-five mortality rate to at least 25/1000 live births by 2030( 1 ). Severe acute malnutrition (SAM) remains a major cause of childhood mortality and morbidity worldwide particularly in developing countries like India( 1 ). According to National Family Health Survey-4, 7·5 % of under-5-year-old children in India suffer from SAM( Reference Bhadoria, Kapil and Bansal 2 ). Mortality rate among SAM children is nine times higher than those in well-nourished children( Reference Bhadoria, Kapil and Bansal 2 ) because they have a limited ability to respond to stress. Being nutritionally deprived, SAM is frequently complicated by concurrent infective illnesses( Reference Collins 3 ).
Considering the physiological alterations and coexisting infections in SAM, the WHO has recommended treatment of SAM in two phases – initial stabilisation phase and later rehabilitation phase. Initial phase focuses on treatment of complications and restoration of homoeostasis, and rehabilitation phase on catch-up growth( Reference Manary, Trehan and Weisz 4 ). However, this nutritional repletion can lead to refeeding syndrome( Reference Ormerod 5 ) (RFS) which is defined as a potentially fatal shift in fluids and electrolytes that occur in children with SAM receiving refeeding. During refeeding, secretion of insulin in response to large amount of dietary carbohydrate leads to movement of phosphate, K and Mg intracellularly causing low serum levels( Reference Hearing 6 ). The hallmark biochemical feature of RFS is hypophosphataemia (HP)( Reference Kimutai, Maleche-Obimbo and Kamenwa 7 ). Considering HP as a surrogate marker, RFS is reported in 20–40 % of SAM cases. Hypokalaemia and hypomagnesaemia commonly complicate RFS; however, these are not consistently detected( Reference Ormerod 5 , Reference Hearing 6 ). Moreover, K and Mg are supplemented as KCl syrup and MgSO4 injection or as vitamin–mineral mix solution which contains K and Mg but no P. The signs and symptoms of HP are often misinterpreted as sepsis. Although the WHO has recommended dietary plan to prevent RFS, the amount of P depends on the type and amount of milk used. It is documented that locally prepared transition feed provides limited amount of P( Reference Kimutai, Maleche-Obimbo and Kamenwa 7 ).
Although there is a paucity of studies that have assessed RFS or HP in children in North India, this study was done to find out the incidence and various predictors of moderate/severe HP in SAM among North Indian children.
Methods
Study setting and design
This hospital-based prospective observational study was conducted from August 2014 to July 2015 in the inpatients’ department of Department of Paediatrics, King George’s Medical University, Lucknow, Uttar Pradesh, a tertiary care teaching hospital of north India. Ethical clearance for this study was obtained from Ethics Committee of Research Cell of King George’s Medical University, Lucknow (Letter No. 6620 /R. cell – 15).
Participants
Consecutive children between 6 and 59 months of age, who were admitted with SAM were included in the study( 8 ). Informed written consent for participation was obtained from parents/guardians of all recruited children. SAM was defined as a mid-upper arm circumference <115 mm and/or weight-for-height/length <–3 z-scores of the WHO growth standards and/or having bilateral oedema( 8 ). Subjects were excluded if they had rickets, renal and endocrine disorders, malabsorption syndrome or any other non-nutritional cause of bipedal oedema, as these factors may alter the serum phosphate level.
A standardised data collection form was used to record basic demographic details, clinical and biochemical parameters. The following variables were collected: age, sex, religion, residence, type of house, type of family, dietary habit including exclusive breast-feeding and complementary feeding, socio-economic status on the basis of updated Kuppuswami scale( Reference Kumar, Shekhar and Kumar 9 ), vaccination status, presence of fever (defined as oral temperature >99·5°C)( Reference Sherman and Sood 10 ), acute diarrhoea (liquid/watery stool more than three times a day)( Reference Bhatnagar, Lodha and Choudhary 11 ), hypothermia( 12 ), pallor (pale appearance of conjunctivae), skin manifestations (any hypo or hyper pigmented lesions), signs of vitamin A deficiency as per WHO criteria of xerophthalmia( 13 ) and outcome. Data on type of feeding were also collected. Biochemical data included anaemia( 14 ), hypocalcaemia( Reference Larry 15 ), hypomagnesaemia (serum Mg level of <0·7 mmol/l)( Reference Larry 15 ), hypoglycaemia( 8 ) (blood sugar concentration of <3 mmol/l in children with severe malnutrition) and hypokalaemia( Reference Larry 15 ) (serum K level <3·5 meq/l).
The attending physician decided the treatment and type of feeding. It was not possible to implement the WHO-protocol-based feeding in all children since most of the children were sick due to the associated complications like tubercular meningitis, acute encephalitis syndrome, complicated pneumonia and others. These children were started with 25 ml/kg of milk feed (pasteurised cows’ milk), which was slowly built-up to 100 ml/kg over a period of 4–5 d. The children were given pasteurised cows’ milk-based feed (supplied from University), either as protocol based or as non-protocol based. It contained 130 mg of P/100 ml of milk. Milk-based F-75 contains 30 ml of milk, so it provided 39 mg of P per each F-75 diet. Milk-based F-100 contains 95 ml of milk, so it provided 123·5 mg of P per diet. In addition to feeding, all the children were supplemented with vitamins and minerals as per the WHO guidelines( 8 ). Rest of the treatment was tailored according to the comorbidities following the standard guidelines. The patients were reviewed daily of their progress, and their final outcome along with associated diagnosis was recorded. Serum P was measured consecutively, starting from before feeding to 5 d after feeding. HP was defined as serum value <1·19 mmol/l. HP was categorised as mild, moderate and severe when serum phosphate concentration was 1·19–0·65, 0·65–0·32 and <0·32 mmol/l, respectively( Reference Larry 15 ). For statistical advantage, moderate/severe HP were clubbed together.
Specimen collection
Procedure of sample collection was explained in detail, and consent was taken before the procedure. On the day of admission, venous blood (7 ml) was withdrawn, after sterilising the sampling area with spirit and betadine. Of the collected sample, 2 ml was sent for automated count in EDTA vial. Rest 4 ml of venous blood was divided into two plain (serum) vials, and one vial was sent for liver and renal function tests and the other vial was sent for serum phosphate, serum Mg and other electrolyte evaluation. In all, 1 ml sample was sent in fluoride vial for random blood sugar on the day of admission. Serum phosphate levels were checked daily for 5 d after feeding was started. Serum Mg levels were done only once on starting feeding.
Measurement of serum phosphorous levels
VITROS Chemistry Products PHOS Slides quantitatively measure P concentration in serum, plasma and urine using VITROS 250/350/950/5, FS and 4600 Chemistry Systems and the VITROS 5600 Integrated System( Reference Gomori 16 – 20 ). The VITROS PHOS Slide method was performed using the VITROS PHOS Slides and the VITROS Chemistry Products Calibrator Kit 1 on a Vitros 250 Analyser (Ortho Clinical Diagnostics). The concentration of P in the sample was determined by measuring the heteropolymolybdenum blue complex by reflectance spectrophotometry.
Statistical analysis
The collected data were entered into a Microsoft Excel sheet and analysed using SPSS software version 16.0 (SPSS Inc.). The data were assessed for normality. Univariate analysis was performed to study the frequency distribution of the variables. To test the association between categorical and continuous variables, χ 2 and t tests were used. Continuous data were summarised as means and standard deviations. Binary logistic regression analysis was done to find out the predictors of moderate/severe HP. The variables having P value <0·1 on univariate analysis were included in the logistic regression analysis. A two-tailed P value <0·05 was considered statistically significant.
Post hoc analysis was done to find out the power of the study. Considering the prevalence of HP in SAM – 80 % as reported in previous studies and 60 % in present study with an α error of 0·05 – study power was calculated to be 95·5 %.
Results
The study was done over a period of 1 year from August 2014 to July 2015. All the admitted children were screened for eligibility, which included 102 such children. The caretakers of twenty-four children did not give consent. A total of thirteen children were excluded because of early mortality (3), rickets (3), chronic kidney disease (5) and coeliac disease (2). A total of sixty-five symptomatic SAM children of either sex were recruited and evaluated.
Table 1 reflects the demographic, clinical and biochemical parameters of the study population. About forty-six children were given non-protocol based feeding. These children were sick due to associated diagnosis such as severe or complicated pneumonia (41·5 %), acute encephalitis syndrome (18·5 %) and tubercular meningitis (20·0 %). Such children were started with 25 ml/kg of milk feed, which was slowly built-up to 100 ml/kg over a period of 4–5 d.
Table 1 Baseline, clinical and biochemical characteristics of the study population (n 65) (Mean values and standard deviations; numbers and percentages)
Protocol-based treatment was implemented in nineteen children. Initially F-75, a low-protein milk-based formula diet, was given, followed by a gradual transition to F-100 over 2–3 d (transition phase). F-100, a milk formula with higher protein and energy content, was used in the rehabilitation phase. As mineral mix and vitamin mix are not available in this part of the country, they were not added to F-75 or F-100 diet. However, they received multivitamin syrup and minerals (Zn, Mg and K) as supplements. Feed was given two hourly for a total of 12 feeds/d. Nasogastric tube was used for feeding in fifty-two children who were sick due to associated disease or in some patients of acute gastroenteritis who were not able to take orally due to vomiting. A total of forty-five patients (69·2 %) were discharged, ten (15·4 %) expired and ten (15·4 %) left the hospital against medical advice. Mean duration of hospital stay was 10·2 d.
Mean serum P level from baseline to day 5 after feeding is shown in Fig. 1. It is evident that the lowest nadir of serum P was seen on day 3 after feeding, so for the purpose of analysis HP on admission (baseline) and on day 3 post feeding were assessed. Moderate/severe HP increased from 20·0 to 38·5 % on day 3 and it was statistically significant (P <0·001).
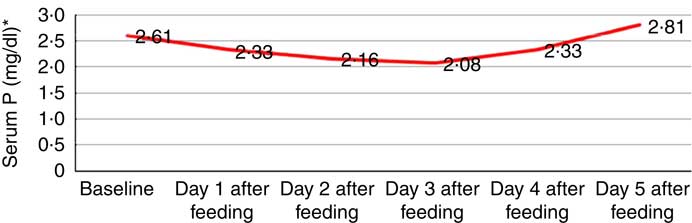
Fig. 1 Mean serum phosphorus level (mg/dl, ![]() ) from baseline up to day 5 after feeding. * To convert phosphorus in mg/dl to mmol/l, multiply by 0·323.
) from baseline up to day 5 after feeding. * To convert phosphorus in mg/dl to mmol/l, multiply by 0·323.
Association of moderate/severe HP on admission and day 3 with different clinical and laboratory features was analysed. Baseline moderate/severe HP was found to be significantly associated with the presence of hypothermia (OR = 7·6; 95 % CI 1·8, 31·3), skin manifestations (OR = 51·7; 95 % CI 8·8, 302·4), hypoglycaemia (OR = 3·5; 95 % CI 0·9, 12·3) and hypocalcaemia (OR = 8·8; 95 % CI 5·7, 43·8). Day 3 moderate/severe HP was also found to be significantly associated with the presence of hypothermia (OR = 3·5; 95 % CI 1·2, 9·9), skin manifestations (OR = 8·3; 95 % CI 2·2, 30·4), hypoglycaemia (OR = 5·1; 95 % CI 1·6, 15·8) and hypocalcaemia (OR = 46; 95 % CI 8·9, 237). There was no significant association between baseline HP and outcome (P = 0·135) and between HP on day 3 after feeding and outcome (P = 0·398) (Table 2).
Table 2 Association of clinical and biochemical characteristics with hypophosphataemia (at admission and on day 3 after feeding) (Numbers and percentages)
* P <0·1.
† Measles rash (31·2 %), hypo-pigmented lesions (56·2 %) and kwashiorkor-like dermatosis (12·5 %).
Binary logistic regression analysis was done to find out predictors of baseline moderate/severe HP. Variables that were entered in the adjusted logistic regression model were hypothermia, skin manifestations, hypoglycaemia and hypocalcaemia. None of the variable was found to be significantly associated with baseline moderate/severe HP (Table 3). Table 4 depicts the results of binary logistic regression analysis done to identify the predictors of moderate/severe HP on day 3. Day 3 moderate/severe HP was found to be significantly associated with the presence of hypocalcaemia (OR = 37·96; 95 % CI 5·05, 285·25).
Table 3 Logistic regression analysis to identify the predictors of moderate and severe hypophosphataemia at admission (Odd ratios and 95 % confidence intervals)
* Adjusted OR for age, sex, place of residence and socio-economic status.
Table 4 Logistic regression analysis to identify the predictors of moderate and severe hypophosphataemia on day 3 after feeding (Odd ratios and 95 % confidence intervals)
* Adjusted OR for age, sex, place of residence and socio-economic status.
Discussion
The study was undertaken to find out the incidence and various predictors of moderate/severe HP in SAM among North Indian children.
In our study, 60 % (39/65) of admitted children (6–59 months) with SAM had HP and moderate to severe HP was found in about 20 % (13/65) cases. Previous studies have also documented HP in children with SAM ranging from 86 to 61 %( Reference Manary, Hart and Whyte 21 – Reference Namusoke, Hother and Rytter 26 ). This difference in the prevalence can be explained by the fact that a lower cut off value was considered in our study. The prevalence of moderate to severe HP in SAM was found to be 25, 12 and 6 % by Yoshimatsu et al. ( Reference Yoshimatsu and Hossain 27 , Reference Manary, Hart and Whyte 28 ), Manary et al. ( Reference Manary, Hart and Whyte 21 ) and Kimutai et al. ( Reference Kimutai, Maleche-Obimbo and Kamenwa 22 ), respectively.
Prevalence of moderate and severe HP was almost similar (20 %) in our study and in the study done by Yoshimatsu et al. (25 %). Difference in prevalence of moderate to severe HP in other studies can be due to the difference in sample size and other factors like demographic, social factors and associated illnesses. A systemic review done by Manary et al. ( Reference Manary, Trehan and Weisz 29 ), who reviewed 938 articles, concluded that the prevalence of moderate to severe HP ranged from 20 to 40 %.
Serum P levels continued to decrease from baseline up to day 3 and then started increasing, though it did not increase up to the normal level on day 5. Other studies have reported a decrease in serum P on day 2 of treatment( Reference Manary, Hart and Whyte 21 , Reference Kimutai, Maleche-Obimbo and Kamenwa 22 , Reference Yoshimatsu and Hossain 27 , Reference Manary, Hart and Whyte 28 ). However, other studies( Reference Namusoke, Hother and Rytter 26 , Reference Hother, Girma and Rytter 30 ) found increasing concentrations of serum P throughout the treatment period. This difference may be attributed to the type of therapeutic food used. In our study, protocol-based feeding was done in nineteen children only, with locally available food that contains lesser concentration of P in than that recommended by the WHO( Reference Namusoke, Hother and Rytter 26 ).
In light of the common and serious nature of RFS and HP, this observation raises alarm to gradually increase the energy intake from stabilisation to rehabilitation phase. Moreover, feeding should be done with commercially available pre-mixed F-75 and F-100 products. If such products are not available, F-75 and F-100 should be made from locally available ingredients with an added vitamin–mineral mix fortified with P.
Analysis was done to find out the predictors of moderate and severe HP at baseline and at day 3 of feeding. Baseline HP was not found to be associated with any variable, but HP at day 3 was found to be significantly associated with hypocalcaemia. Vitamin D deficiency prevails in epidemic proportions in India( Reference Khadilkar, Khadilkar and Chinnappa 31 ). In vitamin D deficiency, serum Ca and serum P levels are found to be low( Reference Heald, Anderson and Scargill 32 ).
This is the first study done in the North India to estimate the incidence of HP among children with SAM, change in serum P during treatment and its relation with feeding, clinical features and laboratory investigations. However, there are few limitations of the study. First limitation is its small sample size. It was a time-bound study; we tried to recruit all the patients who were admitted during the study period. Other authors have done studies with almost the same number of patients. Hother et al. ( Reference Namusoke, Hother and Rytter 26 ) reported HP in sixty-eight children with SAM. Manary et al. ( Reference Manary, Hart and Whyte 21 ) concluded the association of HP with increased mortality in sixty-eight children with SAM.
Present study highlights the importance of HP and its consequences in patient with SAM, so that efforts can be taken to supplement the stabilisation and rehabilitation diet with P. In this part of the country, commercial pre-mixed F-75 and F-100 products as per WHO protocol were not available at the time of study.
Although the present study helps in widening the knowledge of HP in SAM, it has to be taken into consideration that present study was done at a tertiary care hospital and not at community level, thereby showing only the ‘tip of the iceberg’ so further research should be planned at community level to know and confirm the actual magnitude of the problem.
Conclusions
The present study reveals that HP is a common biochemical abnormality in children with SAM. Considering its impact on the health of the child, serum P levels should be monitored in SAM patients during treatment and refeeding. Although HP was not found to be significantly associated with increased mortality, further studies should be done to confirm this.
Acknowledgements
We thank all faculty members and resident doctors for helping out during the study.
There was no specific funding for this study.
C. K. and R. C. were involved in study design, data collection and manuscript writing. S. G. carried out statistical analysis and K. S. performed all laboratory work. S. G. and S. K. helped in data collection and critically reviewed the manuscript.
There were no conflicts of interest.


