


Sugar and its possible connection to various diseases and conditions is widely discussed these days. In the opinion of the general public, it seems like sugar has replaced fat as the most important factor in an unhealthy diet and sometimes is even regarded as some kind of a poison. It has also been suggested that an increased intake of sugar is the cause for the obesity epidemic. However, most of the statements and conclusions heard in the public debate are not based on any scientific evidence. Even though the obesity prevalence has increased in the last two decades, the total consumption of sugar in the population has not changed since the 1960s, at least not in the Nordic countries1. The pattern of sugar intake has, however, changed with more sugar consumed from ready-to-eat foods and candies and less from jam and pure sugar products2.
To explain the increasing prevalence of obesity is of course very difficult and the causes are very complex. Nevertheless, overweight is always the result of an excess energy intake in relation to energy expenditure in the individual. Hence, all food with a high energy density, like refined sugar, could contribute to an excess energy intake and weight gain. However, the evidence for an association between sugar intake and obesity is contradictory and non-sufficient. The World Health Organization/Food and Agriculture Organization report on diet, nutrition and prevention of chronic diseases concludes that the existing results do not allow a judgement to be made about the sugar content of food in general and obesity3. The relationship between sugar-sweetened drinks and obesity is, however, somewhat more convincingReference Ludwig, Peterson and Gortmaker4, Reference Raben, Vasilaras, Moller and Astrup5, although other contradictive results have also been publishedReference Forshee and Storey6.
Traditionally, information on sugar intake is obtained from dietary assessments of some sort. In free-living subjects, all available assessment methods are based on self-reporting. The problem of bias in self-reported dietary data is well-known. Overall, under-reporting as well as obesity-specific under-reporting of total energy is commonly describedReference Livingstone and Black7–Reference Maurer, Taren, Teixeira, Thomson, Lohman and Going9. Furthermore, dietary data may be biased by over-reportingReference Maurer, Taren, Teixeira, Thomson, Lohman and Going9–Reference Ventura, Loken, Mitchell, Smiciklas-Wright and Birch11 as well as nutrient-specific misreportingReference Macdiarmid and Blundell8, Reference Heitmann and Lissner12. There are reasons to believe that food considered to be unhealthy, such as sugar, is selectively under-reported (or under-eaten during the study period), while healthy foods might be over-reportedReference Heitmann and Lissner12–Reference Goris, Westerterp-Plantenga and Westerterp14.
Another possibility of assessing sugar intake is to use mutans streptococci (MS) and lactobacilli (LB) counts in saliva. It is well established that sugar causes caries, and the aetiology of caries includes acidogenic bacteria such as LB and MSReference Tanzer, Livingston and Thompson15. The hypothesis is that the more sugar eaten, the higher the levels of bacteria in the saliva. The literature regarding the sugar–bacteria link has recently been reviewed and the level of evidence has been discussed in a separate article16. The review concluded that the evidence for an association between MS/LB counts in saliva and the sugar intake was rather weak due to the lack of experimental studies of high quality. Furthermore, it concluded that the bacteria could not be used as an indicator of sugar intake on an individual level, but could be used on a population level. Also that, the bacteria counts are distorted by many confounding factors, such as salivary flow, oral hygiene, etc. Despite these limitations and in the light of the difficulties of obtaining valid information on sugar intake from dietary surveys, measures of salivary bacteria could contribute further to our understanding of sugar intake.
The purpose of this paper is to further explore the link between reported sugar intake and the salivary bacteria MS and LB. Specifically, this study investigates how associations with total sugar, sweet and non-sweet foods differ between the two bacteria and how these associations differ between mothers and their teenaged daughters and sons. Furthermore, the study investigates how sugar intake, measured with these two different methods, relates to body mass index (BMI). This is the first time that the total diet is studied in relation to salivary bacteria. This study is also unique as it includes teenaged boys and girls as well as their mothers.
Subjects and methods
Subjects
Subjects are participants in the Stockholm Weight Development Study (SWEDES) with 481 adolescent children and their mothers from the Stockholm area17. The data collection was made in 2001–2002. Of the original 962 (2 × 481) subjects, only those who contributed with a valid salivary sample are included in this study (n = 821). Reasons for not leaving a sample were: (1) treatment with antibiotics within 2 months prior to sampling (n = 70), (2) other reasons such as not being fasting, the laboratory being closed, failing to follow instructions, etc. (n = 70). The cultivation of both bacteria failed in one test (mother) and another seven tests failed in MS only (two sons and five mothers). In all, 821 subjects (414 mothers, 235 daughters and 172 sons) had valid LB counts, and 814 subjects (409 mothers, 235 daughters and 170 sons) had valid MS counts. There were no statistically significant differences between those with valid salivary test and those without in terms of BMI, age, family income and reported sugar intake. For subject characteristics, see Table 1.
Table 1 Subject characteristics

SD – standard deviation; BMI – body mass index.
* Body fat % is measured with BodPod®.
In most analyses, an energy quotient was used as an adjusting variable, see below. The quotient was based on information from dietary and physical activity (PA) questionnaires. Forty-two mothers, 28 daughters and 15 sons did not complete both questionnaires due to either a lack of understanding or simply a refusal. As a consequence, these individuals, who did not differ in terms of age, family income, BMI or bacteria levels, were not included in the analyses.
Saliva sampling and bacteria cultivation
Fasting, paraffin-stimulated whole saliva was collected in the morning. One millilitre of the saliva was transferred to 4.2 ml of VMG transport mediumReference Möller18. The sample was sent by mail to the Department of Cariology in Göteborg and was processed within 24 h. It was dispersed on a Whirlmixer for 20 s, serially diluted in 0.05 M phosphate buffer and plated on mitis salivarius bacitracin agarReference Gold, Jordan and Van Houte19 to estimate the number of MS, and on Rogosa SL agar to estimate the number of LB. The MSB agar plates were incubated in 95% N2 and 5% CO2 at 37°C for 2 days and the SL agar plates were incubated aerobically at 37°C for 3 days. The number of colony-forming units (CFU) of MS on MSB agar were counted and identified by their characteristic colony morphology. All CFU in SL agar were regarded as LB.
Dietary data
A validated dietary questionnaire from the Swedish Obese Subjects (SOS) study was used to assess dietary intake in terms of energy and macronutrient intake, as well as intake from different food groups. The questionnaire is not only validated in adultsReference Lindroos, Lissner and Sjöström20, but also in 18, 15-year-old adolescents (nine boys and nine girls) using doubly labelled water21. In these validation studies, the reported mean energy intake did not differ significantly from measured energy expenditure. More details of the dietary questionnaire are described elsewhereReference Lindroos, Lissner and Sjöström20.
The food groups classified as high sugar-containing food items (mono-/disaccharides contributing ≥20% to the energy content) were: ‘beverages’ (all caloric beverages excluding milk), ‘milk’ (milk, yoghurt and similar products, including sweetened products), ‘candies/chocolates’, ‘cakes’ (sweet baked items, such as cakes, cookies, pastries, etc.) and ‘desserts’ (e.g. ice cream). Low sugar-containing food items were: ‘cooked meals’ (meat/fish with potatoes/rice/pasta and vegetables), ‘fast food’ (hot dogs, hamburgers, pizza), ‘light meals’ (soup, salad, omelette, toasted sandwich, etc.), ‘sandwiches’, ‘breakfast cereals’ (including porridge) and ‘salty snacks’ (crisps, cheese doodles, nuts, etc.). The mean intake of cakes and desserts was quite low and were combined in Fig. 1 for a more legible diagram. Since milk is not as much related to caries as other sugar-containing food items, a variable where sugar from milk was subtracted from the total sugar amount, was also tested.
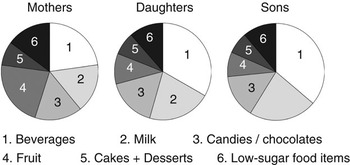
Fig. 1 Food groups contributing to the total sugar intake
Previous analyses of the children in this study cohort have shown both under- and over-reporting of dietary intake when compared to estimated energy expenditure22. To adjust for misreporting in the analyses, a variable – energy quotient – was constructed by dividing reported energy intake by estimated energy expenditure. Energy expenditure was estimated by using formulas for basic metabolic rate (BMR)Reference Schofield23 added to the energy expenditure for PA estimated by questionnaires (IPAQReference Craig, Marshall, Sjostrom, Bauman, Booth and Ainsworth24 for the mothers and SAPAQ for the adolescents). SAPAQ has been validated in a subgroup in this study and it showed reasonable validity compared to accelerometersReference Ekelund, Neovius, Linne and Rossner25. Energy expenditure from PA was calculated in the same way here as in the validity study as (MET-minutes/60) × body weightReference Pereira, FitzerGerald, Gregg, Joswiak, Ryan and Suminski26. MET-minutes (metabolic energy turnover) were calculated as duration × frequency × MET intensity.
The word ‘sugar’ here includes all mono- and disaccharides combined, unless otherwise stated.
Statistics
The statistical tests used were linear regression models and Pearsons’s correlation, using SPSS software (14.0). Results with a P-value under 0.05 were considered statistically significant. Variables not normally distributed (skewness >2 or kurtosis >7) have been logarithmically converted. As significant interactions were found in some associations between dietary data and bacteria counts between both boys–girls and mothers–children, mothers, boys and girls were analysed separately throughout the work. All food groups were tested against both bacteria in regression models, controlling for energy intake and misreporters. Those with a P-value of 0.1 or less were included in the combined regression models (Tables 4 and 5). BMI and maternal bacteria counts were also included in these models.
The study was approved by the local Ethics Committee of Huddinge University Hospital. Informed consent was obtained from each mother and verbal consent was also ascertained from each child.
Results
Reported sugar intake
The mean reported total sugar intake in mothers was 92 g day−1 (range: 20–329), daughters 141 g day−1 (range: 36–879) and sons 185 g day−1 (range: 55–739). In Fig. 1, the proportions of the total sugar intake from the different food groups are presented. The single most important contributor in children was beverages, 33% of the total sugar intake in daughters and 36% in sons. In mothers, sugar from beverages and fruit each contributed to about 22%.
Bacteria prevalence
The prevalence of MS, but not LB, differed between mothers, girls and boys, as shown in Fig. 2. MS counts were higher in females than in males with the highest prevalence among mothers (daughters–sons: P < 0.001, mothers–daughters: P = 0.03, mother–sons: P < 0.001). As expected, MS counts and LB counts were correlated to each other, with a correlation coefficient r of 0.47 in mothers, 0.27 in daughters and 0.35 in sons (P < 0.001 for all).

Fig. 2 Mean bacteria levels in daughters, sons and mothers with 95% confidence intervals (MS – mutans streptococci; CFU – colony-forming units; LB – lactobacilli)
BMI vs. sugar intake
In mothers, significant relationships were found between both bacteria counts and BMI, but not between BMI and reported sugar intake (Table 2). In boys, BMI was positively correlated with MS counts when total energy intake was adjusted for (P = 0.08), even though not on a significant level. When boys and girls were combined, the coefficient was similar to that in boys alone but statistically significant (r = 0.137, P = 0.008).
Table 2 Correlation coefficients for BMI vs. MS counts, LB counts and reported sugar intake

BMI – body mass index; MS – mutans streptococci; LB – lactobacilli.
* P < 0.05; **P < 0.01; ***P ≤ 0.001.
† Adjusted for total energy intake and energy quotient.
MS counts vs. reported sugar intake
Total sugar intake was not significantly associated with MS counts in any of the groups (Table 3). However, when sugar from milk was excluded from total sugar intake, the association between sugar intake and MS counts was significant in daughters. When analysing high sugar-containing food groups one by one, controlling for total energy intake and misreporting, sugar from milk (β = 0.14, P = 0.01) was associated with MS in mothers and sugar from beverages (β = 0.21, P = 0.005) and candies/chocolates (β = 0.19, P = 0.009) in daughters. In sons, no food group was significantly associated with MS counts, but the association with milk was almost significant (β = −0.15, P = 0.06). There was a significant interaction in the milk–MS association between mothers and children combined (β = 0.42, P = 0.03). In addition, the association between beverage intake and MS counts differed between mothers and the children (P for interaction = 0.014 in boys and 0.030 in girls). The only significant gender interaction found was in the association between total energy intake and MS counts (P for interaction = 0.046).
Table 3 Associations between total sugar intake and bacteria countsFootnote *

MS – mutans streptococci; LB – lactobacilli.
* Adjusted for total energy intake and misreporting (energy quotient).
† All sugar from milk intake is subtracted from total sugar intake.
As a high relative intake from low sugar-containing foods might be associated with low bacteria counts, these associations were also tested in regression models, controlling for total energy intake and misreporting. The only significant result found was a positive association between energy from light meals and MS counts in daughters (β = 0.17, P = 0.02). A high intake of light meals was correlated with a high intake of desserts (r = 0.15, P = 0.015) and cakes (r = 0.013, P = 0.04) in daughters, but not with candies/chocolates or sweet beverages.
Finally, a multiple regression model was constructed including all available variables that might influence MS saliva counts (Table 4). In mothers, the model explained 5.3% of the variation in MS counts. BMI and sugar intake from milk were the only variables that independently predicted MS counts. In daughters, the model explained 7.4% of the variation in MS counts and the sugar-containing food groups: beverages, candies/chocolates and fruit, were all independently associated with MS counts. In sons, maternal bacteria counts were the only variable independently associated with MS counts. The explained variance of the total model was 8.4% in sons.
Table 4 Combined linear regression model including different variables affecting MS counts

MS – mutans streptococci; BMI – body mass index; CFU – colony-forming units.
LB counts vs. reported sugar intake
Total sugar intake was significantly associated with LB counts in mothers (P = 0.001), but not in daughters (P = 0.07) or sons (P = 0.47), as seen in Table 3 (P = 0.03 for interaction between mothers and sons). When sugar from milk was excluded from the total sugar intake, the association between sugar intake and LB was significant also in daughters (P = 0.032) (P = 0.008 for interaction between mothers and sons). No gender interactions were found in the associations between dietary variables and LB counts.
When dividing the total sugar intake into different food groups, sugar from candies/chocolates (β = 0.14, P = 0.013) and cakes (β = 0.14, P = 0.008) was significantly associated with LB in mothers in regression models, controlling for total energy intake and misreporting. In daughters, only sugar from candies/chocolates (β = 0.15, P = 0.039) was related to LB counts, while no significant associations were found among sons. A few low sugar-containing food groups were inversely related to LB counts: in mothers, energy from cooked meals (β = −0.16, P = 0.004) and fast food (β = −0.16, P = 0.025) and in daughters, cooked meals (β = −0.19, P = 0.026).
In the final multiple regression model, a high BMI and a low energy intake from cooked meals and fast food predicted LB counts in mothers (Table 5). The model explained 7.6% of the variance in LB counts. In daughters, sugar intake from candies/chocolates was independently associated with LB counts (explained variance 3.4%), whereas in sons, none of the included variables were independently associated with LB counts (explained variance 2.3%).
Table 5 Combined linear regression model including different variables affecting LB counts

LB – lactobacilli; BMI – body mass index; CFU – colony-forming units.
Discussion
In this study, we have found significant associations between BMI and salivary bacteria counts but not between reported sugar intake and BMI. This suggests that overweight and obese subjects have a higher relative sugar intake than leaner individuals, although this is not detected using a self-reported dietary information. We have also explored the properties of the link between bacteria counts and reported sugar intake and found associations between the bacteria and some dietary parameters involving sugar intake. The strongest explaining variable for the variation of bacteria prevalence in mothers was BMI. In girls, weak associations between food items such as sweets, beverages and fruit were found, while in boys the only association found was with the maternal bacteria count. When excluding lactose from the analyses, the associations between the bacteria and sugar intake were strengthened among the daughters.
BMI is an interesting parameter since it, together with bacteria counts, is objective, in contrast to dietary variables. Even if an overweight person does not have a specific sugar-based over-consumption, overweight people generally have a higher mean total energy demand compared to normal-weight peopleReference Prentice, Black, Coward, Davies, Goldberg and Murgatroyd27, Reference Prentice, Black, Coward and Cole28, and by just generally eating more than lean people they would have a higher sugar intake. If that is the case, a positive relationship between absolute intake of sugar and BMI would be expected. In this study, we do not have access to the true sugar intake but we have two possible substitutes; reported sugar intake and salivary bacteria counts. The fact that sugar intake, measured as bacteria counts, adjusted for total energy intake, was significantly associated with BMI in mothers suggests that overweight women also have a higher relative intake of sugar than leaner individuals. This is an unusual finding, since many previous cross-sectional studies have found negative associations between sugar intake and BMIReference Bolton-Smith and Woodward29, Reference Gibson30.
Only three studies have been published earlier where the relationship between salivary bacteria counts and BMI have been analysedReference Barkeling, Andersson, Lindroos, Birkhed and Rössner31–Reference Andréen and Kohler33. They all found significant associations between bacteria levels and BMI, even though not in all separate analyses. In two studiesReference Barkeling, Andersson, Lindroos, Birkhed and Rössner31, Reference Barkeling, Linné, Lindroos, Birkhed, Rooth and Rössner32, diet was also assessed and, like in the present study, neither of these studies found a relationship between reported sugar and BMI. Why bacteria levels are associated with BMI but not reported sugar intake could have several explanations. One possibility is that bacteria counts, in spite of the results from a number of experimental studiesReference Wennerholm, Birkhed and Emilson34–Reference Karjalainen, Karjalainen and Soderling39, measure something else than sugar intake. Another possible explanation is that reported dietary intake is distorted by obesity-specific under-reporting of sugar and that true associations between sugar intake and BMI therefore are masked by the reporting error. The negative correlation between BMI and reported sugar found in the unadjusted analysis in this study is an example of possible selective under-reporting of sugar among overweight subjects. Perhaps sugar is more linked to overweight than we are aware of. A third explanation could be that it is only a certain sugar-eating pattern, for example nibbling, that leads to both caries and overweight. A pattern where sugar is eaten less frequently is not considered as a risk behaviour for cariesReference Birkhed40, and perhaps it is not a risk behaviour for excessive energy intake and weight gain either.
The largest contribution to the total intake of sugar, especially in the children, came from beverages. This is consistent with many recent studies where the alarming increase in liquid calories has been brought to attentionReference Ludwig, Peterson and Gortmaker4, Reference Nicklas, Yang, Baranowski, Zakeri and Berenson41. Since a liquid is present in the mouth for a very short time before swallowing, it is surprising that it could affect the bacteria counts at all, but apparently, the intake of sugary drinks here was large enough to cause an increase of MS in girls.
Boys had no significant relationship between bacteria counts and their diet. It is possible that adolescent boys eat sugar in a different pattern than girls and women do, consistent with a much higher energy intake. It could be a pattern where sugar-containing food items are combined into more substantial meals without affecting caries-developing mechanisms like constant nibbling would. Another likely explanation is that these boys were not as good reporters of their dietary intake as the girls were. Our impression during the study was that the boys had less endurance and less interest in filling of all questionnaires correctly than the girls. Reporting error may be larger among the boys than the girls, but the mean intake of different sugar sources was similar, suggesting that we cannot dismiss the boys completely.
The negative relationship between bacteria counts and energy from cooked meals and fast food is expected, as an eating pattern with regular meals usually leads to fewer snacking occasions, and hence a smaller sugar intakeReference Sjöberg, Hallberg, Höglund and Hulthén42, Reference Matthys, De Henauw, Devos and De Backer43. The positive relationship between light meals and MS counts in daughters on the other hand is more interesting. A frequent intake of light meals seems to mirror a certain eating pattern in young girls involving a high sugar intake. Some correlations between light meals and high-sugar food groups were also found which might support this hypothesis.
In mothers, but not in children, sugar from milk (lactose) was an important explanatory factor for MS counts. If lactose has a different impact on the bacteria in older individuals, or if milk is a marker for a different eating behaviour in mothers than in children, we do not know. This is an unexpected result, since milk is not considered to be cariogenic due to low acidogenic potential of lactose combined with caries-protective factors in the milkReference Zero44.
Oral bacteria colonisations are transmitted from mother to child in early childhoodReference Lindquist and Emilson45–Reference Caufield, Cutter and Dasanayake47, but we do not know to what extent this has any effect at the age of 17. We did find a concordance in the prevalence of MS, but not in LB, between mother and son, but we cannot distinguish bacterial transmission from genetic predisposition and, most importantly, from inherited eating habits. There are general differences in eating habits between men and womenReference Westenhoefer48, and it is therefore expected that daughters have more similar eating habits to their mothers than do sons. Unpublished results among these subjects have shown larger similarities in eating habits between mothers and daughters than between mothers and sons. Nevertheless, bacteria counts of sons and mothers were more closely related, something hard to find a scientific explanation for.
The two types of bacteria strains showed different patterns in their associations with different sugar sources. Associations also differed between mothers and children. The bacteria patterns in mothers were not concordant with the patterns of the children, and it is difficult to explain why. The most striking asymmetry was in the association between milk sugar and MS counts. A possible explanation is that different eating habits are reflected in these different results, but it is difficult to draw any conclusions. Previous results from caries research have also found different patterns between the two bacteria strainsReference Aranibar Quiroz, Lingström and Birkhed36, Reference Karjalainen, Karjalainen and Soderling39, Reference Twetman, Aronsson and Bjorkman49, Reference Twetman, Nederfors, Stahl and Aronsson50, but there are no convincing theories regarding the cause for these differences. Until we have more detailed knowledge about the two bacteria it is important to always use them together for enabling the possibility to capture more aspects of the true sugar intake. It also has to be remembered that there are factors other than the diet that influence the salivary counts of MS and LB, like the presence of caries lesions, detention sites and oral hygieneReference Van Houte51.
The associations between reported sugar intake and bacteria counts in this study are very weak. Whether the relationships really are this weak, or whether our dietary data are too poor, we cannot say. The present study is limited by its cross-sectional design and self-reported data and cannot tell us anything about the causal link between bacteria and sugar intake. Nevertheless, it has shown that salivary bacteria counts, a simple and non-expensive method, have a relationship with reported sugar intake. For making more conclusions and to find more substantial evidence, experimental studies of high quality are required where the dietary intake is supervised and all possible confounders are considered.
To conclude, salivary bacteria counts had a positive correlation with BMI in both mothers (MS and LB) and in children (MS). This could imply a higher relative intake of sugar among individuals with a higher BMI compared to leaner individuals. The self-reported sugar intake, however, was not related to BMI. Nevertheless, some concordance between reported sugar intake and salivary bacteria was found; the intake of some sugar-containing foods, such as candies, beverages and fruits in daughters and milk in mothers were significantly associated with MS counts. In sons, the only independent predictor for MS counts was maternal MS counts.
Acknowledgments
Sources of funding: The data collection phase of this study was funded by the European Commission, Quality of Life and Management of Living Resources, Key action 1 ‘Food, nutrition and health’ programme as part of the project entitled ‘Dietary and genetic influences on susceptibility or resistance to weight gain on a high fat diet’ (QLK1-2000-00515).
Conflict of interest declaration : There are no conflicts of interest.
Authorship contributions: All authors have contributed to this paper by drafting or revising this paper and given final approval of the version to be published. K.V., A.K.L. and D.B. have also contributed with analysis and interpretation of data and Y.L. with the conception and design.


