


As the population in the USA continues to age, the health and well-being of the elderly is becoming a large social and economic concern. Diet is a key component in the prevention and treatment of multiple chronic diseases including heart disease, diabetes, cancer and osteoporosis (http://fnic.nal.usda.gov/nal_display/index.php?info_center = 4&tax_level = 1&tax_subject = 278). Currently, our understanding of the diets of older US men comes primarily from nationwide surveys such as NHANES (National Health and Nutrition Examination Survey) and a limited number of smaller, population-based studiesReference Anderson, Suchindran, Kritchevsky and Barrett-Connor1–Reference Radimer, Bindewald, Hughes, Ervin, Swanson and Picciano5. While there has been some work describing dietary patterns among older menReference Drewnowski, Henderson, Driscoll and Rolls6–Reference Haveman-Nies, Tucker, de Groot, Wilson and van Staveren10, there is little published work describing demographic or social factors that may predict dietary patterns.
In a recent study of older adults (aged 55–74 years) in Quebec, Shatenstein et al. reported that approximately half of the 460 men and women interviewed showed inadequate diet diversity and consumed less than the recommended servings of specified foods, including grain products, fruit and vegetables, milk products and meats or meat alternativesReference Shatenstein, Nadon and Ferland11. In another study of 179 older, rural Pennsylvanians (107 men), being male was statistically significantly associated with falling into the ‘low-nutrient-dense’ (defined as higher intakes of foods from the breads and fats, oils and sweets groups) dietary pattern clusterReference Ledikwe, Smiciklas-Wright, Mitchell, Miller and Jensen12. Haveman-Nies et al. evaluated diet quality in elderly Europeans and Americans, and reported that higher diet quality was related to non-smoking, less body fat and more physical activityReference Haveman-Nies, Tucker, de Groot, Wilson and van Staveren10. Based on the limited research available, older men may be at increased risk of poor dietary intake, placing them at increased risk for chronic disease. We propose that an understanding of diet and factors that influence intake among a large, diverse group of older US men may help guide the need for targeted intervention programmes, and could provide a baseline assessment from which to determine future chronic disease risk potential based on dietary patterns. Here, we present our analyses of the diet quality of Osteoporotic Fractures in Men (MrOS) cohort participants aged ≥ 65 years and evaluate how specific demographic characteristics may be associated with diet quality.
Methods
Study participants
The design and aims of the MrOS study have been described elsewhereReference Orwoll, Blank, Barrett-Connor, Cauley, Cummings and Ensrud13. Briefly, the MrOS cohort consists of 5995 community-dwelling, US men aged ≥ 65 years recruited between March 2000 and April 2002. The goal of the study is to quantify risk factors for fracture among older men. Participants were recruited primarily through mass mailings in six geographic regions of the USA: Birmingham, AL; Minneapolis, MN; Palo Alto, CA; Pittsburgh, PA; Portland, OR; and San Diego, CA. Eligibility criteria were: (1) ability to walk without the assistance of another; (2) no history of bilateral hip replacement; (3) ability to provide self-reported data; (4) anticipated residence near a study site for the duration of follow-up; (5) absence of a medical condition that would result in imminent death; and (6) ability to understand and sign an informed consent. The Institutional Review Board at each recruitment site approved the study protocol, and written informed consent was obtained from all participants.
Nutrition assessment
We obtained information about the participants' typical diet using a self-administered, reduced length version of the Block 98 food-frequency questionnaire (FFQ). Participants were mailed the questionnaire to complete prior to their clinic visit. At the clinic visit, questionnaires were reviewed by clinic staff to ensure completeness. The reduced length version of the Block 98 semi-quantitative questionnaire used for this study was developed through an in-depth analysis of the NHANES III data to identify foods most commonly consumed by men of a similar age, geographic and racial distribution as those in the MrOS cohort. Specific attention was paid to capturing intake of nutrients of interest to the MrOS study questions, including calcium, vitamin D and other selected nutrients that may influence risk of osteoporosis or prostate cancer in US men. The questionnaire included 69 individual food item questions and 14 items assessing nutritional supplement use. An additional 13 questions about food preparation and low-fat foods were asked and used to refine nutrient calculations. This specific reduced length version of the Block 98 FFQ did not undergo validation, though it is similar to other previously validated reduced length questionnaires produced by the Block groupReference Block, Hartman and Naughton14. Individual nutrient intake was determined by the Block group using a database based on the USDA Database for Standard Reference for Version 12, and the 1994–1996 CSFII database. Algorithms for FFQ nutrient analyses are described in detail elsewhere (http://www.nutritionquest.com/B98_Dev.pdf). Food nutrient values were calculated separately from supplement nutrient values. Servings of food groups were calculated through creating groupings of all foods that contribute to approximately one serving (in gram weight) of a food group, using the 1992 Food Pyramid recommended serving sizes (e.g. cheeses − 42 g). The total grams of food consumed as part of each group was determined and then divided by the gram weight of a single serving size for that group.
To assess overall diet quality, a Diet Quality Index (DQI) score was calculated based on work by Haines et al. Reference Haines, Siega-Riz and Popkin15. The DQI was originally developed as a composite or combined measure of diet quality based on global dietary recommendations from the Committee on Diet and Health of the National Research Council Food and Nutrition Board. The DQI published in 1994Reference Patterson, Haines and Popkin16 was revised (DQI-R) in 1999Reference Haines, Siega-Riz and Popkin15 to incorporate dietary recommendations from the US Department of Agriculture's 1992 Food Guide Pyramid, and the dietary reference intakes17. We further modified the DQI-R to incorporate the 2001 dietary reference intakes for iron18. Additional changes were made to the added-sugars component of the dietary moderation score. As shown in Table 1, the modified DQI-R consists of 10 components, each contributing 10 points to an overall diet quality score ranging from 0 to 100. The 10 components were selected by Haines et al. to represent the recommended fat composition of the diet (total fat, saturated fat and cholesterol); diet proportionality, e.g. the differences in consumption of fruits, vegetables and grains as compared with the 1992 Food Pyramid recommendations; diet moderation, e.g. limiting use of added fats, sodium and sugar; and diet diversity, e.g. consuming a range of foods within food categoriesReference Haines, Siega-Riz and Popkin15. In applying the DQI-R to the MrOS data, we attempted to mirror the published scale to the extent possible, with the exception of the source of the iron value and modifying the method for calculating sweets. See Haines et al. for a complete discussion of the DQI-R scoring proceduresReference Haines, Siega-Riz and Popkin15.
Table 1 Modified Diet Quality Index-Revised (DQI-R)15

* Based on 1992 Food Guide Pyramid recommendations.
† Based on 1997 dietary reference intakes – adequate intake for calcium.
‡ Based on 2001 dietary reference intakes – recommended dietary allowance for iron.
§ Changed from original DQI-R added-sugar category to a sugary foods category.
The modified DQI-R score is calculated by summing the resulting scores from each of the 10 categories. The continuous categories (fruits, vegetables, grains, iron and calcium) allow for values to be >100% if a person consumes more than the recommended intake. As with the original DQI-R, these individuals are considered as having met the recommended intake and for calculation purposes are considered to have a score of 100%.
Other measurements
At enrolment, participants also completed a detailed self-administered questionnaire and were interviewed by trained and certified clinical staff regarding demographic characteristics, lifestyle factors, medical history, medication use, activities of daily living and a host of other items pertaining to fracture risk assessmentReference Orwoll, Blank, Barrett-Connor, Cauley, Cummings and Ensrud13. Relevant to this analysis were items regarding age, race and ethnicity, marital status, education level, smoking status, physical activity, self-rated health and vitamin supplement use. Weight and height were measured at the baseline clinic visit using a standardised protocol, and body mass index (BMI) was calculated as weight in kilograms divided by the square of height in metres. Physical activity was determined using the previously validated Physical Activity Scale for the Elderly (PASE)Reference Washburn, McAuley, Katula, Mihalko and Boileau19. We hypothesised that geographic location, age, race/ethnicity, self-perceived health and marital status would directly influence dietary intake and quality. We chose education level as a marker of socio-economic position and exposure to healthy eating messages, whereas current smoking status, physical activity, BMI and supplement use were chosen as markers of a healthy lifestyle.
Data analysis
Frequencies and means were used to describe variation in demographic factors by study site. DQI scores are presented as a continuous variable and as categories of the DQI scores. Variation in mean intake of each of the individual DQI components was analysed by DQI category. Variation in mean DQI (standard deviation (SD)) scores by each of the demographic characteristics is presented with the P-value for the univariate associations with diet quality. Multiple linear regression was performed to evaluate the multivariate relationships between the sociodemographic variables and DQI scores. All potential predictor variables that were statistically significant at a P-value < 0.05 in the univariate analyses were entered into the multivariate model. Estimated total calorie intake was included in the final model in an effort to account for potential reporting error. Given the lack of a strong theoretical or biological rationale for a hierarchical entering of predictor variables into the model, we chose to use an a priori (forced) model as opposed to a stepwise model. A type I error of < 0.05 was considered statistically significant for all tests. All statistical analyses were performed using the SAS/PC program, version 9.1 (SAS Institute, Inc.).
Of the full 5995 participants, 19 refused to complete the FFQ and 21 were excluded from the analyses due to >10% missing data on the FFQ. An additional 27 men were excluded from the analysis data set due to implausibly low reported calorie intake ( < 400 kcal day− 1, no maximum caloric intake was set), leaving a final data set of 5928 participants aged 65–100 years for these analyses.
Results
As shown in Table 2, nearly half of the men were overweight (BMI >25 to ≤ 30 kg m-2), but levels of obesity (BMI >30 kg m-2) varied between sites, ranging from 12% in Palo Alto to 28% in Pittsburgh. Although most MrOS participants self-identified as white, there was significant variation between sites, with Birmingham having the largest proportion of African-American men (almost 10%). The majority of men were relatively well educated (53.2% completed college), perceived themselves to be in good to excellent health (85.8%), were married (82.4%) and reported using an individual or multivitamin supplement (74.9%); supplement use was most common in the West Coast sites.
Table 2 Frequency of baseline demographic variables in the MrOS cohort (n=5928)
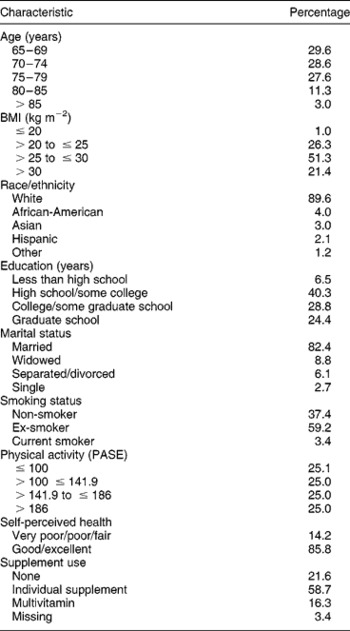
BMI – body mass index; PASE – Physical Activity Scale for the Elderly.
Modified DQI-R scores were calculated for each individual. Higher scores represent a higher quality diet; out of a possible 100 points, scores ranged from 20.4 to 91.4, with a median score of 63.1 and an overall mean (SD) DQI-R for the entire cohort of 62.5 (13.1). Table 3 shows the mean values for each component of the DQI-R by DQI-R score group, ranging from < 40 to >80. The mean value of each component increased or decreased in the expected direction based on the scoring algorithm, with the exception of the diet moderation score. For example, those with a DQI-R >80 had the lowest intake of fats, total and saturated fat, and cholesterol, and the highest intake of fruits, vegetables, grains, calcium and iron, whereas the diet moderation score was almost the same for each group. Table 3 also shows total mean intakes for the cohort. The mean daily intake of fat was 36.5% of calories, higher than the recommended intake (30% of calories), but mean intake of saturated fat, 11% of calories, was close to the recommended 10%. The average percentage of recommended servings of fruits consumed per day was just over 70%, indicating that on average the MrOS participants ate (depending upon total calorie intake), nearly two or nearly three servings of fruit per day. On average, men ate 93.1% of the recommended 4–5 servings of vegetables per day; but the men consumed only just over half (58%) of the recommended 6–9 servings of grain products per day. The mean intake of calcium was approximately two-thirds of the recommended adequate intake. In contrast, on average, men consumed one and a half times the recommended dietary allowance of iron. Finally, the diets of these men were not highly diverse, with a mean diet diversity score of 3.1 out of a possible 10. Men demonstrated some degree of moderation in their choices for discretionary items such as alcohol consumption, use of added fat or intake of sugary snacks (mean diet moderation score = 4.9 out of a possible 10).
Table 3 Mean intake/score for each dietary component by the modified Diet Quality Index-Revised (DQI-R) score category among 5928 men ≥65 years of age

SD – standard deviation.
Table 3 also shows the mean intake of several other dietary components not included in the calculation of the DQI-R. Mean caloric intake was highest among men in the highest DQI-R category. However, a larger percentage of these calories came from carbohydrates and proteins and a smaller percentage from sweets, compared with men in the lower DQI-R categories. Additionally, intake of monounsaturated and polyunsaturated fats as a percentage of total fat increased with improving DQI-R score.
In univariate analyses, variation in mean modified DQI-R was significantly associated with age, BMI, total calorie intake, education, marital status, study site, smoking status, supplement use and self-reported health status (Table 4). Modified DQI-R scores were directly related to age and education, such that men in the oldest age group (>80 years old), and those with higher attained education had the highest mean DQI-R scores. As expected, DQI-R scores were inversely related to body size (higher BMI = lower DQI-R) and, with the exception of those with the very lowest caloric intake, were inversely related to total calories such that men with the highest caloric intake had a lower mean modified DQI-R score. Modified DQI-R scores were lower among separated or divorced men, and mean modified DQI-R scores for Asians and whites were higher than those of African-Americans and Hispanics. The California sites (Palo Alto (65.4) and San Diego (63.8)) had the highest mean modified DQI-R scores, while Birmingham had the lowest (59.7). Smokers had a significantly lower modified DQI-R than either never or ex-smokers.
Table 4 Mean modified Diet Quality Index-Revised (DQI-R) scores and regression analyses for a univariate and multivariate model by selected demographic characteristics of 5928 men ≥65 years of age

BMI – body mass index; PASE – Physical Activity Scale for the Elderly.
* Data were missing for one individual for smoking, three individuals for physical activity and two for self-reported health status.
To determine the extent to which each characteristic independently explained variation in the modified DQI-R, all variables were entered simultaneously in a multivariate model. Age, BMI, total calorie intake, education, race/ethnicity, study site, smoking status and supplement use were each independent predictors of modified DQI-R score (Table 4). Marital status, physical activity and self-perceived health status were not independent predictors of modified DQI-R in the multivariate model. The multivariate model explained 15% of the variation in modified DQI-R scores; the P-values associated with each characteristic are shown in Table 4. None of these characteristics showed a correlation of >0.17, indicating that collinearity does not preclude their being considered together in a single model.
Discussion
This cross-sectional analysis provides a description of the dietary intake and adequacy in a community-based sample of older US men. Further, these results provide some insight into sociodemographic factors that may play an important role in predicting diet quality. Our results suggest that even among a self-selected group of healthy older men, overall diet quality remains a concern, with a mean modified DQI-R for the entire study population of 62.5 (13.1) out of an ideal of 100. In this cohort, younger age, very low total calorie intake ( ≤ 1187 kcal day− 1), higher BMI, residence in a North or Southeast community, being of African-American or Hispanic race, being less educated, not using dietary supplements and smoking were each significant independent predictors of a poorer diet.
Other researchers have reported the diet quality of a particular population using the DQI or other similar index of diet qualityReference Newby, Hu, Rimm, Smith-Warner, Feskanich and Sampson8, Reference Seymour, Calle, Flagg, Coates, Ford and Thun9, Reference Pennington and Schoen20, but few have considered the potential association between diet quality and sociodemographic characteristicsReference Ledikwe, Smiciklas-Wright, Mitchell, Miller and Jensen12Reference Davis, Murphy, Neuhaus and Lein21–Reference Clausen, Charlton, Gobotswang and Holmboe-Ottesen23. In a survey-based study of 460 Quebecers aged 55–74 (47% male), fewer than half of the men were considered to have adequate diet diversity, suggesting lower than recommended intake of several food groupsReference Shatenstein, Nadon and Ferland24. In a later paper, this group reported that eating breakfast, consumption of prepared meals and social support were positive predictors of diet diversityReference Drewnowski, Henderson, Driscoll and Rolls6. Two or fewer meals per day and smoking were predictors of a lower diet adequacy score. Use of nutrient supplements was a significant predictor of both poor diet diversity and poor diet adequacy. Our data support the negative association between smoking and diet quality, but show a positive association between any supplement use and diet quality. Thus, it appears that supplements in the Quebec population may have been used to improve poor diet, while in the US cohort, supplement use may reflect greater health consciousness. We did not assess the number of meals per day.
A similar assessment of diet quality and predictors of diet quality was performed using household survey data from 1085 adults in Botswana aged 60 years and older. Similar to the MrOS results, older adults in Botswana had significantly higher food variety scores if they were married, more educated and reported good health. However, the oldest adults in the Botswana population ( ≥ 80 years) reported a significantly poorer food variety score than younger subjects, while in the MrOS population age was directly related to diet quality, with the oldest men ( ≥ 80 years) having the highest mean modified DQI-R score. In a British population, Pryer et al. used cluster analysis to identify four eating patterns in 1197 men and womenReference Pryer, Nichols, Elliott, Thakrar, Brunner and Marmot22. Although these results from a cluster analysis are not directly comparable with those from the DQI, there were some similar findings among men in the ‘healthier diet’ cluster and men with a higher DQI-R score. Specifically, among the 1087 men surveyed, significantly higher proportions of men in the ‘healthier diet’ cluster (characterised by higher intake of whole grains, fish and shellfish, and fruits/ nuts) were from non-manual social classes and were non-smokers.
While few studies have investigated variations in diet quality by geographic location within the USA, Haveman-Nies et al. reported on differences in diet quality, as assessed using three different measures, in two European cohorts and one from the USA (Framingham)Reference Haveman-Nies, Tucker, de Groot, Wilson and van Staveren10. Diet quality differed by geographic location, with individuals from Framingham in the northern USA and individuals from Southern Europe having a diet profile high in complex carbohydrate and low in saturated fat, while individuals from Northern Europe were characterised by a dietary profile low in complex carbohydrate and high in saturated fat. Interestingly, these differences are not dissimilar from the diet quality differences we report between Eastern and Western sites in MrOS.
Finally, to investigate how education (as a marker for socio-economic status) may modify the effect of the other demographic variables, we stratified our analyses by education. With the exception of BMI, the direction and magnitude of the associations between each demographic variable and DQI score remained the same within each quartile of education. However, as shown in Fig. 1, among men with the lowest BMI, the relationship between BMI and DQI in the lowest categories of education differs from those with higher levels of education. This may reflect different reasons for the lower BMI, with the men with the lowest education having a lower BMI due to issues of inadequate access to food, while men with higher education have a lower BMI due to better food choices. While others have reported a similar independent association between education and diet quality and BMI and diet qualityReference Pryer, Nichols, Elliott, Thakrar, Brunner and Marmot22, Reference Reedy, Haines and Campbell25, we are not aware of any analyses that have reported the variations in this association with stratification. However, these results must be viewed cautiously as the number of men in our lowest BMI category is small (n = 59).

Fig. 1 Variations in mean modified Diet Quality Index-Revised (DQI-R) by body mass index (BMI), stratified by education, in 5928 men aged ≥ 65 years
To our knowledge, this is one of a handful of studies of diet quality in older adults that have been able to address the potential effect of race or ethnicity and geographic region of residence effectively, and the only one that measured dietary intake in all geographic regions during the same time period with the same assessment instrument. Ethnicity, as a marker of cultural beliefs and heredity, is commonly suggested as a predictor of dietary intake. In our univariate analyses, ethnic origin was not a significant predictor of diet quality. However, when adjusted for geographic location (site) and other characteristics in the multivariate model, race/ethnicity became a significant predictor, with Asian-Americans having the highest modified DQI-R score and African-Americans the lowest. It must be noted though, that the small number of MrOS participants in non-Caucasian ethnic groups is likely to have limited our ability to identify small but potentially important associations.
Another limitation of this study may be the modified DQI-R itself. We chose to modify an existing diet index for application to our particular population. While a strength of this decision is that the predictive properties of the DQI-R have been well described, there are several concerns. First, this tool was not developed specifically for elderly men; rather it was developed to reflect dietary guidelines for the general US population. Secondly, the DQI-R was developed using two 24-hour recalls, while our dietary assessment method was an FFQ, leading to the need to modify the calculation of the dietary moderation scale. Because our FFQ did not include some of the specific diet moderation items, e.g. use of added sugar, it was necessary to impute new values for these behaviours based on actual intake. This imputation may explain the rather low and ‘invariable’ dietary moderation scores in our population. However, Newby et al. Reference Newby, Hu, Rimm, Smith-Warner, Feskanich and Sampson8 recently evaluated the reliability and validity of the DQI-R as assessed using an FFQ, and reported that DQI-R scores determined using an FFQ correlated well with those produced using a diet record, and the DQI-R scores from the FFQ were significantly correlated with several biomarkers of nutrient intake, supporting the FFQ-based DQI-R as a valid assessment of intakeReference Newby, Hu, Rimm, Smith-Warner, Feskanich and Sampson8. An advantage of the DQI-R is that the components are easily understood by the general population, and reflected the 1992 Food Guide Pyramid.
The assessment of diet quality is directly influenced by the limitations of the initial dietary assessment tool. Dietary intake in the MrOS population was assessed using a relatively short FFQ, thus, we may be underestimating diet diversity, particularly among men who consume ethnic or less common foods. One effect of this underestimation may be a skewing of the diet diversity score to the left, as is seen in Table 3, where even among the men with a modified DQI-R of ≥ 80, the mean diet diversity score was 5.0 out of a possible 10 points.
The primary goal of this analysis was to provide information about the need for interventions to improve poor diets, and to define the target population characteristics. Because this is a cross-sectional study, we cannot assess the temporality between the DQI and disease. Associations between the DQI-R score and disease outcomes have been studied by two groups, with inconclusive resultsReference Seymour, Calle, Flagg, Coates, Ford and Thun9, Reference Fung, McCullough, Newby, Manson, Meigs and Rifai26. Others have associated disease risk with other markers of diet quality such as the Health Eating IndexReference McCullough, Feskanich, Rimm, Giovannucci, Ascherio and Variyam27–Reference McCullough, Feskanich, Stampfer, Rosner, Hu and Hunter29. We plan to study diet–disease association when the MrOS cohort has been followed for longer.
Conclusion and application
In the USA, as in most of the world, the proportion of the population aged ≥ 65 years is increasing. With ageing, individuals are at increased risk of developing chronic diseases commonly associated with poor quality or excess quantity diets. Yet, targeting dietary interventions to a particular group at greatest risk is difficult, as the presence of many of these factors is not easily determined at a population level. In the analyses presented, we chose several easily obtained characteristics that could be used to target interventions toward particular groups who appear to have particularly poor diet quality. Our results suggesting that there is a nearly 40% prevalence of poor diet even in self-selected healthy volunteers could provide some guidance on characteristics that identify men at high risk.
Acknowledgements
The Osteoporotic Fractures in Men (MrOS) study is supported by National Institutes of Health funding. The following institutes provide support: the National Institute of Arthritis and Musculoskeletal and Skin Diseases (NIAMS), the National Institute on Aging (NIA) and the National Cancer Institute (NCI), under the following grant numbers: U01 AR45580, U01 AR45614, U01 AR45632, U01 AR45647, U01 AR45654, U01 AR45583, U01 AG18197 and M01 RR000334


