


Energy balance is in part controlled by a complex interplay involving hypothalamic expression of neuropeptides and peripheral hormones, such as leptin (LEP) and glucocorticoids (corticosterone in rodents and cortisol in humans)( Reference Jequier 1 , Reference Gyengesi, Liu and D'Agostino 2 ). A dysregulation of energy balance-related mechanisms leads to a sustained positive energy balance and build-up of energy reserves in the form of TAG, which is first deposited in adipose tissues and then ectopically in other tissues, resulting in the obese phenotype( Reference Arner, Bernard and Salehpour 3 ). As obesity has become an ever-increasing health concern due to its prevalence and associated clinical conditions, such as non-alcoholic fatty liver disease and type 2 diabetes mellitus, efforts to identify dietary solutions for this plight have intensified.
One area of research that has shown promise in the management of obesity through increased satiety and lipid metabolism in humans and mice involves modulation of the source of dietary protein, for example the use of dietary whey protein isolate (WPI), as well as its component proteins, such as lactoferrin, α-lactalbumin, glycomacropeptide and β-lactoglobulin( Reference Krissansen 4 – Reference Pal, Ellis and Dhaliwal 7 ). For instance, intake of enteric-coated lactoferrin reduces body weight and visceral fat mass in humans compared with intake of placebo tablets( Reference Ono, Murakoshi and Suzuki 8 ). Similarly, obese mice after a period of energy restriction with a diet containing lactoferrin have been reported to show reduced fat mass compared with energy-restricted mice fed WPI( Reference Pilvi, Harala and Korpela 9 ). Similar data have been obtained from energy-restricted mice fed α-lactalbumin( Reference Pilvi, Harala and Korpela 9 ).
The present study focused on bovine serum albumin (BSA), which is a whey-associated protein. Albumin is a plasma protein involved in maintaining homeostatic colloidal pressure and also acts as a carrier protein for fatty acids, catecholamines and other hormones( Reference Danon and Sapira 10 , Reference Hankins 11 ). To the best of our knowledge, no previous studies have examined the effect of orally administered BSA as the primary source of dietary protein on energy balance or lipid accretion associated with diet-induced obesity; therefore, it is not known whether dietary BSA, similar to other whey proteins, could be used as a food ingredient to impede the development of obesity. Because of the lack of knowledge regarding dietary BSA, the present study focused on energy balance and hypothalamic mRNA levels in male C57/BL6J mice over a 13-week period similar to previous studies involving WPI( Reference McAllan, Keane and Schellekens 5 , Reference Tranberg, Hellgren and Lykkesfeldt 12 ). Likewise, it was unknown whether there would be an impact of dietary BSA on lipid accretion, so subcutaneous and epididymal fat pads were collected from the aforementioned mice and examined for alterations in the mRNA levels of genes involved in lipid catabolism and anabolism, taking into account that a previous study involving dietary WPI, of which BSA is a component, showed a differential impact on subcutaneous and epididymal adipose tissues (EAT) following a 14-week high-fat dietary challenge( Reference Tranberg, Hellgren and Lykkesfeldt 12 ).
Materials and methods
Animals and diets
The use and care of animals adhered to the licence obtained under the Cruelty to Animals Act 1876, and associated work received approval from the University College Cork Animal Ethics Committee (no. 2011/005). Mice had ad libitum access to fresh water and one of the following three diets (Research Diets, Inc.): low-fat diet (LFD) (10 % of energy from fat and 20 % of energy from casein; D12450B); HFD (45 % of energy from fat and 20 % of energy from casein; D12451); HFD+BSA (D1201180), in which casein in the HFD was replaced with 20 % of energy from BSA (Sigma-Aldrich). Further details of the diets, which are all open source, can be found in online Supplementary Table S1 and were obtained from Research Diets, Inc. The diets comprised 20 % dietary protein, because it fell within a normal physiological range (14–25 %) and was similar to the energy content found in previous studies involving dietary WPI( Reference McAllan, Keane and Schellekens 5 , Reference McAllan, Skuse and Cotter 6 ).
Experimental protocol
Male C57/BL6J mice (Harlan), aged 3–4 weeks, were group-housed in individually ventilated cages maintained at a 12 h light–12 h dark cycle, 20–22°C and 45–65 % humidity, and fed a LFD during the initial 5-week acclimatisation period. At 8 weeks of age, mice were switched to either the HFD or HFD+BSA diet, or maintained on the LFD (n 8) for a period of 13 weeks. Body weight and food intake were measured weekly. Energy intake (EI, in kJ) was calculated based on the energy content of the diets (high fat 1·022 kJ/g; low fat 0·92 kJ/g) multiplied by food intake (in g). Feed efficiency (body mass gain (g)/energy intake (MJ))( Reference Tastesen, Ronnevik and Borkowski 13 ) was calculated for the first 8 weeks of the trial before mice were placed in metabolism cages. During weeks 9–12, mice were individually housed in the TSE PhenoMaster™ System (TSE Systems) for 72 h. After the initial 48 h acclimatisation period, metabolic parameters were measured during the final 24 h period. CO2 production (VCO2) and oxygen consumption (VO2) were measured using indirect open-circuit calorimetry. These data allowed the calculation of the RER ( = VCO2/VO2). Locomotor activity was determined using a multi-dimensional IR beam system that measured the number of breaks along the X, Y and Z axes. All sensors recorded data for each mouse during a 60 s period at 9 min cycles. In week 12, faecal pellets were collected and stored at − 20°C. In week 13, after a 4–6 h fast, body composition was determined using a Bruker Minispec LF50H analyser (Bruker Optics). Mice were anaesthetised (65 mg/kg ketamine and 13 mg/kg xylazine), and blood was collected into Vacutainer EDTA tubes (Becton, Dickinson and Company) before being mixed with 500 000 KUI/l (17·5 mg/ml plasma) of aprotinin (Sigma-Aldrich) and 0·1 mm-diprotin A (Sigma-Aldrich) to protect hormones from proteolytic degradation. Mice were euthanised by cervical dislocation, and brain, posterior subcutaneous adipose tissue (SAT) and EAT were harvested, weighed and snap-frozen in liquid N2 or dry ice (brain) before being stored at − 80°C until analysis.
Gene expression
Total RNA was extracted from hypothalamic blocks and from the adipose tissue using the RNeasy Lipid Tissue Mini Kit (Qiagen). As a precaution against potential genomic DNA contamination, RNA was treated with RNase-Free DNase (Qiagen). RNA purity was determined by NanoDrop (Thermo Scientific), and all samples had 260/280 readings between 1·9 and 2·1. For the synthesis of complementary DNA, 1 μg of total RNA was used in transcription reactions containing 2·5 ng/μl of random hexamer primers (Bioline), 0·5 mm-deoxyribonucleic triphosphate (Promega), 2 U/μl of RNase inhibitor (Promega), and Superscript II (Life Technologies). Then, complementary DNA was amplified using the SYBR Green Select Master Mix (Life Technologies) with 0·25 μm-primers (MWG Operons) and 1 μl complementary DNA. Primer sequences are detailed in online Supplementary Table S2. DNA amplification was performed in a LightCycler 480 Real-Time PCR system (Roche) under the following conditions: 10 min at 95°C, fifty cycles of 95°C for 10 s, 55–60°C for 5 s, and 72°C for 15 s. The authenticity of PCR products was verified by melting curve analysis and sequencing (MWG Operons). In instances where two or more housekeeping genes were used, their geometric mean was determined for normalisation( Reference Vandesompele, De Preter and Pattyn 14 ). The following reference genes were used: RNA, 18S ribosomal 1 (RNA18S) and β-actin (ACTB) for both subcutaneous and EAT, and RNA18S and tyrosine 3-mono-oxygenase/tryptophan 5-mono-oxygenase activation protein, zeta polypeptide (YWHAZ) for the hypothalamus. Gene expression was determined using the ΔΔC T method relative to the LFD control group, and data were averaged per group( Reference Livak and Schmittgen 15 ).
Hormones and faecal fat
Plasma samples were measured in duplicate for the concentrations of corticosterone (catalogue no. ADI-900-097; Enzo Life Sciences), insulin (catalogue no. 90 080; Crystal Chem), glucose (catalogue no. 65 333; Abcam), NEFA (catalogue no. ab65341; Abcam) and LEP (catalogue no. 100-130-LEM; Alpha Diagnostics), according to the manufacturers' instructions. The percentage of faecal fat was determined in duplicate using a modified version of the Folch method based on previous published studies( Reference Chon, Douglass and Zhou 16 , Reference Newberry, Xie and Kennedy 17 ). Distilled water was added to thawed pellets (10 ml to 1 g) and allowed to rest at room temperature overnight. Then, chloroform and methanol in 2:1 (v/v) and 0·58 % (w/v) aqueous NaCl solutions were mixed with samples before centrifugation. The chloroform phase was transferred to fresh pre-weighed tubes and measured before evaporation. Finally, weights of the tubes were measured again to determine total lipid content in faecal mass.
Statistical analysis
Statistical comparisons of groups were performed using ANOVA in conjunction with a Tukey post hoc test with Prism (GraphPad Software, Inc.) and Minitab (Minitab, Inc.). VO2, plasma LEP and corticosterone data were analysed by ANCOVA (SAS software, version 9.3) using total body weight or percentage of fat mass as the covariant, as detailed previously( Reference Tschop, Speakman and Arch 18 ). Residual checks were made to ensure that the assumptions of the analysis (e.g. normality and constant variance) were met. Significance was established at P< 0·05. Data are presented as means with their standard errors.
Results
Dietary bovine serum albumin suppressed feed efficiency, weight gain and percentage of fat mass
Both body weight and weight gain were significantly increased in the HFD group compared with the LFD and HFD+BSA groups (Fig. 1(a) and 1(b)). Similarly, the LFD and HFD+BSA groups had a significantly higher percentage of lean mass and a correspondingly lower percentage of fat mass than the HFD group (Fig. 1(c)). During weeks 9–12, metabolic activity data showed that the HFD+BSA group exhibited significantly increased EI compared with the LFD group with no significant differences between the other two groups (Table 1) . However, over time, (cumulative) EI was greater in the HFD+BSA and HFD groups when compared with the LFD group, and was higher in the HFD+BSA group compared with the HFD group at week 8 (Fig. 1(d)). To examine this further, hypothalamic mRNA levels of genes associated with energy balance regulation were studied, and showed a significant increase in the hypothalamic mRNA levels of PPARα (PPARA) in both the HFD and HFD+BSA groups compared with the LFD group (P< 0·05; see online Supplementary Fig. S1(F)) with no change in the mRNA levels of other genes associated with energy balance regulation, specifically pro-opiomelanocortin (POMC), LEP receptor (OB-r) or neuropeptide Y (NPY) (see online Supplementary Fig. S1(A)–(C)). No changes in locomotor activity and water intake were found between the groups (Table 1), and the variation in the RER between HFD-fed mice and LFD-fed mice followed expected patterns for utilisation of dietary fat as the main energy source (Table 1). The analysis of VO2 data by ANCOVA, with body mass as the covariate, showed that the diets had no significant impact on this parameter (Table 1), with the variation in body weight associated with changes in VO2 (see online Supplementary Fig. S2). Faecal fat content in the HFD+BSA and LFD groups was significantly less than that in the HFD group (Table 1), and feed efficiency for the LFD and HFD+BSA groups was significantly less than that for the HFD group (Fig. 1(e)).
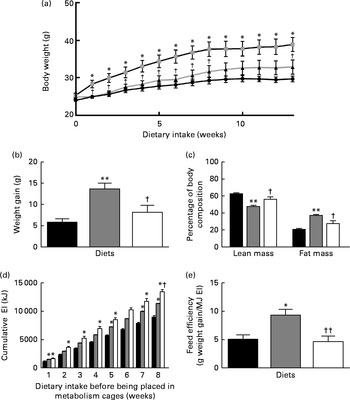
Fig. 1 Effect of dietary bovine serum albumin (BSA) on physiological parameters in C57/BL6J mice fed a high-fat diet. Data are shown for (a) body weight, (b) weight gain, (c) body composition over a period of 13 weeks, (d) cumulative energy intake (EI, kJ) up to week 8 and (e) feed efficiency for the first 8 weeks before mice were placed in metabolism cages. Values are means (n 8), with standard errors represented by vertical bars. Mean value was significantly different from that of the LFD group: * P< 0·05, ** P< 0·01. Mean value was significantly different from that of the HFD group: † P< 0·05, †† P< 0·01. LFD ((a) ![]() and (b)–(e)
and (b)–(e) ![]() ), 10 % of energy from the fat diet with 20 % of energy from casein; HFD ((a)
), 10 % of energy from the fat diet with 20 % of energy from casein; HFD ((a) ![]() and (b)–(e)
and (b)–(e) ![]() ), 45 % of energy from the fat diet with 20 % of energy from casein; HFD+BSA ((a)
), 45 % of energy from the fat diet with 20 % of energy from casein; HFD+BSA ((a) ![]() and (b)–(e)
and (b)–(e) ![]() ), 45 % of energy from the fat diet with 20 % of energy from BSA.
), 45 % of energy from the fat diet with 20 % of energy from BSA.
Table 1 Assessment of metabolic parameters over 24 h, hormones and metabolites, and adipose tissue mass in C57/BL6J mice fed dietary bovine serum albumin (BSA) in conjunction with a high-fat diet (Mean values with their standard errors; n 8)
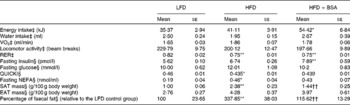
LFD, 10 % of energy from a fat diet with 20 % of energy from casein; HFD, 45 % of energy from a fat diet with 20 % of energy from casein; HFD+BSA, 45 % of energy from a fat diet with 20 % of energy from BSA; QUICKI, quantitative insulin sensitivity check index; SAT, subcutaneous adipose tissue; EAT, epididymal adipose tissue.
Mean value was significantly different from that of the LFD group: * P< 0·05, ** P< 0·01
Mean value was significantly different from that of the HFD group: †† P< 0·01.
‡ Metabolic activity data were collected during weeks 10–12 of a 13-week study using the TSE PhenoMaster™ System (TSE Systems), at 9 min intervals over a 24 h period.
§ Data were measured from samples collected at week 13 of the study.
Dietary bovine serum albumin normalised plasma leptin and corticosterone levels
Circulating LEP concentration was significantly higher in the HFD group than in the LFD group; however, LEP levels were normalised in the HFD+BSA group (Fig. 2(a)). There was a correlation between LEP level and percentage of fat mass (r 0·79, P< 0·0001; Fig. 2(b)); however, when the percentage of fat mass was used as a covariate in ANCOVA, no differences were found in LEP level between the groups (normalised data: 4·73 (se 1·68) for the LFD group, 9·12 (se 1·44) for the HFD group and 6·33 (se 1·15) for the HFD+BSA group), indicating that the effects observed for plasma LEP level were due to alterations in the percentage of fat mass, rather than to the dietary influence on LEP secretion. Plasma corticosterone levels were also normalised in the HFD+BSA group compared with the HFD group (Fig. 2(c)). In contrast to the dietary effect on LEP levels, when the strong correlation between percentage of fat mass and plasma corticosterone levels (r 0·72, P< 0·05; Fig. 2(d)) was further explored using ANCOVA with fat mass as a covariate, a significant difference was observed between the LFD and HFD groups (P< 0·05) and between the HFD+BSA and HFD groups (P< 0·01) (normalised data: 139·65 (se 36·02) for the LFD group, 299·03 (se 38·05) for the HFD group and 100·33 (se 28·17) for the HFD+BSA group). This indicates that reduced circulating corticosterone levels in the HFD+BSA group were not due to the reduced percentage of fat mass of this group, but rather to a direct effect of the diet on additional mechanisms involved. Hypothalamic mRNA levels of genes implicated in the production of corticosterone, namely corticotropin-releasing hormone (CRH) and arginine vasopressin receptor 1a (V1a), were not significantly altered when compared with the HFD group (see online Supplementary Fig. S1(D) and (E))
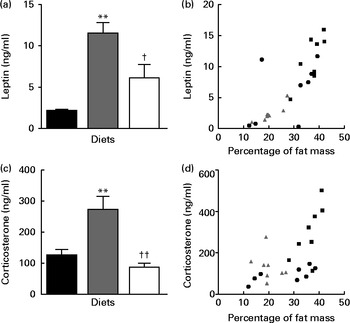
Fig. 2 Effect of dietary bovine serum albumin (BSA) on the levels of plasma hormones in C57/BL6J mice fed a high-fat diet. Data are shown for (a) plasma leptin level, (b) the correlation between leptin levels and percentage of fat mass (r 0·79, P< 0·0001), (c) plasma corticosterone level and (d) correlation between plasma corticosterone level and percentage of fat mass (r 0·72, P< 0·05). Values are means (n 8), with their standard errors represented by vertical bars. Mean value was significantly different from that of the LFD group: * P< 0·05, ** P< 0·01. Mean value was significantly different from that of the HFD group: † P< 0·05, †† P< 0·01. LFD ((a, c) ![]() and (b, d)
and (b, d) ![]() ), 10 % of energy from a fat diet with 20 % of energy from casein; HFD ((a, c)
), 10 % of energy from a fat diet with 20 % of energy from casein; HFD ((a, c) ![]() and (b, d)
and (b, d) ![]() ), 45 % of energy from a fat diet with 20 % of energy from casein; HFD+BSA ((a, c)
), 45 % of energy from a fat diet with 20 % of energy from casein; HFD+BSA ((a, c) ![]() and (b, d)
and (b, d) ![]() ), 45 % of energy from a fat diet with 20 % of energy from BSA.
), 45 % of energy from a fat diet with 20 % of energy from BSA.
Fasting plasma insulin levels in the HFD+BSA group were significantly increased compared with the LFD group (Table 1), while fasting plasma glucose levels remained unchanged between all the groups, and fasting NEFA levels were only significantly altered between the LFD and HFD groups (Table 1).
Dietary bovine serum albumin reduced subcutaneous fat mass and altered related gene expression
The present analysis showed that posterior SAT (inguinal fat pad) was significantly increased by HFD feeding and reduced by HFD+BSA intake (Table 1). Investigation of genes associated with β-oxidation revealed that SAT mRNA expression levels of PPARA had a strong inverse relationship with SAT mass (r − 0·75, P< 0·0001), so it was intriguing that HFD+BSA mice had elevated mRNA levels of PPARA in SAT compared with HFD mice (Fig. 3(a)). Similar negative associations between mRNA levels and SAT mass were observed for other genes involved in β-oxidation, namely carnitine palmitoyltransferase 1b (CPT1b) (r − 0·76, P< 0·001) and uncoupling protein 3 (UCP3)( Reference Himms-Hagen and Harper 19 ) (r − 0·69, P< 0·001), both of which were significantly increased in the SAT of the HFD+BSA group when compared with the HFD group (Fig. 3(b) and (c)). The mRNA expression level of LEP in SAT was significantly reduced in the HFD+BSA and LFD groups compared with the HFD group (Fig. 3(g)).
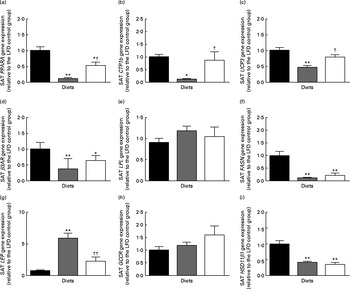
Fig. 3 Effect of dietary bovine serum albumin (BSA) on subcutaneous gene expression levels in C57/BL6J mice fed a high-fat diet. Housekeeping genes were β-actin (ACTB) and RNA, 18S ribosomal 1 (RNA18S). The genes examined were (a) PPARA, (b) carnitine palmitoyltransferase 1b (CTP1b), (c) uncoupling protein 3 (UCP3), (d) β-adrenergic receptor-3 (β3AR), (e) lipoprotein lipase (LPL), (f) fatty acid synthase (FASN), (g) leptin (LEP), (h) glucocorticoid receptor (GCCR) and 11β-hydroxysteroid dehydrogenase type 1 (HSD11β1). mRNA expression is shown relative to the LFD control group set at 1·00. Values are means (n 8), with their standard errors represented by vertical bars. Mean value was significantly different from that of the LFD group: * P< 0·05, ** P< 0·01. Mean value was significantly different from that of the HFD group: † P< 0·05, †† P< 0·01. LFD (![]() ), 10 % of energy from a fat diet with 20 % of energy from casein; HFD (
), 10 % of energy from a fat diet with 20 % of energy from casein; HFD (![]() ), 45 % of energy from a fat diet with 20 % of energy from casein; HFD+BSA (
), 45 % of energy from a fat diet with 20 % of energy from casein; HFD+BSA (![]() ), 45 % of energy from a fat diet with 20 % of energy from BSA. SAT, subcutaneous adipose tissue.
), 45 % of energy from a fat diet with 20 % of energy from BSA. SAT, subcutaneous adipose tissue.
There was no significant effect of dietary BSA on high-fat diet-associated mRNA levels for lipid catabolism-associated β-adrenergic receptor (β3AR) or lipid anabolism-associated lipoprotein lipase (LPL), fatty acid synthase (FASN), glucocorticoid receptor (GCCR) or 11β-hydroxysteroid dehydrogenase type 1 (HSD11β1) in SAT (Fig. 3 and ). There was also no significant alteration in the SAT mRNA levels of the adipogenic transcription factor PPARG (1·00 (se 0·09) for the LFD group, 0·88 (se 0·09) for the HFD group and 0·91 (se 0·14) for the HFD+BSA group).
Dietary bovine serum albumin moderately affected epididymal fat mass and related gene expression
The EAT of the HFD+BSA group was not significantly altered when compared with either of the control groups; however, an increased trend was observed in the HFD group compared with the LFD group after normalisation to body weight (P= 0·06; Table 1). While there was no difference between the groups in the mRNA levels of PPARA or UCP3 in EAT (Fig. 4(a) and (c)), the mRNA levels of CPT1b showed increased trends in the HFD+BSA group relative to the LFD (P= 0·094) and HFD (P= 0·061) groups (Fig. 4(b)).
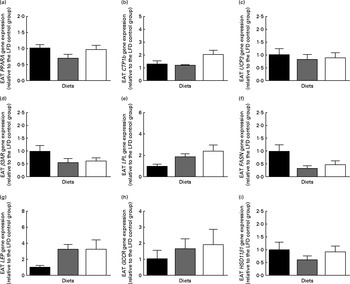
Fig. 4 Effect of dietary bovine serum albumin (BSA) on epididymal gene expression levels in C57/BL6J mice fed a high-fat diet. Housekeeping genes were β-actin (ACTB) and RNA, 18S ribosomal 1 (RNA18S). The genes examined were (a) PPARA, (b) carnitine palmitoyltransferase 1b (CTP1b), (c) uncoupling protein 3 (UCP3), (d) β-adrenergic receptor-3 (β3AR), (e) lipoprotein lipase (LPL), (f) fatty acid synthase (FASN), (g) leptin (LEP), (h) glucocorticoid receptor (GCCR) and 11β-hydroxysteroid dehydrogenase type 1 (HSD11β1). mRNA expression is shown relative to the LFD control group set at 1·00. Values are means (n 8), with their standard errors represented by vertical bars.
There were no significant high fat-related differences in the EAT mRNA levels of β3AR (Fig. 4(d)), FASN (Fig. 4(f)), LEP (Fig. 4(g)), HSD11β1 (Fig. 4(i)) or PPARG (1·00 (se 0·24) for the LFD group, 1·06 (se 0·21) for the HFD group and 1·31 (se 0·30) for the HFD+BSA group); however, when compared with the LFD group, the HFD+BSA group showed strong increased trends in the mRNA levels of LPL (P= 0·054; Fig. 4(e)) and GCCR (P= 0·054; Fig. 4(h)). There were also increased mRNA levels of fatty acid translocator (FAT/CD36) in the HFD+BSA group when compared with the LFD group (P< 0·05) (1·00 (se 0·29) for the LFD group, 3·83 (se 0·61) for the HFD group and 4·99 (se 1·34) for the HFD+BSA group). Consistent with the impact of glucocorticoids on EAT tissue lipid metabolism( Reference Peckett, Wright and Riddell 20 ), a strong association was observed when EAT mRNA levels of GCCR and LPL were compared (r 0·88, P< 0·001).
Discussion
The key finding of the present study was that dietary BSA specifically reduced SAT weight and plasma LEP and corticosterone levels, despite mice having a significantly higher cumulative EI, and unaffected energy expenditure, thereby indicating that dietary BSA has an effect on lipid metabolism in high fat-fed mice. This is further suggested by the significant increase in mRNA levels found in SAT for genes associated with β-oxidation, specifically PPARA, CPT1B and UCP3.
Mice fed a HFD+BSA diet had similar EI and metabolic activity during a 24 h period to that of the HFD control group; however, over time, their cumulative EI became higher than that for both LFD and HFD groups. Interestingly, the mRNA expression of PPARA was significantly higher in the hypothalamus of the HFD and HFD+BSA groups when compared with the LFD group. Recently, it has been shown that increasing PPARA levels in the brain of mice with inactivated pancreatic and hypothalamic FASN corrects for hypophagia found in these mice, and suggests that there is a specific hypothalamic FASN/PPARA sensory pathway that leads to increased EI( Reference Chakravarthy, Zhu and Lopez 21 ). Additionally, these FASN-inactivated mice, when given a high-fat diet, ate significantly less and expended significantly more energy as defined by VO2 than their wild-type counterparts( Reference Chakravarthy, Zhu and Yin 22 ), most probably due to a disruption in the FASN/PPARA signalling pathway. In the present study, whether the change in cumulative EI represents the activation of the aforementioned pathway or whether the mRNA expression levels of PPARA simply reflect a secondary consequence of the high-fat diet ingested by mice( Reference Chakravarthy, Zhu and Yin 22 ) remains to be determined. As hypothalamic mRNA level of other genes associated with the regulation of energy balance, namely NPY and POMC, was not different between the groups, an alternate route of control appears to be responsible for the increased cumulative energy but reduced weight gain in the HFD+BSA group.
Feed efficiency, calculated for the first 8 weeks of the trial, was significantly lower for the HFD+BSA group compared with the HFD group, indicating that the former group was less efficient in converting consumed energy into body mass than the HFD group. These results coincide with a study carried out by Tranberg et al. ( Reference Tranberg, Hellgren and Lykkesfeldt 12 ), in which mice fed a high-fat diet with WPI had reduced feed efficiency when compared with those fed with casein. To examine this further, faecal fat was analysed; however, it was found that the percentage of faecal fat of the HFD+BSA group was significantly less than that of the HFD group, implying greater intestinal lipid absorption, something not reflected by percentage of fat mass of this group. This suggests that BSA influences energy balance by affecting lipid metabolism in the adipose tissue (see below). We also speculate that excretion of non-lipid macromolecules in the faeces (not examined here) and/or energy loss via urinary output may have reduced lipid content available for anabolic processes; similarly, urinary excretion of tricarboxylic acid intermediates is responsible for energy loss associated with WPI( Reference Lillefosse, Clausen and Yde 23 ).
Fat mass is determined by both adipocyte size and number( Reference Arner, Bernard and Salehpour 3 ). As the SAT mRNA levels of the adipogenic transcription factor PPARG were not altered between the high fat-fed groups, this indicates that altered adipocyte number is not the main cause of the reduced SAT mass observed in the HFD+BSA group, but is more likely due to reduced adipocyte size, possibly via increased β-oxidation of lipid stores. Consistent with this finding, the intake of HFD+BSA increased the SAT mRNA levels of genes associated with β-oxidation, namely PPARA, UCP3 and CPT1b. This is important, because SAT serves as the main buffer for the storage of excess EI, and when its capacity is exceeded, fat accumulation occurs elsewhere throughout the body( Reference Ibrahim 24 ). Thus, the reduction in fat mass in the HFD+BSA group could be, at least in part, related to increased lipid catabolism in SAT, and could explain why mice fed the HFD+BSA diet had reduced body weight gain, but increased cumulative EI compared with the HFD group. Also, as the body's primary source of LEP, SAT plays an important role in total plasma LEP concentration, and therefore its production is associated with increased fat mass( Reference Ibrahim 24 ). This was reflected in the present study by the reduced SAT mass, reduced SAT mRNA levels of the LEP gene and the correspondingly reduced levels of circulating LEP found in the HFD+BSA group when compared with the HFD group. Interestingly, the presumed increased fat catabolism in SAT was not reflected in the RER or VO2 between the HFD+BSA and HFD groups. It is feasible that this may be because of the increased energy consumed by the HFD+BSA group being lost through excretion( Reference Lillefosse, Clausen and Yde 23 ) and β-oxidation in SAT. Consistent with this notion, we observed (but did not quantify) increased urination in the HFD+BSA group compared with the other groups, which was reflected by a higher intake of water in mice; however, this difference did not reach significance compared with the other control groups.
In contrast to SAT, visceral adipose tissue has been shown to be more associated with health complications corresponding to the obese state, such as type 2 diabetes mellitus and non-alcoholic fatty liver disease( Reference Ibrahim 24 ). In the present study, the HFD+BSA group did not show altered EAT mass when compared with either of the control groups, nor were the mRNA levels of adipogenic or β-oxidation genes changed. However, there was an increased trend in the mRNA levels of CPT1b in comparison with the HFD group. A couple of noteworthy observations were made that indicate potential counter-regulatory changes (in the gene expression of CPT1b and thus action) in EAT lipid metabolism with HFD+BSA feeding. First, plasma insulin levels were increased in the HFD+BSA group compared with the LFD group, consistent with increased cumulative EI, but both groups had similar glucose levels, which indicate a higher tissue uptake of glucose. Second, an increased trend in mRNA levels existed for GCCR in the HFD+BSA group compared with the LFD group, despite both groups having similar corticosterone levels. As a strong correlation existed between EAT mRNA levels of GCCR and LPL, and both showed an increased trend in the HFD+BSA group compared with the LFD group, the data may indicate higher corticosterone-induced lipid uptake in the EAT of the HFD+BSA group( Reference Peckett, Wright and Riddell 20 ). This is further supported by the increased EAT mRNA levels of FAT/CD36 in the HFD+BSA group compared with the LFD group, and could help to account for the unaltered EAT mass, despite having a trend towards increased mRNA levels of CPT1b when compared with either of the control groups. Further investigation is required to establish the potential functional relationship between dietary BSA, corticosterone and EAT lipid metabolism. Given that female C57/BL6J mice that have not been ovariectomised show greater resistance to obesity from high-fat feeding due to hormonal differences when compared with males, it may be of interest to examine the effect that dietary BSA has on LEP and corticosterone levels in a female wild-type model to further elucidate what impact hormones may or may not have on the results found in the present study( Reference Hong, Stubbins and Smith 25 ).
The synthesis of corticosterone is regulated by the activity of the hypothalamus–pituitary–adrenal (HPA) axis and by the peripheral tissues involving HSD11β1( Reference Smith and Vale 26 , Reference Walker 27 ). In the present study, EAT mRNA levels of HSD11β1 were unresponsive to the diets, while SAT mRNA levels of HSD11β1 was decreased in both high fat-fed groups compared with the LFD group. These findings suggest that it is unlikely that differences found in plasma corticosterone levels were due to the peripheral production of corticosterone. Although the central production of corticosterone is influenced by LEP stimulation of hypothalamic V1a and CRH gene expression( Reference Li, Ramahi and Nijland 28 ), in the present study, neither of these genes showed changes in response to the HFD+BSA diet, suggesting that LEP and/or associated hypothalamic signalling was not responsible for the altered corticosterone concentrations. To assess whether a factor other than LEP produced in proportion to fat mass may be responsible for changes in plasma corticosterone levels, latter data were examined using percentage of fat mass as a covariate, which indicated that the circulating levels of corticosterone found in HFD+BSA mice were not affected by the change in the percentage of fat mass, but rather were related to the diet acting through some other mechanism. Further investigation is required to determine whether intake of HFD+BSA has an impact on different regions of the HPA axis, such as the adrenal glands that have been shown to increase the production of corticosterone in mice given a high-fat diet due to morphological and functional changes( Reference Swierczynska, Mateska and Peitzsch 29 ), and how any changes in HPA activity affect peripheral lipid metabolism through corticosterone action.
In summary, mice fed with HFD+BSA had significantly higher cumulative EI, but decreased percentage of fat mass, primarily through a significant decrease in SAT mass when compared with the HFD control group. SAT mass reduction was most probably due to an increase in the expression of genes associated with β-oxidation. While plasma LEP concentration was reduced to LFD levels in the HFD+BSA group, primarily due to a reduction in the percentage of fat mass, a significant decrease in plasma corticosterone levels was not due to either the change in the percentage of fat mass or associated LEP acting through hypothalamic V1a and CRH gene expression. Further work is required to better understand the mechanisms underlying the aforementioned changes, which will help to uncover the components of dietary BSA responsible for these changes and, in turn, to target negative effects associated with obesity, such as increased fat mass and corticosterone levels.
Supplementary material
To view supplementary material for this article, please visit http://dx.doi.org/10.1017/S0007114515002123
Acknowledgements
The authors thank Harriett Schellekens from the University College Cork and Paula O'Connor from Teagasc Moorepark Food Research Centre for their assistance in procuring laboratory space and equipment.
The present study was funded by Teagasc. B. L. M. was funded by the Walsh Fellowship Program. J. R. S. was supported by a 1000-talents professorship from the Chinese government. The funding bodies had no input on the design of the study or in the interpretation of the data.
The authors' contributions are as follows: B. L. M. conducted the work, analysed the data and prepared the figures; B. L. M. and K. N. N. wrote the paper. All authors designed the experiments and edited the manuscript.
There are no conflicts of interest.


