Introduction
The success of kochia [Bassia scoparia (L.) A. J. Scott] in the Central Great Plains could be attributed to several morphological and physiological characteristics: earlier emergence timing and shorter duration of emergence relative to many summer annual species; C4 physiology; an ability to tolerate hot and dry environments typically encountered in the Central Great Plains; and non-obligate outcrossing and very high seed production, together with low levels of seed dormancy (Dille et al. Reference Dille, Stahlman, Geier, Riffel, Currie, Wilson, Sbatella, Westra, Kniss, Moechnig and Cole2017; Friesen et al. Reference Friesen, Beckie, Warwick and Van Acker2009; Kumar and Jha Reference Kumar and Jha2017; Osipitan and Dille Reference Osipitan and Dille2017). A new problematic characteristic has been the evolution of glyphosate-resistant (GR) B. scoparia populations throughout the area, and when GR survivors produce seed and tumble across the landscape, new genotypes are potentially being introduced and will continue to spread.
The mechanism for GR in B. scoparia has been identified as 5-enolpyruvylshikimate-3-phosphate synthase (EPSPS) gene amplification. If this trait is still segregating within a population in a localized area (e.g., seed from one field) but tumbles and mixes with another nearby population, how does this mixture of genotypes react to competition with other B. scoparia if introduced to new areas? Does the level of EPSPS gene copy number alter the population’s competitive response to the number and type of neighbors in the absence of glyphosate application?
Glyphosate resistance in some B. scoparia populations was first reported in western Kansas in 2007 (Godar Reference Godar2014; Waite Reference Waite2010). The mechanism of GR in these B. scoparia populations was an increase in EPSPS gene copy number (Godar et al. Reference Godar, Stahlman, Jugulam and Dille2015; Jugulam et al. Reference Jugulam, Niehues, Godar, Koo, Danilova, Friebe, Sehgal, Varanasi, Wiersma, Westra and Stahlman2014). Increased EPSPS gene copies in a GR B. scoparia plant lead to overproduction of EPSPS enzyme, such that even in the presence of glyphosate at current label rates (0.9 kg ae ha−1), there would be an abundant supply of uninhibited EPSPS enzyme (Wiersma et al. Reference Wiersma, Gaines, Preston, Hamilton, Giacomini, Buell, Leach and Westra2015). In a GR plant, there can be 2 to 10 times more functional copies of the gene encoding EPSPS compared with a susceptible B. scoparia plant (Jugulam et al. Reference Jugulam, Niehues, Godar, Koo, Danilova, Friebe, Sehgal, Varanasi, Wiersma, Westra and Stahlman2014; Wiersma et al. Reference Wiersma, Gaines, Preston, Hamilton, Giacomini, Buell, Leach and Westra2015), and the more copies of the EPSPS gene in B. scoparia, the greater its level of resistance to glyphosate (Godar et al. Reference Godar, Stahlman, Jugulam and Dille2015; Jugulam et al. Reference Jugulam, Niehues, Godar, Koo, Danilova, Friebe, Sehgal, Varanasi, Wiersma, Westra and Stahlman2014).
In the specific case of increase in EPSPS gene copy number, impaired growth and seed production could not be identified in Palmer amaranth (Amaranthus palmeri S. Watson) (Giacomini et al. Reference Giacomini, Westra and Ward2014; Vila-Aiub et al. Reference Vila-Aiub, Goh, Gaines, Han, Busi, Yu and Powles2014) or in B. scoparia (Kumar and Jha Reference Kumar and Jha2015). Bassia scoparia has high genetic diversity among populations (Mengistu and Messersmith Reference Mengistu and Messersmith2002). The inherent genetic variation in weed species could result to wide variation in vegetative growth, seed production, and seed viability (Giacomini et al. Reference Giacomini, Westra and Ward2014; Jasieniuk et al. Reference Jasieniuk, Brûlé-Babel and Morrison1996; Preston and Wakelin Reference Preston and Wakelin2008).
Plant growth and reproductive performance are better assessed in the presence of plant competition, because in reality, plants usually compete with each other for resources in the field (Bergelson and Purrington Reference Bergelson and Purrington1996; Cousens and Fournier-Level Reference Cousens and Fournier-Level2018; Osipitan Reference Osipitan2016; Vila-Aiub et al. Reference Vila-Aiub, Gundel and Preston2015). In a competition-based evaluation of growth and reproductive costs of herbicide resistance driven by resource limitations—in the absence of the herbicide application, a resistant plant that allocates resources away from growth but toward resistance will be at a disadvantage in terms of vegetative growth and fecundity compared with a susceptible plant (Baucom et al. Reference Baucom, Chang, Kniskern, Rausher and Stinchcombe2011; Debban et al. Reference Debban, Matthews, Elliot, Pieper, Wilson and Baucom2015; Preston et al. Reference Preston, Wakelin, Dolman, Bostamam and Boutsalis2009; Vila-Aiub et al. Reference Vila-Aiub, Gundel and Preston2015). This competition will potentially amplify costs that are not highly expressed in the absence of plant competition (Jordan Reference Jordan1999). Conducting this study in the field provides a more practical assessment of plant response than is possible in the artificial environments used in greenhouse or growth-chamber studies (Giacomini et al. Reference Giacomini, Westra and Ward2014; Kumar and Jha Reference Kumar and Jha2015; Vila-Aiub et al. Reference Vila-Aiub, Goh, Gaines, Han, Busi, Yu and Powles2014).
At the commencement of this study in 2014, there were no publications describing the impact of increased EPSPS gene copy number on vegetative growth and fecundity variables of GR B. scoparia, especially in a field situation. The objectives of this study were to evaluate: (1) within-population variability for EPSPS gene copy number and relationship to growth and fecundity variables and (2) intraspecific competitive response of individuals within populations that vary in EPSPS gene copy number.
Materials and Methods
Source and Characterization of Bassia scoparia Populations
Seeds from three suspected GR B. scoparia populations were collected from fields of irrigated grain sorghum [Sorghum bicolor (L.) Moench] and GR soybean [Glycine max (L.) Merr.] in rotation from Thomas (in 2007) and Scott and Finney (in 2012) counties (TH-R, SC-R, and FN-R, respectively), while seed from three suspected GS B. scoparia populations were also collected in 2012 from Phillips, Wallace, and Wichita counties (PH-S, WA-S, and WI-S, respectively), all in western Kansas. Seeds were harvested from at least 10 mature plants per site, and seeds were bulked in separate bags for each population. Seeds were stored in a freezer (≤ −5 C) until used.
Common Garden Field Study
A common garden field study was conducted in 2014 and repeated in 2015 at the Department of Agronomy Ashland Bottoms Research Field near Manhattan, KS (39.12577°N, 96.6365°W). It was set up as a target-neighborhood competition design to determine the response of individual target plants that varied in EPSPS gene copy number within each suspected GR population. To sow and establish plants, B. scoparia seeds were coated with Laponite RD® gel (TALAS Supplies, 330 Morgan Ave. Brooklyn, NY 11211) at a rate of 0.012 g ml−1 of water (Colquhoun et al. Reference Colquhoun, Stoltenberg, Binning and Boerboom2001) to prevent displacement by wind and to create a moist environment for seed germination. Several seeds were sown in desired position as specified below in each plot. After B. scoparia emergence, seedlings were thinned to the appropriate proportion of target plant to neighbor densities. One target B. scoparia plant from each of the three segregating GR populations was located in the center of a 0.6 m by 0.6 m plot surrounded by one of three neighbor levels of B. scoparia competition: 4, 12, or 24 plants plot−1. In 2015, a no-neighbor level was added as an additional control. The respective neighbors were from the same population as the target plant. In the treatments with 4 and 12 neighbor plants plot−1, the distance from target to neighbor was 15 cm, while in the treatment with 24 neighbors plot−1, the distance from target to the immediate neighbor and between neighbors was about 10 cm. All treatments were arranged in a randomized complete block design with 10 replications in 2014 and 7 replications in 2015.
The field soil was a moderately well drained Wymore silty clay loam (fine, smectitic, mesic Aquertic Argiudolls) with soil pH between 6.1 and 7.1 and 2.5% soil organic matter. In 2014, the soil nitrogen, phosphorous, and potassium were 17, 27, and 339 ppm, respectively; in 2015, nitrogen, phosphorous, and potassium were 79, 47, and 529 ppm, respectively.
Target Plant Assays for EPSPS Gene Copy Number and Shikimate Accumulation
At 8 wk after establishing the target B. scoparia plants in the field, clones of each target plant were generated. Cuttings of 4 cm in length were taken from an actively growing branch from each target plant, transported to the greenhouse, and trimmed to a 2-cm 3-leaf segment, and rooting hormone powder was applied (Bontone® Rooting Powder [Indole-3-butyric acid 0.10%] Bonide Products, Oriskany, NY). Cuttings were planted into 0.8-L plastic pots filled with potting soil (Miracle-Gro®, Marysville, OH) and covered with humidity domes. They were kept in a greenhouse maintained at 25/20 C day/night, photoperiod of 15/9 h day/night enhanced with 120 μmol m−2 s−1 illumination by sodium-vapor lamps, and 60% relative humidity. Once the plants reached 7 cm in height, leaves were collected for EPSPS and shikimate accumulation assays.
To determine EPSPS gene copy number, 5 young leaves about 1-cm long were collected from each cloned target plant and placed into 96-deep-well plates for genomic DNA extraction based on procedures previously described (Gaines et al. 2010; Godar Reference Godar2014). The EPSPS gene copy number was measured relative to the ALS gene (endogenous gene). Primer sequences used for the EPSPS and ALS genes of B. scoparia were previously reported (Godar et al. Reference Godar, Stahlman, Jugulam and Dille2015; Varanasi et al. Reference Varanasi, Godar, Currie, Dille, Thompson, Stahlman and Jugulam2015). To determine shikimate accumulation, the in vivo leaf-disk assay was conducted using the cloned target plants (Shaner et al. Reference Shaner, Nadler-Hassar, Henry and Koger2005). Shikimate accumulation was measured after incubation of samples in 100 μM glyphosate in an in vivo leaf-disk assay for 16 h. The amount of shikimate in nontreated check was subtracted from the amount of shikimate in glyphosate-treated leaf disks of each population. EPSPS gene copy number was correlated with shikimate accumulation to classify each target B. scoparia plant as either GS or GR, with individual plants with less than two EPSPS gene copies considered susceptible, while those with two or more EPSPS gene copies were considered resistant. As reference, EPSPS gene copy number and shikimate accumulation in the GR populations were compared with those of known susceptible B. scoparia populations (PH-S, WA-S, and WI-S).
Target Plant Growth and Fecundity
Growth and fecundity of individuals classified as GR and GS within each of the three segregating populations (SC-R, FN-R, and TH-R) were measured. The comparison of individuals within each population was expected to minimize the confounding effect of genetic background on the measured growth and fecundity variables. Days to first flower were recorded. Plant height, stem diameter at the base of main stem (determined using a vernier caliper), and plant canopy width were measured at physiological maturity (about 20 wk after emergence). Individual target plants were then clipped at the soil surface, bagged, dried at 40 C for 72 h, and weighed for biomass. Seeds from each plant were stripped off and cleaned using an air-column separator. Total and 100-seed weight plant−1 were measured. Total seed number was calculated for each plant. Reproductive effort was calculated by dividing total seed weight (g plant−1) of the target plant by its respective plant biomass (g plant−1).
Statistical Analysis
Initial ANOVA was conducted using PROC Mixed in SAS v. 9.4 (SAS Institute, Cary, NC) to determine whether there were interactions among the fixed effects, which included year, EPSPS gene copy number, population, and neighbor density when analyzing their effects on days to first flower, plant height, stem diameter, canopy width, biomass, 100-seed weight, and total seed number per plant as measured at physiological maturity. Replicates (blocks) were considered as random effects in the model. Then, analysis of covariance (ANCOVA) was conducted with EPSPS gene copy number as the covariate and population and neighbor density as independent factors to evaluate the relationship between EPSPS gene copy number and days to first flower, target plant height, stem diameter, canopy width, biomass, 100-seed weight, total number of seeds per plant, and reproductive effort.
Biomass for each target plant was regressed across increasing neighbor density using a hyperbolic model:
 $$Y{\equals}a\,/\,\left( {1{\rm }{\plus}bx} \right)$$
where Y represents the biomass of target individuals (g plant−1) at neighbor density x, a represents the maximum biomass of target individuals in the absence of neighbors, and b represents “competitive response” of target individuals to increasing neighbor density (Goldberg and Fleetwood Reference Goldberg and Fleetwood1987; Vila-Aiub et al. Reference Vila-Aiub, Neve and Powles2009). The model was fit to the data as grouped by GR or GS individuals, using nonlinear least-squares regression analysis in SigmaPlot v.12.3 (Systat Software, San Jose, CA). The slopes (b) were compared using one-way ANOVA to determine the relative difference in competitive response of the GR and GS individuals in each population as neighbor density increased. Large slope values indicated strong competitive effects but weak competitive responses (Goldberg and Fleetwood Reference Goldberg and Fleetwood1987), while smaller slope values indicated a stronger competitive response to increasing neighbor density (Goldberg and Landa Reference Goldberg and Landa1991; Weiner Reference Weiner1982). Data from the 2014 and 2015 studies were generally combined, as there were no statistical differences among them.
Results and Discussion
Correlation of EPSPS Gene Copy Number and Shikimate Accumulation
The EPSPS gene copy number of B. scoparia plants ranged from 1 to 13 copies in SC-R and from 1 to 16 copies in FN-R and TH-R (Figure 1). Average EPSPS gene copy number for all individuals in SC-R, FN-R, and TH-R populations was 5, 6, and 5, respectively, while all individuals in the suspected GS B. scoparia populations (PH-S, WA-S, and WI-S) had EPSPS gene copy numbers less than 2. Results showed that about 38%, 28%, and 33% of individuals in SC-R, FN-R, and TH-R populations had EPSPS gene copy numbers as low as those found in GS populations and accumulated similar levels of shikimate as the GS populations (Table 1). This confirmed that these individuals were susceptible to glyphosate. These results clearly demonstrated that SC-R, FN-R, and TH-R populations were still segregating for glyphosate resistance as they had a wide range of EPSPS gene copy numbers and, consequently, a mixture of GR and GS individuals. Previous research indicated that as few as two to three copies of the EPSPS gene were sufficient to confer resistance to glyphosate in B. scoparia (Godar et al. Reference Godar, Stahlman, Jugulam and Dille2015; Wiersma et al. Reference Wiersma, Gaines, Preston, Hamilton, Giacomini, Buell, Leach and Westra2015). The documented increase in EPSPS gene copy number resulted in an increase in EPSPS protein abundance (Wiersma et al. Reference Wiersma, Gaines, Preston, Hamilton, Giacomini, Buell, Leach and Westra2015) and, consequently, an increase in phenotypic resistance to glyphosate in other B. scoparia populations (Godar et al. Reference Godar, Stahlman, Jugulam and Dille2015; Jugulam et al. Reference Jugulam, Niehues, Godar, Koo, Danilova, Friebe, Sehgal, Varanasi, Wiersma, Westra and Stahlman2014; Kumar et al. Reference Kumar, Jha, Giacomini, Westra and Westra2015).
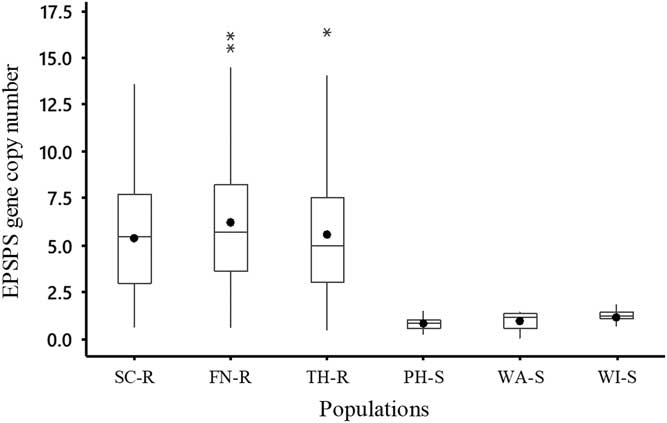
Figure 1 Box plots describing the distribution of EPSPS gene copy number of each Bassia scoparia population that includes the mean (solid circle), median (horizontal line), and quartiles (25%, 50%, and 75%). There were three suspected glyphosate-resistant (GR) B. scoparia populations (from Finney [FN-R], Scott [SC-R], and Thomas [TH-R] counties) and three suspected glyphosate-susceptible (GS) B. scoparia populations (from Phillips [PH-S], Wallace [WA-S], and Wichita [WI-S] counties). The EPSPS gene copy number was estimated relative to one EPSPS gene copy of a known GS B. scoparia population.
Table 1 Number of target Bassia scoparia plants screened, individuals with EPSPS gene copy number less than two, and mean accumulated shikimate within three suspected glyphosate-resistant (R) B. scoparia populations and compared with individuals from glyphosate-susceptible populations (GSS), all from western Kansas.
a FN, Finney County; SC, Scott County; TH, Thomas County.
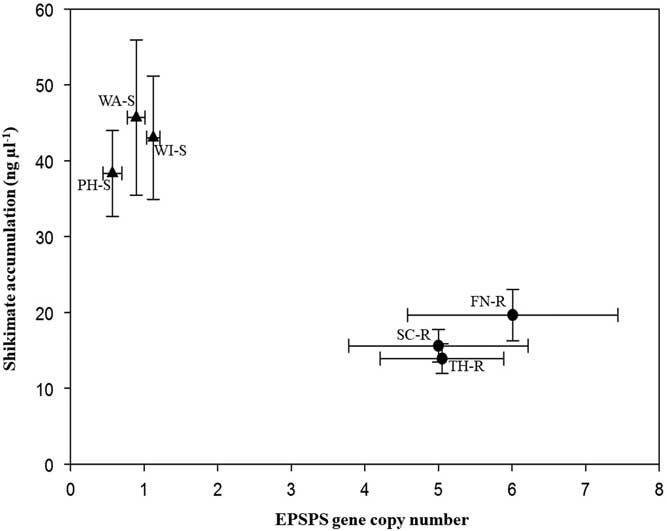
Target plants from the three known GS populations accumulated 33.8 to 45.7 ng shikimate µl−1, while the segregating suspected GR populations accumulated 13.9 to 19.6 ng shikimate µl−1 during the 16-h incubation period (Figure 2). Leaf disks of plants with few EPSPS gene copies accumulated more shikimate than plants with more EPSPS gene copies. All B. scoparia plants accumulated shikimate after glyphosate application, but accumulation was expected to be less in GR than GS individuals (Pline et al. Reference Pline, Wilcut, Duke, Edmisten and Wells2002). This finding corresponds to previous work in which a negative correlation was observed between EPSPS gene copy number and shikimate accumulation (Godar et al. Reference Godar, Stahlman, Jugulam and Dille2015; Kumar and Jha Reference Kumar and Jha2015; Wiersma et al. Reference Wiersma, Gaines, Preston, Hamilton, Giacomini, Buell, Leach and Westra2015). Assessment of EPSPS gene copy number and of shikimate accumulation provides rapid nondestructive identification of GR or GS plants.

Figure 2 Mean EPSPS gene copy number versus mean shikimate accumulation (ng μl−1) of Bassia scoparia populations suspected to be glyphosate-resistant (filled circles; Finney [FN-R], Scott [SC-R], and Thomas [TH-R] counties) and glyphosate-susceptible (filled triangles; Phillips [PH-S], Wallace [WA-S], and Wichita [WI-S] counties). Error bars indicate standard error around the mean.
Relationship between EPSPS Gene Copy Number and Bassia scoparia Growth and Fecundity
Initial ANOVA showed that there were no interactions among years and fixed effects or interactions of EPSPS gene copy number, population, and neighbor density on growth and fecundity variables; hence, data were combined across years. There was no relationship between EPSPS gene copy number and growth and fecundity variables, except for a positive correlation with 100-seed weight (Table 2). However, in this common garden study, seeds were formed from outcrossing among different B. scoparia plants (including plants with low and high EPSPS gene copy) in the field. Therefore, it was not possible to determine whether this seed- related response was because of a glyphosate-resistance trait.
Table 2 P-values of the ANCOVA on the effect of EPSPS gene copy number and neighbor density on Bassia scoparia plant growth and fecundity variables.

* Significant at α = 0.05.
Population was a significant factor influencing final plant biomass and total seed production (Table 2). This indicated that there was a difference in biological productivity among the populations despite being collected from a close geographical area (western Kansas) and from fields with similar cropping system (irrigated grain sorghum–GR soybean rotation). Comparing biological response to resistance traits among these populations could be confounded by the inherent differences in productivity of the populations and would not give an accurate comparison based on biomass. However, this confounding effect could be avoided if individuals within the same populations were compared (Cousens and Fournier-Level Reference Cousens and Fournier-Level2018). Target plant height and biomass, 100-seed weight, and total number of seeds produced were impacted by increasing neighbor density levels (Table 2).
Competitive Response of Target Individuals within Each Population to Neighbor Density
The hyperbolic regression model (Equation 1) adequately explained (P <0.001) variations in biomass responses of target plants classified as GR or GS (based on EPSPS gene copy number within populations) to increasing B. scoparia neighbor density.The hyperbolic model provided two estimates, that is, potential biomass of target plants (parameter a) in the absence of B. scoparia neighbors and competitive response (parameter b) of target plant biomass to increasing neighbor density. Initial analysis showed that increasing neighbor density was strongly correlated (r = 0.83) with increasing accumulation of biomass by neighbors in each plot. In general, increasing neighbor density increased neighbor biomass, which in turn had a negative impact on target plant biomass accumulation (P <0.001), and this was shown by the strong negative curvilinear relationship between target plant biomass and increasing neighbor density (Figure 3).
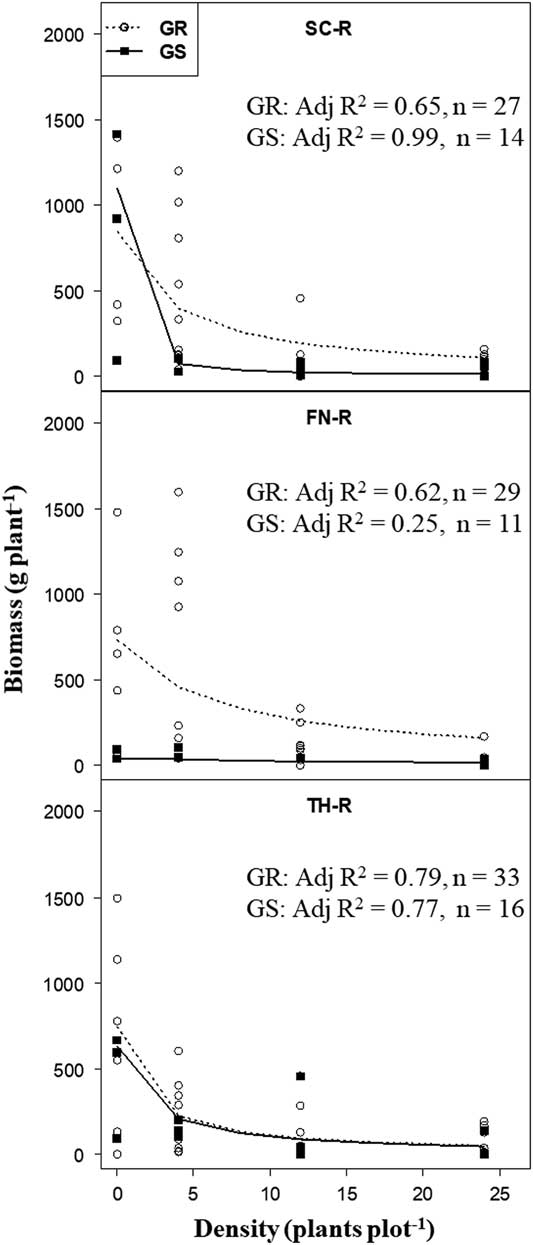
Figure 3 Target plant biomass in response to increasing neighbor Bassia scoparia density for glyphosate-resistant (GR) and glyphosate-susceptible (GS) individuals (classified based on EPSPS gene copy number) within segregating B. scoparia populations (from Finney [FN-R], Scott [SC-R], and Thomas [TH-R] counties). Adjusted coefficients of determination (Adj R2; all data sets had P <0.001) after fit to Equation 1 [Y = a/(1+bx)], where a is the estimated target plant biomass in the absence of neighbors, and b is the slope of the model that measures the competitive response of target plant biomass to increasing density of neighbors.
In the absence of neighbors, there was no difference in target plant biomass accumulation between individuals with low (GS) or high (GR) EPSPS gene copy number within populations from TH-R and SC-R, but there was among plants from FN-R (Table 3). Target plant biomass of GS individuals in the FN-R population was minimal in the absence of neighbors and similar to biomass produced in the presence of neighbors. Too few (i.e., two) isolated GS target plants were available to be included in the analysis for FN-R population.
Table 3 Comparison of biomass response of glyphosate-resistant (GR) and glyphosate-susceptible (GS) Bassia scoparia plants (classified based on EPSPS gene copy within each of the segregating populations) in absence and presence of neighbor competition.a

a Estimates are derived from hyperbolic nonlinear model [Y = a/(1+bx)]. The maximum biomass in the absence of neighbors and competitive response of target individuals are represented respectively by estimate a and b in the model. Estimates for GR and GS are compared within each column. P-values are derived from ANOVA of estimates. P-value <0.05 is significant.
b FN, Finney County; SC, Scott County; TH, Thomas County; R, resistant.
There was no difference between GR and GS target plant biomass in the “competitive response” to increasing neighbor density within each of the three segregating suspected GR populations (Table 3). It was expected that competition among plants or added environmental stresses could amplify any biological costs that may be associated with resistance traits and that may not be expressed in the absence of plant competition or stress (Jordan Reference Jordan1999). However, using increasing neighbor density as a surrogate for resource competition experienced by the target plants within each B. scoparia population did not produce results indicating that occurrence of glyphosate resistance (based on increased EPSPS gene copy number) provided a benefit or a cost to the productivity of plants in these populations. A similar result was reported by Kumar and Jha (Reference Kumar and Jha2015) for GR B. scoparia plants evaluated in a greenhouse study: no impact was observed.
In B. scoparia, genetic diversity is very high and is maintained through substantial levels of gene flow through outcrossing (Mengistu and Messersmith Reference Mengistu and Messersmith2002). Without examining GR and GS individuals within several populations, it is very difficult to assess any biological costs associated with glyphosate resistance in B. scoparia, particularly when using a non-isogenic line. Getting isogenic lines in B. scoparia through several generations of selfing has been difficult and could confound the traits under investigation because of inbreeding depression with reduced seed size or viability (Esser 2014). An approach comparing GR individuals with GS individuals within naturally occurring populations was used in the present study to control for the influence of genetic background. The use of populations with a reasonable spread of EPSPS gene copy number (indicating presence of both GR and GS individuals) made it possible to compare B. scoparia plants with similar background. In addition, use of multiple populations helped in identifying reproducible results.
Evaluating biological costs associated with herbicide-resistance mechanisms and their mediation by weed–plant interactions is essential to predict the persistence of herbicide-susceptible and herbicide-resistant weed species under different ecological conditions. In reality, weeds do not often grow in isolation in the field, but they interact with neighboring plants (intra- or interspecific) and compete for resources for survival. The expectation is that if weak competitive responses were associated with the mechanism of herbicide resistance in individuals, this would result in reduced plant growth and fecundity, with selection pressure occurring against those individuals with herbicide resistance (Vila-Auib et al. 2015). This inherent biological trade-off could reverse evolution of herbicide resistance through competition for resources by decreasing the frequency of herbicide-resistant individuals in a population over time, especially if new selection pressures do not increase against the susceptible individuals. A previous study that evaluated B. scoparia seed germination from different populations under a range of varying temperatures in a controlled environment (growth chamber) showed that a GR B. scoparia population had a slower germination rate and reduced seed viability compared with a GS population (Osipitan and Dille Reference Osipitan and Dille2017). However, there was no evidence that increased EPSPS gene copy number, as a mechanism of glyphosate resistance in B. scoparia, was associated with reduced growth and fecundity, even under resource competition with neighbors in this field study. Lack of associated vegetative growth and fecundity reductions for GR individuals suggests that B. scoparia plants with high EPSPS gene copy numbers are likely to persist in field populations, except when effective weed management strategies are adopted that would prevent their growth and seed production.
Acknowledgments
This work was supported by a grant from USDA-NIFA (award no. 2012-67013-19347). This is contribution no. 17-234-J from the Kansas Agricultural Experiment Station. The authors acknowledge Dr. Phillip Stahlman, Dr. David Hartnett, and Dr. Allan Fritz for their contributions, and Dr. Mithila Jugulam for laboratory access to complete EPSPS gene quantification and shikimate accumulation assay. We thank Dr. Amar Godar and Dr. Vijay Varanasi for their valuable suggestions during the laboratory studies. We also thank the USDA Central Small Grain Genotyping Center for providing protocols and access to the laboratory to complete B. scoparia DNA extraction and quantification. No conflicts of interest have been declared.