


INTRODUCTION
Eastern equine encephalitis (EEE) is a vector-borne disease responsible for severe encephalitis in humans and horses. Case-fatality rates associated with clinical EEE neuroinvasive disease range from 35% to 75% in humans and can reach 90% in horses [Reference Armstrong and Andreadis1, Reference Gibbs, Long, Sellon and Long2]. EEE virus (EEEV) has been considered endemic for decades in the eastern United States [Reference Calisher3]. However, its geographical range seems to have expanded northwards recently with the first human cases of EEE reported in New Hampshire and Vermont in 2005 and 2012, respectively [Reference Armstrong and Andreadis1], increased and dispersed viral activity reported in Maine since 2009 [Reference Gibney4] and sporadic outbreaks reported in horses from eastern Canada throughout the 2000s [5, 6]. Unprecedented numbers of equine clinical cases occurred yearly from 2008 to 2010 (total = 43) in the southern part of the province of Quebec, suggesting that the virus may have become endemic in this area [6]. In 2012, an equine EEEV serosurvey conducted in the same region revealed that more than 6% of horses had been infected with EEEV, which suggests that ecological niches (i.e. appropriate habitat, vectors and virus) exist to sustain EEEV transmission including potential spillover to human populations [Reference Rocheleau7]. The characteristics of these ecological niches have, however, never been precisely identified. Studies conducted in northeastern United States may give some indications about the environmental characteristics of high-risk areas in eastern Canada. However, risk factors for EEEV spillover in affected areas of the United States were usually inferred from EEEV vector biology and feeding preferences [8, 9]. Vector populations may change from one geographical area to another and the exact contribution of each vector species to EEEV spillover to humans still needs to be clarified [Reference Armstrong and Andreadis10, Reference Hassan11]. Therefore, substantial knowledge gaps remain about risk to humans that can be applied to emerging areas such as Canada, particularly in areas where there is limited entomological surveillance directed towards EEEV as is currently the case in Quebec. A few pools of infected Culiseta melanura, the main enzootic vector of EEEV, were captured from a circumscribed wetland area of southern Quebec in 2009 and 2010 [Reference Vincent12] but no further entomological investigations were conducted to assess the public health risk posed by EEEV in Quebec.
To address these knowledge gaps, the current study aimed to identify risk factors and map the risk of equine infection by EEEV in southern Quebec, Canada, using clinical and serological data from horses. We hypothesized that the level of EEEV activity is non-homogeneous across the region and assumed that the geographical distribution and the environmental factors linked to the risk in horses provide indirect indications of the risk distribution in humans.
MATERIALS AND METHODS
A dataset containing serological data on EEEV in horses was used for the analyses, alone and in combination with another one containing clinical outcomes of EEEV in horses. Logistic regression models were used for identifying environmental risk factors and a risk map was produced based on the output of the statistical models.
Study area
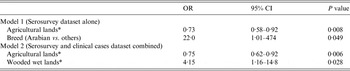
The study area consisted of five administrative regions from southern Quebec: Montérégie, Lanaudière, the Laurentides, Estrie and Centre-du-Québec (Fig. 1). These regions represent a mix of suburban, forested and agricultural lands with numerous wooded or non-wooded wetlands having the potential to sustain the EEEV enzootic transmission cycle [Reference Armstrong and Andreadis1, Reference Calisher3, Reference Emord and Morris13–15]. The whole study area was divided in two zones: zone 1, which includes Montérégie, Lanaudière and the Laurentides, captured the location of 190 horses recruited in 2012 to the EEEV serological survey and 34 of the 43 equine EEE clinical cases that were reported from Quebec from 2008 to 2010; zone 2, which is adjacent to zone 1, includes the regions of Estrie and Centre-du-Québec and the remaining nine equine EEE clinical cases reported from 2008 to 2010. Horses from zone 1 were used for building statistical models and horses from zone 2 were used to assess the sensitivity of the risk map (Fig. 1).
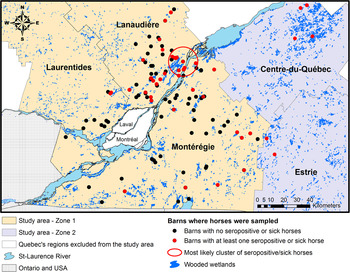
Fig. 1. Study area and geographical location of sampled or sick horses in the five selected administrative regions in southern Quebec, Canada.
Datasets
The serosurvey dataset included 190 horses sampled in 2012 from 92 barns located within the study area. These horses had never been vaccinated against EEEV at the time of sampling, and 15 were seropositive to EEEV [Reference Rocheleau7]. In addition to EEEV serological results, this dataset included information on horse characteristics (age, sex, breed), animal management (use of mosquito repellent, time spent outside daily, use of horse protective fly sheets or blankets), and characteristics of the barn in which they were housed (type of housing, use of window and door screens). The clinical cases’ dataset included the 43 clinical equine EEE cases reported to the Ministry of Agriculture, Fisheries and Food of Quebec between 2008 and 2010. Individual characteristics of these 43 horses were not available. The two datasets included an accurate geolocation of the barns where each horse was being housed at the time of blood sampling or at the time of EEE diagnosis. With 34 of these 43 ill horses located within zone 1, a total sample size of 224 horses distributed over 62 municipalities was available for statistical modelling. The remaining nine ill horses, housed in six different barns, were distributed among six additional municipalities of zone 2.
Laboratory analyses
Each serum sample from the serosurvey dataset was screened for antibodies to EEEV by a plaque reduction neutralization test (PRNT) at the National Microbiology Laboratory of the Public Health Agency of Canada as described previously [Reference Rocheleau7]. Positive samples were titrated and samples were taken as positive when the PRNT neutralizing antibody titre was ⩾1:20. Although the exact sensitivity and specificity of the PRNT was not specifically assessed in the current study, this serological assay is usually considered as a gold standard for arboviruses across species and is the recommended method for estimating prevalence of infection in the horse population according to the World Organization for Animal Health (OIE) [Reference Rocheleau7, 16].
Environmental data
Land cover classification for the whole study area was retrieved from the Ecoforest Inventory System of the Ministry of Forests, Wildlife and Parks of Quebec (https:// www.mffp.gouv.qc.ca/forets/inventaire/inventaire-quebec-meridional.jsp). For each horse, land cover variables were calculated as the proportion of the area covered either by hardwood, coniferous or mixed forest, developed, agricultural or dry bare land, orchards and surface water or wetlands inside a buffer of 5 km radius centred on the barn location. Land cover categories were defined according to the land cover classification system of the Fourth Eco-forest inventory of southern Quebec [17]. The buffer radius was chosen according to the average flying distance of Cs. melanura, the main enzootic vector of EEEV [Reference Calisher3], ranging from 4 to 9 km according to previous studies [Reference Howard, White and Muller18, Reference Estep19]. Horses were assumed to spend most of their time in the close proximity to their barn.
Statistical analyses
Logistic regression analyses, using generalized estimating equations (GEE) with an exchangeable correlation structure (proc genmod, SAS v. 9.4, SAS Institute Inc., USA) to account for potential clustering for horses living within the same municipality, were used to model the associations between the log odds of seropositivity or disease in horses and the aforementioned individual and environmental variables. Analyses were conducted first using the serosurvey dataset alone (model 1) to estimate associations between environmental variables and seropositivity while controlling for the potential confounding effects of individual factors. Analyses were then conducted on the combined serosurvey and EEEV clinical datasets for further identification of environmental risk factors on a larger sample including clinical outcomes. This sample was divided into two datasets: a training dataset including 190 horses (85% of the horses from the dataset) that was used for model building (model 2) and a validation dataset including the remaining 34 horses that was used to assess the predictive power of model 2. Random allocation of the horses between the training and validation datasets was conducted using the surveyselect procedure in SAS v. 9.4. No validation dataset was produced for model 1 given the low number of positive outcomes in the serosurvey dataset. As no data on the individual characteristics of horses was available in the clinical cases database, model 2 only included environmental variables.
Unconditional associations between each environmental or individual factor and the outcome variable were estimated by univariate logistic regression. The assumption of a linear relationship between continuous predictors and the logit of the outcome was evaluated by plotting a loess smoothed curve of the predictor against the model's Pearson's residuals. If the relationship appeared not to be linear, the continuous predictor was categorized according to its quartiles and, when biologically relevant, adjacent categories that were not significantly different (P < 0·05) from each other were merged. All explanatory variables showing a significant unconditional association (using the criterion P < 0·20) were retained for inclusion in a multivariate model. Correlations between explanatory variables were evaluated using the Pearson correlation coefficient (r) for continuous variables and the odds ratio (OR) obtained from simple logistic regression for categorical variables. When r values were >0·7 or ORs were >7, one of the two correlated explanatory variables was chosen for further analysis [Reference Dohoo, Martin and Stryhn20] with selection on the basis of relevance to the biology of EEEV as reported in previous studies. The multivariate models were then refined by sequentially dropping explanatory variables whose removal did not significantly (P > 0·05) affect model deviance. An explanatory variable was considered as being a confounder if its removal from the model caused a >20% change in the OR value of another explanatory variable. All confounders were forced into the final models. Two way interactions were tested between each of the final models’ explanatory variables. In addition, for model 1, the potential confounding effect of individual variables not selected from univariate analyses was assessed regardless of their P value by forcing each of them one at a time in the final multivariate model. For the multivariate models, various correlation structures were compared based on QIC statistics (quasi-likelihood under the independence model criterion [Reference Pan21]). Outliers were identified by computing the standardized Pearson residuals and Cook's distances from the final multivariate model. Df-betas, which represent the variation in the parameter estimates when an observation is deleted from the dataset, were also computed for individual observations and for whole clusters (municipalities) to detect outliers at each of these levels. The predictive power of the multivariate models was assessed based on the area under the ROC curve (AUC) and the percentage of horses that were correctly classified by the models with a cut-off of >0·5 for classifying predicted values as positive. Predictive values for horses from the validation dataset were calculated based on the regression coefficients of model 2 and the predicted outcomes for these horses were compared with the observed outcomes. The AUC for model 2 was also computed based on the validation dataset.
A risk map was produced based on predicted values from the final logistic model. Model 2 was used based on its theoretically greater statistical power for environmental risk factor identification compared with model 1. The study area was divided into a grid of 5 × 5 km2 cells. Each cell's centroid was used as the centre of a 5-km radius circular buffer. The percentage of the area inside each buffer that was represented by any of the environmental risk factors retained into the final logistic model was calculated and, for each buffer's centroid, the predicted value of the model was calculated [Reference Dohoo, Martin and Stryhn20]. A smoothed risk map was produced based on these predicted values by inverse distance weighting. The municipalities of Laval and Montreal, having a highly urbanized land cover unrepresentative of the municipalities where horses were sampled, were excluded from the risk map. Risk categories were set at very low, low, high and very high for predicted values ranging from 0·0–0·25, 0·25–0·50, 0·50–0·75 and 0·75–1·00, respectively. The risk category that prevailed at the geographical location of each of the nine equine cases from the risk map validation dataset was assessed. Sensitivity of the risk map was assessed by comparing the geolocation of sick horses with the risk map categories using a cut-off of 0·5 for categorizing risk map areas as ‘at risk’ or ‘not at risk’.
Possible geographical clusters of seropositive or sick horses were explored using the Kulldorff scan statistic (SaTScan v. 9.3.1) [Reference Kulldorff22] and mapped in ArcGIS 10·2·2 (ESRI, USA). Scan statistics for high risk were computed on the combined clinical and serological datasets based on a Bernouilli model with the maximum cluster size representing 50% of the sample.
Ethical standards
Equine sampling for the serosurvey was approved by the Committee for ethical animal use of the Université de Montréal (certificate no. 12-Rech-1638). The authors assert that all procedures contributing to this work comply with the ethical standards of the relevant national and institutional guides on the care and use of animals in research.
RESULTS
Descriptive statistics for individual risk factors in horses and environmental risk factors around sampled barns are presented in Tables 1 and 2. On average, barns were mainly surrounded by agricultural lands and forests. On average, wooded wetlands represented approximately 3% of the selected area around the barns.
Table 1. Descriptive statistics and results from univariate logistic regression modelling EEEV serological status associated with individual variables using the serosurvey dataset (model 1)
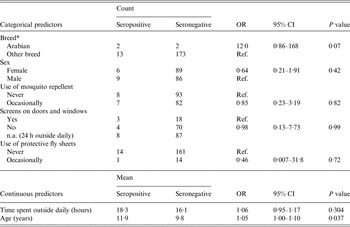
EEEV, Eastern equine encephalitis virus; OR, odds ratio (given by generalized estimating equations with an exchangeable correlation structure); CI, confidence interval; Ref., reference category; n.a.., not applicable.
* Ten breed categories were initially reported in the questionnaires. There was no statistically significant difference between breeds at P < 0·20 except for Arabian horses on univariate logistic regression.
Table 2. Distribution of the percentages of land surface of land cover categories within a 5 km radius of barns where horses of the study were sampled
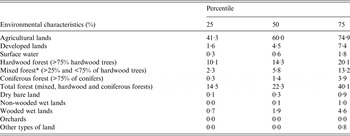
* Mixed forest = forested areas including <75% of hardwood or coniferous trees.
Results from the univariate logistic regressions are presented in Table 1 (individual variables) and Table 3 (environmental variables). On univariate regression, agricultural land was the only statistically significant environmental risk factor in model 1 at P < 0·05, while agricultural land, wooded wetland and forested land were all statistically significant risk factors at P < 0·05 in model 2. Correlation analysis revealed that total forest was highly correlated with hardwood forest (r = 0·90) and mixed forest (r = 0·88). The variable total forest was thus excluded from modelling. Results of the final multivariate logistic models are presented in Table 4. Agricultural lands were negatively associated with seropositivity in models 1 and 2 while wetlands were strongly and positively associated with seropositivity or disease in model 2. None of the individual variables had a confounding effect on the other parameters of model 1. The lowest QIC was obtained by using an exchangeable correlation structure. With a cut-off at >0·5 for classifying a predicted value as a positive outcome, the final logistic models 1 and 2 correctly classified 77% and 79% of the observations of the equine datasets, respectively. The area under the ROC curve was 0·77 for both models, suggesting a fair predictive power. When used on the validation dataset, Model 2 correctly classified 91% of the horses from the validation dataset with an AUC of 0·75.
Table 3. Odds ratios and 95% confidence intervals from univariate logistic regressions for environmental explanatory variables, models 1 and 2
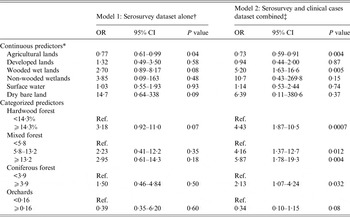
OR, Odds ratio; CI, confidence interval; Ref., reference category.
* OR presented for an increase of 10% of the area represented by the selected land cover within a buffer of 5 km radius around the barn.
† Based on serosurvey database, 2012 (n = 190 horses).
‡ Merged data from the serosurvey and the clinical cases database (n = 224 horses).
Table 4. Odds ratio and 95% confidence intervals for the final multivariate logistic models predicting EEEV serological status or disease in horses according to individual and environmental variables
EEEV, Eastern equine encephalitis virus; OR, odds ratio; CI, confidence interval.
* OR presented for an increase of 10% of the area represented by the selected land cover within a buffer of 5 km radius around the barn.
The analysis of DF-beta values in model 2 identified three municipalities from southern Lanaudière as having an unusual influence on the regression parameters. The analyses were thus recomputed while removing all horses from these three municipalities from the datasets. Variables retained in the final logistic model remained the same after removal of these influential observations with the OR increasing to 34% for wooded wetlands (4·15–5·55, P = 0·043) and with no changes in the OR for agricultural lands (0·75–0·75, P = 0·009) (results not shown).
The risk map based on the predicted values of logistic model 2 is presented in Figure 2. One of the nine equine clinical cases included in the risk map validation dataset occurred inside the model-defined very high-risk areas, three occurred inside a high-risk area, five occurred inside low-risk areas and none occurred inside very low-risk areas for an overall sensitivity of 44%. Eight of the nine cases (89%) occurred <1·5 km from a high-risk area.
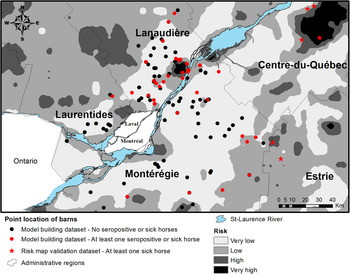
Fig. 2. Geographical risk distribution for eastern equine encephalitis virus in horses as predictive by the final multivariate logistic regression model.
One statistically significant (P < 0·001) cluster of seropositive or sick horses was detected with the Kulldorff scan statistic. This cluster had a radius of 11 km and was located over one of the largest wetlands in southern Quebec (Fig. 1).
DISCUSSION
Although EEEV viral activity has been relatively low in Quebec since the emergence of this virus in 2008, the current study allowed us to characterize EEE risk distribution over a large area of southern Quebec by using clinical and serological data from horses.
Wooded wetlands were strongly and positively associated with EEEV seropositivity or disease in horses. This is consistent with the ecology of the main vector of EEEV, Cs. melanura, which usually develops in wooded swamps with highly organic and shaded waters [Reference Morris and Monath23]. Moreover, a cluster of positive horses was detected within one of the largest wetlands in southern Quebec. Infected Cs. melanura were captured in this wetland in 2009 during an entomological study focused on EEEV in Quebec [Reference Vincent12]. There is still some uncertainty about the contribution of other vector species in the transmission of EEEV, some studies suggesting that Cs. melanura would be both the epidemic and enzootic vector [Reference Armstrong and Andreadis10], while others suggesting that bridge vectors (that feed on birds and large mammals) are generally needed for the spillover of the virus to occur [Reference Hassan11, Reference Molaei24]. Nevertheless, the current study underlines the important impact of living near ecosystems supporting EEEV enzootic cycles on the risk in horses and, it would be expected, humans. The wide geographical distribution of both equine cases and wooded wetlands throughout southern Quebec (Fig. 1) suggests that many areas of Quebec could sustain EEEV transmission. The mechanisms that could drive such a geographical dispersion, however, remain unclear. The only region of Quebec where equine EEE clinical cases were repeatedly reported from 2008 to 2010 was southern Lanaudière. All clinical cases detected in the other regions were reported in only 2008 with no cases subsequently. Thus, the mere presence of wetlands does not seem to be sufficient for EEE equine cases to occur from year to year in a given region and EEEV may need to be reintroduced yearly in most geographical areas for viral amplification to occur. Alternatively, EEEV may need to amplify within bird populations to a level sufficient for spill-over to horses, and conditions that would support this amplification may not occur on an annual basis. The phenomenon of recurrence of EEE three years in a row in southern Lanaudière would warrant further investigations on the potential mechanisms driving EEEV endemicity. The potential for transovarial transmission of EEEV in mosquito vectors is not well supported in the literature [Reference Howard14, Reference Morris and Srihongse25, Reference Weaver, Scott and Lorenz26] and, although a number of authors have hypothesized that EEEV could overwinter in various vertebrate hosts [Reference Owen27–Reference Bingham29], the overwintering mechanism of EEEV have not been clearly elucidated.
Along with wetlands, agricultural lands had a significant influence on the estimated risk. Given the natural breeding ecosystems of Cs. melanura, it would be biologically plausible that agricultural lands, which are usually drained, could act as barriers against the expansion of EEEV enzootic cycle outside of wetland areas. However, other vector species such as Aedes vexans, which feeds frequently on horses and which has sometimes been identified as a potential bridge vector for EEEV [Reference Cupp30], can be very abundant in agricultural areas of southern Quebec [Reference Maire and Aubin31]. The protective effect of agricultural lands suggests that these vectors would have a limited ability to contribute to EEEV dispersal. Limited competency of vector species that breed in agricultural lands and limited dispersal of viraemic avian hosts outside wetland areas during summer could possibly contribute to decreased risk of spillover of EEEV far away from wetlands. These findings support the hypothesis that Cs. melanura would contribute to progressive dispersal of EEEV from one swamp focus to other adjacent swamp foci during the summer season [Reference Howard14].
Breed was identified as a potential individual risk factor in the multivariate model based on the serosurvey dataset with a p-value slightly under the selected cut-off, Arabian horses having higher odds of being seropositive. However, the dataset included only two seropositive and two seronegative Arabian horses which may not be representative of the population of Arabian horses from Quebec. To our knowledge, no breed predilection has been reported previously for EEE in horses. However, most epidemiological studies on EEE in horses focused on environmental factors or management practices [9] and breed predilection for EEE may not have been reported. Further studies would be needed to more thoroughly assess the potential association between breed and the risk of exposure to EEEV or EEE clinical disease in horses.
Overall, multivariate models had a fair predictive power. With a cut-off at 0·5 for the dichotomous classification of risk areas, the risk map had a relatively weak sensitivity for correctly predicting areas where the nine sick horses were located from the risk map validation dataset. However, the fact that 89% of the sick horses from the risk map validation dataset lived <1·5 km away from a high-risk area suggested that, overall, the risk map had some potential for detecting areas where EEEV risk might occur. A number of factors may explain that sick horses were mainly found at the periphery of high-risk areas. Given that swamp areas are usually less suitable for the development of built environments, lower horse population densities and, consequently, lower counts of reported equine cases is expected from the centre of high-risk areas. Moreover, infected vectors can fly from wetland areas towards hosts living in areas dominated by other types of land covers, contributing to EEEV dispersal away from swamp foci. Finally, horses’ movements around their barns could have led to the virus being contracted a few kilometres away from the geographical locations used in this study. A more rigorous assessment of risk map validity would have required to know the geographical distribution of the equine ‘at risk’ population, data that are not currently available in Quebec. The total equine population in the study area was estimated to 11 000 horses in 2007. However, according to a previous study [Reference Rocheleau7], approximately 80–90% of this population would be vaccinated against EEEV, reducing the at risk population to approximately 2000 horses. The low total count of clinical cases of EEE in horses, which may be partly explained by the vaccination coverage, also limited our capacity to further evaluate the predicted risk map. Nevertheless, the risk map presented here may provide guidance for further surveillance and research in southern Quebec and represents a first step in the understanding of the geographical distribution of risk. Given that all clinical cases of EEE in horses from Quebec were reported between the months of July and October and that climatic conditions do not allow for vector activity in Quebec during winter, the reported risk distribution refers temporally to the July to November period. Risk is expected to be low during spring and null during winter.
Differences were observed among the univariate associations estimated from the seroprevalence dataset alone and from the combined serological and clinical datasets. These differences outlined some methodological issues which go beyond the simple lack of statistical power. One of these issues is related to the potential effect of misclassification of environmental variables: as the neutralizing EEEV antibodies (e.g. IgG) detected by PRNT are thought to be long-lasting in horses [Reference Gibbs, Long, Sellon and Long2] and as horses are often relocated from one barn to the other [Reference Rocheleau7], the exact time and geographical location of exposure is uncertain in seropositive horses and this misclassification can potentially bias associations towards the null. With acute equine EEEV clinical cases, which have an incubation period of a few days [Reference Gibbs, Long, Sellon and Long2], there is a high probability that infection occurred close to where the horse lived at the time of diagnosis thus limiting misclassification of exposure. This phenomenon may explain why the strength of the associations and the ability to detect statistically significant associations were higher in model 2 compared to model 1.
These models brought out new epidemiological knowledge that could be relevant to public health. Although the study area did not include the most densely populated areas of southern Quebec, villages and small towns can be found throughout each of the high-risk areas identified in the current study. Thus, there seems to be a real risk of human exposure in these areas. Given that disease or seropositivity in horses represent EEEV spillover out of the enzootic cycle to accidental hosts, the environmental risk factors identified in horses likely represent environments where spillover to humans may also occur. Confirming and characterizing risk of EEEV exposure in humans in highly populated areas such as Montreal would, however, require the use of other surveillance tools, such as entomological surveillance or the use of a different or complementary sentinel animal.
This study illustrates an approach to indirectly infer risk of EEEV exposure in humans from specific epidemiological information derived from the environment, therefore building grounds for public health prevention strategies. Risk factors outlined in this study seem consistent with the human risk factors previously reported in the northeastern United States. Further studies are needed to validate if risk areas are the same in horses and humans and to improve our understanding of the ecological pathways leading from EEEV introduction to virus amplification and finally to spillover of EEEV to accidental hosts in Canada. Quantitative and spatial analyses of animal epidemiological data can bring new insights about infection dynamics for rare or emerging arboviral diseases in a public health perspective. To our knowledge, this study is the first to characterize and map risk of EEEV exposure in Canada in the absence of systematic entomological surveillance. The approach could allow for increased preparedness for EEEV outbreaks and other emerging vector-borne diseases by targeting surveillance and planning interventions.
ACKNOWLEDGEMENTS
We thank all participating veterinary practitioners for their help in equine sampling and veterinarians of the Ministry of Agriculture, Fisheries and Food of Quebec for collecting data on equine clinical cases. This study was funded by the Public Health Agency of Canada.
DECLARATION OF INTEREST
None.


