


Obesity, an abnormal and substantial increase in adiposity, results in adverse health outcomes(1). Current trajectories suggest that up to 85 % of the US population could be overweight or obese by 2030(Reference Wang, Beydoun and Liang2,Reference Hruby and Hu3) . The first step in combatting excessive weight gain is dietary interventions that promote weight loss which are often prescribed by clinicians or taken upon by the individuals themselves. The most apt dietary intervention to achieve this is energetic restriction, where the individual decreases their total energy intake resulting in the negative energy balance necessary to induce weight loss(Reference Hruby and Hu3). However, given that the modern food environment is no longer complimentary to energy restriction(Reference Ridder, Vet and Stok4), this strategy suffers from extremely high failure rates(Reference Zheng, Lenard and Shin5) and often leads to fat overshooting during weight regain(Reference Dulloo, Jacquet and Girardier6). A net increase in energy expenditure (EE) is another way to induce a negative energy balance and thereby weight loss. Because most Americans do not practise the minimal recommended amount of daily physical activity(Reference Tuso7), despite decades long discussions of the benefits, it is problematic to rely on physical activity as a means to increase EE. Therefore, dietary choices that improve EE are of interest to health care professionals that employ weight management strategies.
Acute dietary fat intake may have an impact on EE. Diets that replace carbohydrates with fat have had success during weight loss interventions in the short-medium term when compared with diets that restrict fat(Reference Sackner-Bernstein, Kanter and Kaul8,Reference Volek, Sharman and Gómez9) , most likely due to passively decreasing energetic intake or increased fat oxidation. Yet, the type of fatty acid (FA) consumed may result in significantly different outcomes that are independent of total fat intake(Reference Field, Willett and Lissner10–Reference Imamura, Micha and Wu14). Since FA (MUFA, PUFA and SFA) have unique and complex effects on biological and physiological functions, it is negligent to categorise them together when investigating their effects on weight loss. So, although the health effects of different FA are well supported(Reference Milanski, Degasperi and Coope15,Reference Teng, Chang and Chang16) , their effects in relation to weight management, specifically EE, remain unclear. It is possible that the appropriate selection of FA could mimic the effects of an energetic deficit through an increase in postprandial EE, ultimately assisting in achieving a negative energy balance through food choice.
In addition to increased EE, when carbohydrates are replaced with dietary fat, a greater metabolic reliance on fat for energy occurs and thus fat oxidation increases(Reference Leckey, Hoffman and Parr17). However, until recently, this has only been examined in the scope of total fat intake rather than between individual FA(Reference Ludwig, Willett and Volek18). Despite the increased investigation into the metabolic effects of varying FA, studies report mixed results(Reference Polley, Miller and Johnson19–Reference Stevenson, Miller and Skillman25). Discrepancies in the literature may be the result of several study variations such as varying study populations, where most studies investigate the effects of FA composition in individuals with obesity who have been shown to have defective fat oxidation relative to their leaner counterparts(Reference Paton, Rogowski and Kozimor26). Variations in FA of interest or the percentage of energy provided in test meals may also be responsible. Sex differences across studies could also contribute to the uncertainty. Last, metabolic responses are generally measured for a minimum of 5 h due to the time it takes to digest and absorb nutrients, specifically dietary fat. However, a 5-h intermittent period represents the longest reported time on average that US adults go without eating which normally occurs during the sleeping hours(Reference Gill and Panda27). Since reports suggest that the average US adult eats regularly and throughout the day(Reference Kant and Graubard28,Reference St-Onge, Ard and Baskin29) , long measurement periods may reduce external validity given that by 5 h after consumption of a meal, another meal has most likely already been consumed. Determining the acute effects of varying FA on EE may provide strategies that sufficiently promote negative energy balance leading to better success in weight management. However, because individuals with obesity may have defective metabolic responses to high-fat (HF) meals, investigating those with obesity may not provide a clear picture of the effects for each FA composition. Further, due to the increased control measures that must be considered when investigating premenopausal women, this group has been underexplored in regard to the metabolic effects of individual FA.
Therefore, the purpose of this study was to examine the effect of three different fat-rich meals (rich in either SFA, MUFA or PUFA) on postprandial metabolic responses in premenopausal, normal-weight women. It was hypothesised that acute consumption of either SFA- or PUFA-rich meals would enact a greater metabolic response (EE, fat oxidation and dietary-induced thermogenesis) compared with the MUFA-rich meal.
Methods
Participants
Sixteen healthy normal-weight, premenopausal women between the ages of 18 and 40 years were recruited for this randomised, single-blind, crossover study. This study was conducted according to the guidelines in the Declaration of Helsinki, and all procedures involving human participants were approved by the Texas Christian University Institutional Review Board. Written informed consent was obtained by all participants prior to participation in the study. Inclusion criteria consisted of women between ages 18 and 40 years with a BMI between 18·5 and 24·9 kg/m2. Exclusion criteria included BMI > 24·9 kg/m2, having lost or gained more than 5 % of total body weight in the 3 months prior to screening, those currently on a weight loss diet or exercise programme, having any chronic disease such as diabetes, hypothyroidism, hyperthyroidism, cancer or any CVD, having undergone any surgeries that would affect swallowing or digestion, on a medically prescribed diet, possessing any food allergies, taking any medications that may interfere with the results of the study and having donated blood or plasma in the 20 d prior to screening.
Protocol
Participants reported to the Obesity Prevention Laboratory on four occasions, which included a screening visit and three separate testing visits with a minimum of 4 d between each visit. In addition, all visits took place during the participants’ follicular phase of the menstrual cycle (days 3 through 9), resulting in a 2–3-month measurement period for each participant since the minimum washout period between conditions only allowed for a maximum of two testing visits per menstrual cycle. Participants were instructed to maintain habitual dietary patterns and physical activity for the course of the study. Before each visit, including the screening visit, participants were instructed to abstain from food, supplements, medication, caffeine and exercise ≥ 12 h. For the screening visit, participants reported to the Obesity Prevention Laboratory after an overnight fast and measurements of height, body weight, waist/hip circumference, fasting blood glucose and RMR were obtained. RMR was measured for 30 min during the fasted state using indirect calorimetry with a ventilated hood (TrueOne 2400 Canopy System; ParvoMedics) under the recommended guidelines which include gas and flow/volume calibration, in duplicate, prior to testing(Reference Compher, Frankenfield and Keim30). Participants were asked to lie motionless in the supine position while awake throughout the measurement of RMR. All RMR measurements were conducted in the same climate-controlled room for each visit. Collection of RMR at screening was used to tailor each participant’s HF meal recipe to 35 % of the participant’s total daily energy needs.
On the day prior to testing visits, participants were instructed to consume a self-selected breakfast meal before 12.00 hours. Participants were instructed to consume a typical meal corresponding to their habitual diet and were required to eat that same meal before each visit. The day preceding each visit, participants were provided with all foods for lunch, dinner and snacks from a set menu where all items were 55 % carbohydrate, 15 % protein and 30 % fat and were provided in order to meet their total estimated energy needs as calculated by RMR × a factor of 1·6. Participants ate the exact same food and drink from the set menu before each visit, including the self-selected breakfast meal. For each study visit (visits 1–3), participants reported to the Obesity Prevention Laboratory at about 07.00 hours after an overnight fast of ≥12 hours as previously described. Height, body weight, body fat% (BodPod; Cosmed), waist/hip circumference, fasting blood glucose, (OneTouch Verio; LifeScan Inc.), blood pressure (Omron; Omron Healthcare) and RMR (TrueOne 2400 Canopy System; ParvoMedic) were measured at baseline while fasted. RMR at baseline for each visit was measured for 30 min.
High-fat meals and measurements of metabolic response
Following anthropometric, fasting blood glucose, blood pressure and baseline RMR measurements, participants were given their randomly assigned liquid HF meal (rich in either MUFA, PUFA or SFA) and instructed to consume the meal in its entirety within 5 min. The liquid meal was used to standardise time to consume the meal and to limit the amount of time from the first ‘bite’ to complete ingestion. Four ounces of water was provided following the consumption of the HF meal to ensure all of the meal was ingested. Each HF meal recipe was developed using a nutrient analysis software programme to calculate specific amounts of nutrients (The Food Processor; ESHA Research) and designed to provide the participants with 35 % of their calculated total daily energy needs. Total daily energy was determined by RMR measured at screening in kJ/d multiplied by a factor of 1·6(Reference Gerrior, Juan and Peter31). All meals had the same energy content specific to each participant’s estimated total daily energy needs, and the only difference between each HF meal was the type of FA used during each of the three visits. The composition for each liquid HF meal is presented in Table 1. Each HF meal was designed to provide 65 % of total energy from fat and 45 % of total energy from the FA of interest. Because the total energy content of each liquid HF meal was specific to each participant’s daily energy needs, there were small but negligible deviations between FA compositions across test meals. The main FA sources for each meal were: SFA, butter and palm oil; MUFA, extra-virgin olive oil and PUFA, sunflower and flaxseed oil.
Table 1. Liquid test meal composition
(Mean values with their standard errors; percentages)

Following complete consumption of the randomised HF meal, participants were instructed to lie supine without moving or sleeping, while respiratory gasses were collected using indirect calorimetry with a ventilated hood system every 30 min for 180 min. Respiratory gases were measured at 30, 60, 90, 120, 150 and 180 min postprandially. Respiratory gases were collected for the first 20 min at each time point, but only the final 15 min of that period were used to determine metabolic responses(Reference Compher, Frankenfield and Keim30). The remaining 10 min of each 30-min interval were used to collect other measurements not described in the present study, and to either provide participants with 4 oz of water (t = 60, 120 and 180 min) or to conduct duplicate gas calibrations (t = 30, 90, 150 min).
Calculations
Respiratory gas measurements used the Weir equation(Reference Weir32) to calculate postprandial EE and the Frayn(Reference Frayn33) equation to calculate substrate oxidation. The following equations assume no protein oxidation, so no collection of urinary nitrogen was required. Twenty minutes of respiratory gases were collected, but only the final 15 min were used in the analysis. The equations for substrate oxidation are: $\[\rm{Carbohydrate \,oxidation = (4\!\cdot\!56{\rm{ }} \times {\rm{ }}\dot VC{O_2}){\rm{ }}-{\rm{ }}(3\!\cdot\!21{\rm{ }} \times {\rm{ }}\dot V{O_2})\]$ $\[\rm{Fat\, oxidation = (1\!\cdot\!67{\rm{ }} \times {\rm{ }}\dot V{O_2}){\rm{ }}-{\rm{ }}(1\!\cdot\!701{\rm{ }} \times {\rm{ }}\dot VC{O_2})\]$
Dietary-induced thermogenesis was calculated by subtracting RMR from postprandial EE at each time point.
Statistical analyses
This is a secondary analysis as a part of a larger study, and therefore, the study was not powered to the presented study. To determine if our sample size was sufficient, we used G*Power 3.1.9.7(Reference Faul, Erdfelder and Lang34) to calculate the minimum sample size needed to yield 80 % power. Using a repeated-measures ANOVA with an effect size of 0·67 for the difference in postprandial RER between MUFA and PUFA as reported by Polley et al. (Reference Polley, Miller and Johnson19), an α = 0·05, and a conservative correlation coefficient of 0·3, we would require nine participants to achieve 80 % power. SPSS Statistics version 26 (IBM) was used, and all values are expressed as means and standard errors of the mean unless stated otherwise. All hypotheses and analytic plans were specified prior to data collection. Normality was tested using visual inspection of Q–Q plots. Differences between conditions, time and condition × time were analysed using an ANOVA with repeated measures. Sphericity was tested using a Mauchly’s test. In the instance that sphericity was violated, Huynh–Feldt corrections were employed(Reference Haverkamp and Beauducel35). Bonferroni correction was used for simple main effects analysis where a main effect or interaction was significant. AUC was used to calculate total change from baseline between conditions. Pearson product-moment correlations and simple linear regressions between metabolic measurements, fat mass (FM) and fat-free mass (FFM) were conducted. Normality, homoscedasticity and linearity were checked using visual inspection. No assumptions were violated, and no outliers were present. Multiple imputation was used for missing data. Missing data occurred at random for metabolic measurements on two of the forty-eight total study visits. Missing data for anthropometric measures occurred at random. Statistical significance was set at P ≤ 0·05.
Results
Participant characteristics
Sixteen premenopausal women of healthy weight status (BMI = 18·5–24·9 kg/m2) with a mean age of 23·1 (s e 0·7) years completed all study visits. Participant characteristics at screening are shown in Table 2. Participants’ characteristics at each visit are shown in Table 3. There were no significant differences between any participant characteristics across conditions. BMI remained within a healthy range for all participants for the duration of the study.
Table 2. Participant characteristics at baseline (n 16)
(Mean values with their standard errors)

Table 3. Participant characteristics in each condition (n 16)
(Mean values with their standard errors)

BF%, body fat percentage.
* n 14.
† n 13.
‡ n 15.
RMR, energy expenditure and dietary-induced thermogenesis
Importantly, RMR (t = 0 min) was not different between conditions. For postprandial EE, there was a significant main effect of condition (P = 0·042; η 2 = 0·19) and time (P < 0·001; η 2 = 0·79); however, no condition × time interaction was observed (η 2 = 0·04; see Fig. 1(a)–(c)). Post hoc analysis revealed significantly higher EE during the 3-h postprandial period for the HF SFA-rich meal v. the HF MUFA-rich meal (17·37 (se 0·54) v. 16·54 (se 0·47) kcal (72·68 (se 2·26) v. 69·20 (se 1·97) kJ); P = 0·04), but postprandial EE for the HF SFA-rich meal was not significantly different from the HF PUFA-rich meal (17·37 (se 0·56) kcal (72·68 (se 2·34) kJ)). The HF PUFA-rich meal showed a trend towards higher EE than the HF MUFA-rich meal (95 % CI −1·595, 0·035; P = 0·06). The 95 % CI is compatible with a true value of a mean difference of −1·6 towards one condition but only as high as 0·035 towards the other. Given the compatibility logic of CI, there is reason to believe that a true difference may exist for EE between PUFA and MUFA despite the insignificant probability value. The time course for EE can be found in Fig. 1(a). Despite significant differences in EE between conditions, no significant differences were observed for dietary-induced thermogenesis (MUFA = 1·87 (se 0·22) kcal (7·82 (se 0·92) kJ); PUFA = 2·18 (se 0·22) kcal (9·12 (se 0·92) kJ) and SFA = 2·05 (se 0·18) kcal (8·58 (se 0·75) kJ)) or dietary-induced thermogenesis AUC (MUFA = 11·20 (se 1·34) kcal × 3 h (46·86 (se 5·61) kJ × 3 h); PUFA = 13·07 (se 1·33) kcal × 3 h (54·68 (se 5·56) kJ × 3 h) and SFA = 12·28 (se 1·08) kcal × 3 h (51·38 (se 4·52) kJ × 3 h); η 2 = 0·05; see Fig. 1(d)).

Fig. 1. (a) Mean energy expenditure (EE) for each fatty acid (FA) composition across time. Each high-fat (HF) meal was consumed after the baseline time point. Results of a repeated-measures ANOVA revealed significant condition (P = 0·042; η
2 = 0·190) and time effects (P < 0·001; η
2 = 0·788) but following adjustments for fat-free mass (FFM), results were no longer significant (P > 0·05). (b) Mean change in EE from baseline for each FA composition. Baseline values are standardised at 0. Each value from time point 30 to time point 180 is calculated as the absolute value – the baseline value. (a and b) ![]() , MUFA;
, MUFA; ![]() , PUFA;
, PUFA; ![]() , SFA. (c) Average postprandial EE of all time points from 30 to 180 min. Results of a repeated-measures ANOVA revealed significant differences between FA compositions (P = 0·042), but following adjustments for FFM, results were no longer significant (P > 0·05). (d) Dietary-induced thermogenesis (DIT) AUC for each FA composition. Results of a repeated-measures ANOVA revealed no significant differences between FA compositions (P > 0·05). (c and d)
, SFA. (c) Average postprandial EE of all time points from 30 to 180 min. Results of a repeated-measures ANOVA revealed significant differences between FA compositions (P = 0·042), but following adjustments for FFM, results were no longer significant (P > 0·05). (d) Dietary-induced thermogenesis (DIT) AUC for each FA composition. Results of a repeated-measures ANOVA revealed no significant differences between FA compositions (P > 0·05). (c and d) ![]() , MUFA;
, MUFA; ![]() , PUFA;
, PUFA; ![]() , SFA.
, SFA.
Correlations
Correlations for each condition are shown in Table 4. Moderate-strong positive correlations between FFM and EE were observed and were statistically significant for SFA, PUFA and MUFA (see Fig. 2(a)). The combined correlation between FFM and EE was statistically significant (r 0·69; P < 0·001; Fig. 2(b)). Additionally, a moderate positive correlation was observed between FM and EE and was statistically significant for PUFA but was not statistically significant for FM and SFA, or MUFA. Because of the known relationship between FFM and EE(Reference Leibel, Rosenbaum and Hirsch36), we also included the average FFM across conditions as a covariate for EE and found that there were no longer main effects of condition or time after adjusting for FFM. Additionally, FFM was a significant covariate for EE (F (1,14) = 11·356; P = 0·005; η 2 = 0·448). Therefore, FFM significantly influenced EE given that when removed, the condition effect becomes significant. Finally, we observed a moderate positive correlation between FM and total fat oxidation (AUC), which was statistically significant for MUFA but there was no statistically significant correlation for SFA or PUFA (see Fig. 2(c)). The combined correlation between FM and total fat oxidation was not statistically significant (r 0·24; P = 0·145; Fig. 2(d)). In addition, a moderate negative correlation between RER AUC and FM was statistically significant for MUFA, but not for SFA or PUFA (see Fig. 2(e)). The combined correlation between FM and RER AUC was not statistically significant (r 0·21; P = 0·206; Fig. 2(f)). Correlations for each condition are presented in Table 4.
Table 4. Correlations

FFM, fat-free mass; EE, energy expenditure; FM, fat mass; FatOx, fat oxidation.
* Statistically significant at α = 0·05.

Fig. 2. (a) Association between fat-free mass (FFM) and energy expenditure (EE) for each condition. Pearson product-moment correlation coefficients revealed significant moderate to strong positive associations between FFM and EE for all conditions (SFA, r 0·66, P = 0·015; MUFA, r 0·67, P = 0·012; PUFA, r 0·76, P = 0·004). (b) Overall association between FFM and EE. Pearson product-moment correlation coefficients revealed a significant moderate to strong positive association between FFM and EE (r 0·69, P =< 0·001). (c) Association between fat mass (FM) and total fat oxidation (FatOx) (AUC) for each condition. Pearson product-moment correlation coefficients revealed moderate positive associations between FM and total FatOx for MUFA, but not for SFA or PUFA (SFA, r 0·01, P = 0·970; MUFA, r 0·62, P = 0·025; PUFA, r 0·14, P = 0·660). (d) Overall association between FM and total FatOx (AUC). Pearson product-moment correlation coefficient revealed a small non-significant association between FM and total FatOx (SFA, r 0·24, P = 0·145). (e) Association between FM and postprandial change in RER (AUC) for each condition. Pearson product-moment correlation coefficients revealed moderate positive associations between FM and postprandial change in RER for MUFA, but not for SFA or PUFA (SFA, r −0·09, P = 0·780; MUFA, r −0·55, P = 0·050; PUFA, r −0·09, P = 0·780). (f) Overall association between FM and postprandial change in RER (AUC). Pearson product-moment correlation coefficient revealed a small non-significant association between FM and total FatOx (SFA, r 0·21, P = 0·206). (a, c, e) ![]() , SFA;
, SFA; ![]() , MUFA;
, MUFA; ![]() , PUFA. (b, d, f)
, PUFA. (b, d, f) ![]() , overall.
, overall.
RER and substrate oxidation
Similar to RMR, RER at baseline was not different between conditions. There was a significant main effect of time for RER (P < 0·001; η 2 = 0·59), but no main effect of condition (η 2 = 0·001) or condition × time interaction was observed (η 2 = 0·07; see Fig. 3(a)–(c)). Postprandial RER changes occurred in a similar fashion across the 3-h time interval for all conditions. The time course for RER can be found in Fig. 3(a). Further, there were no significant differences in RER AUC over the 3-h postprandial period (MUFA = 0·08 (se 0·03); PUFA = 0·04 (se 0·05) and SFA = 0·08 (se 0·04); η 2 = 0·04; see Fig. 3(d)).
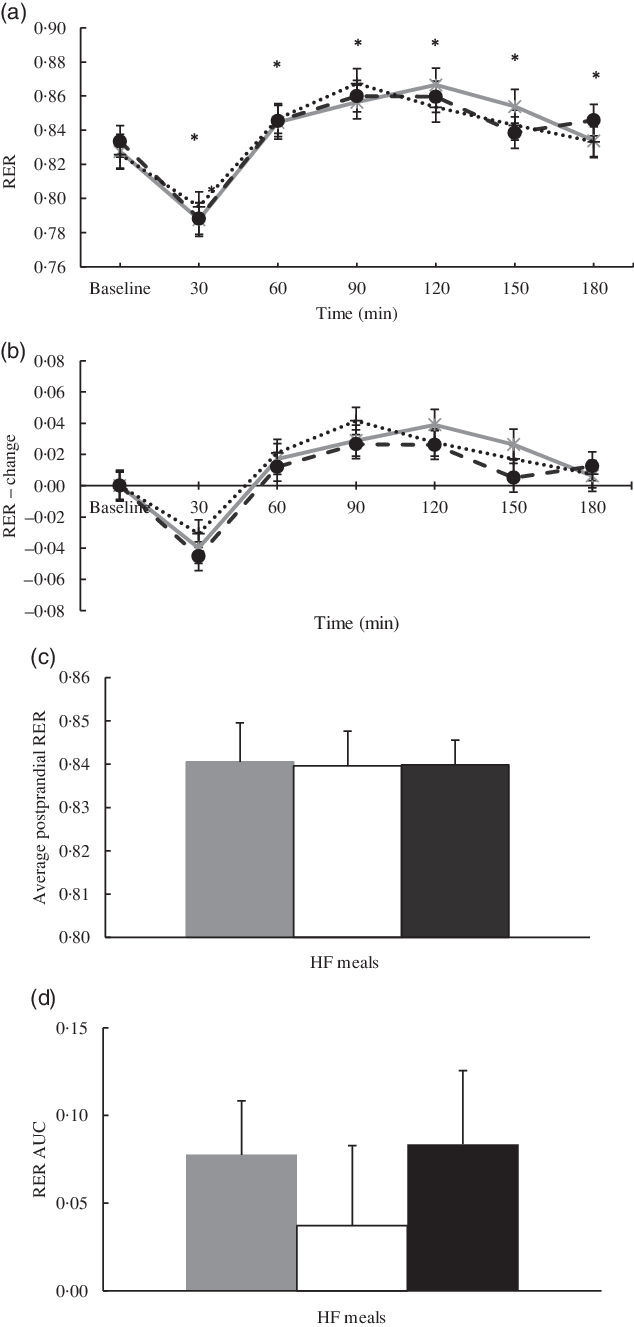
Fig. 3. (a) Mean RER for each fatty acid (FA) composition across time. Each high-fat (HF) meal was consumed after the baseline time point. Results of a repeated-measures ANOVA revealed significant time effects (P < 0·001; η
2 = 0·59). (b) Mean change in RER from baseline for each FA composition. Baseline values are standardised at 0. Each value from time point 30 to time point 180 is calculated as the absolute value – the baseline value. (a and b) ![]() , MUFA;
, MUFA; ![]() , PUFA;
, PUFA; ![]() , SFA. (c) Average postprandial RER of all time points from 30 to 180 min. Results of a repeated-measures ANOVA revealed no significant differences (P > 0·05). (d) RER AUC for each FA composition. Results of a repeated-measures ANOVA revealed no significant differences between FA compositions (P > 0·05). (c and d)
, SFA. (c) Average postprandial RER of all time points from 30 to 180 min. Results of a repeated-measures ANOVA revealed no significant differences (P > 0·05). (d) RER AUC for each FA composition. Results of a repeated-measures ANOVA revealed no significant differences between FA compositions (P > 0·05). (c and d) ![]() , MUFA;
, MUFA; ![]() , PUFA;
, PUFA; ![]() , SFA.
, SFA.
In addition, fat and carbohydrate oxidation at baseline were not different between conditions (NS). There was a significant main effect of time for fat oxidation (P < 0·001; η 2 = 0·51); however, no main effect of condition (η 2 = 0·04) or condition × time interaction (η 2 = 0·08) was witnessed (see Fig. 4(a)–(c)). There were no differences in fat oxidation AUC for the 3-h postprandial period (MUFA = 0·16 (se 0·21) g × 3 h; PUFA = 0·54 (se 0·24) g × 3 h and SFA = 0·21 (se 0·24) g × 3 h; η 2 = 0·08; see Fig. 4(d)). Similarly, there was a main effect of time for carbohydrate oxidation (P < 0·001; η 2 = 0·62) but no main effect of condition (η 2 = 0·03) or condition × time interaction (η 2 = 0·07; see Fig. 5(a)–(c)). Further, there was also no difference in carbohydrate oxidation AUC for the 3-h postprandial period (MUFA = 2·44 (se 0·46) g × 3 h; PUFA = 2·12 (se 0·72) g × 3 h and SFA = 2·78 (se 0·68) g × 3 h; η 2 = 0·08; see Fig. 5(d)).

Fig. 4. (a) Mean fat oxidation for each fatty acid (FA) composition across time. Each high-fat (HF) meal was consumed after the baseline time point. Results of a repeated-measures ANOVA revealed significant time effects (P < 0·001; η
2 = 0·51). (b) Mean change in fat oxidation from baseline for each FA composition. Baseline values are standardised at 0. Each value from time point 30 to time point 180 is calculated as the absolute value – the baseline value. (a and b) ![]() , MUFA;
, MUFA; ![]() , PUFA;
, PUFA; ![]() , SFA. (c) Average postprandial fat oxidation of all time points from 30 to 180. Results of a repeated-measures ANOVA revealed no significant differences (P > 0·05). (d) Fat oxidation AUC for each FA composition. Results of a repeated-measures ANOVA revealed no significant differences between FA compositions (P > 0·05). (c and d)
, SFA. (c) Average postprandial fat oxidation of all time points from 30 to 180. Results of a repeated-measures ANOVA revealed no significant differences (P > 0·05). (d) Fat oxidation AUC for each FA composition. Results of a repeated-measures ANOVA revealed no significant differences between FA compositions (P > 0·05). (c and d) ![]() , MUFA;
, MUFA; ![]() , PUFA;
, PUFA; ![]() , SFA.
, SFA.

Fig. 5. (a) Mean carbohydrate (CHO) oxidation for each fatty acid (FA) composition across time. Each high-fat (HF) meal was consumed after the baseline time point. Results of a repeated-measures ANOVA revealed significant time effects (P < 0·001; η
2 = 0·618). (b) Mean change in CHO oxidation from baseline for each FA composition. Baseline values are standardised at 0. Each value from time point 30 to time point 180 is calculated as the absolute value – the baseline value. (a and b) ![]() , MUFA;
, MUFA; ![]() , PUFA;
, PUFA; ![]() , SFA. (c) Average postprandial CHO oxidation of all time points from 30 to 180. Results of a repeated-measures ANOVA revealed no significant differences (P > 0·05). (d) CHO oxidation AUC for each FA composition. Results of a repeated-measures ANOVA revealed no significant differences between FA compositions (P > 0·05). (c and d)
, SFA. (c) Average postprandial CHO oxidation of all time points from 30 to 180. Results of a repeated-measures ANOVA revealed no significant differences (P > 0·05). (d) CHO oxidation AUC for each FA composition. Results of a repeated-measures ANOVA revealed no significant differences between FA compositions (P > 0·05). (c and d) ![]() , MUFA;
, MUFA; ![]() , PUFA;
, PUFA; ![]() , SFA.
, SFA.
Discussion
Our study compared metabolic responses between three HF meals rich in either SFA, MUFA or PUFA in premenopausal, normal-weight women. We purposely provided our participants with a larger quantity of FA of interest(Reference Soares, Cummings and Mamo21,Reference Clevenger, Stevenson and Cooper23,Reference Clevenger, Kozimor and Paton24) and total energy from fat(Reference Piers, Walker and Stoney20,Reference Soares, Cummings and Mamo21,Reference Casas-Agustench, López-Uriarte and Bulló37–Reference Flint, Helt and Raben39) in their HF meals than prior studies and tailored our meals to the specific energy needs of each participant to enact a detectable physiological response. Our study found that consumption of a HF meal rich in SFA led to a significant increase in EE compared with a HF meal rich in MUFA in the short, 3-h postprandial period. However, after adjusting for FFM, EE was no longer significantly different between conditions or time points showing that FFM may drive EE regardless of the FA composition of a meal. There was also a significant moderate positive correlation between FM and total fat oxidation (AUC) following a MUFA-rich meal and a moderate negative correlation between FM and total RER change (AUC) following a MUFA-rich meal, showing that more FM resulted in greater fat oxidation following consumption of the MUFA meal only. Taken together, our results suggest that measures of body composition (FM and FFM) may influence EE and fat oxidation more than the type of FA. Increases in FFM may promote negative energy balance to a greater degree than FA selection, and fat oxidation is increased following MUFA consumption in those that possess more FM. So, although this was not originally proposed to be a mechanistic study, our results reveal potential mechanisms that may explain our findings.
Consumption of an SFA-rich meal resulted in greater EE than meals enriched in MUFA but not PUFA, which, to our knowledge, has not been previously reported(Reference Clevenger, Stevenson and Cooper23,Reference Clevenger, Kozimor and Paton24,Reference Casas-Agustench, López-Uriarte and Bulló37) . Although not statistically significant, the HF PUFA-rich meal in our study showed a trend towards statistical significance when compared with the HF MUFA-rich meal. Based on the visual plot for postprandial EE in our study, one could assume that both PUFA- and SFA-rich meals have similar and greater effects on postprandial EE over 3 h than a MUFA-rich meal. This does, however, contradict findings from similar studies which have mixed results(Reference Clevenger, Stevenson and Cooper23,Reference Casas-Agustench, López-Uriarte and Bulló37–Reference Krishnan and Cooper40) . The difference in outcomes between our study and others is most likely due to the body composition differences across populations. Men have much higher levels of FFM than women which may override any potential physiological differences between FA compositions in relation to EE(Reference Clevenger, Stevenson and Cooper23,Reference Flint, Helt and Raben39) . It may also have been difficult to see differences in EE if the HF test meals employed were not tailored to the individual participants’ daily energy needs, as was done in our study, especially when examining overweight individuals or individuals with obesity(Reference Piers, Walker and Stoney20,Reference Soares, Cummings and Mamo21,Reference Clevenger, Stevenson and Cooper23,Reference Flint, Helt and Raben39) . Given the large range in the obese BMI classification relative to other BMI classifications, potential weight differences in a seemingly homogenous sample could lead to underfeeding and a subsequently reduced metabolic response. It is also possible that the differences in adiposity between our participants and the participants of other studies explain the difference in outcomes. It has been reported that increased adiposity results in a faulty metabolic response to dietary fat that reduces EE(Reference Schwartz, Woods and Seeley41–Reference Leibel43); however, this remains unclear and is subject to a number of environmental factors not accounted for by this study(Reference Marrades, Martínez and Moreno-Aliaga44). Finally, our study employed a liquid meal rather than a solid meal, as was used in other comparable studies(Reference Casas-Agustench, López-Uriarte and Bulló37,Reference Jones, Jew and AbuMweis38) . The level of viscosity in a meal is directly related to the time taken for gastric emptying to occur(Reference Fisher, Malmud and Bandini45,Reference Zhu, Hsu and Hollis46) . Therefore, given that our study test meals were liquid, it is likely that gastric emptying occurred much faster resulting in increased EE(Reference Clegg and Shafat47) relative to studies employing solid test meals. Although there are several potential reasons that we observed a significant difference in EE, clinical meaningfulness is limited, given the small differences between conditions. Therefore, it is inadvisable to employ more SFA for such a small increase in EE compared with MUFA, due to the negative health implications of increased SFA(Reference Milanski, Degasperi and Coope15,Reference Teng, Chang and Chang16) . Replacing MUFA for more SFA for long-term weight management from an EE standpoint may actually do more harm than good, in light of the small increase in EE following an SFA-rich meal may not be large enough to result in a meaningful difference in overall negative energy balance.
To our knowledge, we are the first to show that after adjusting for FFM, there were no longer any significant differences in EE between FA type. Our study is also the first to report FFM as a significant covariate for postprandial EE following HF meals of varying FA compositions. Although it has been reported that FFM is a determinant of EE following a meal(Reference Westerterp48), our findings of FFM as a significant covariate, in the absence of either condition or time effects, show that FFM has a unique relationship with EE independent of FA composition. This is likely because FFM has meaningful overlap with skeletal muscle and is a strong predictor of EE due to the increased energy demands(Reference Leibel, Rosenbaum and Hirsch36,Reference MacLean, Blundell and Mennella49,Reference Grannell, Al-Najim and Mangan50) . The energy demands of skeletal muscle are illustrated in an individual’s RMR(Reference Blundell, Caudwell and Gibbons51), which accounts for approximately 60 % of EE(Reference Ravussin, Lillioja and Anderson52). Therefore, if FFM is the primary driver of EE, then any increases in EE are most likely due to the amount of FFM an individual possesses. In our case, it appears that individuals with greater amounts of FFM possess the ability to overcome any different physiological effects across FA compositions in relation to EE. Because of the inherent relationship between FFM and EE, statistical models should always adjust for FFM prior to making any inferences, regardless of the intervention. Interestingly, only one other study reported adjusting for FFM during analysis of postprandial EE after consuming HF meals rich in different FA(Reference Clevenger, Stevenson and Cooper23). However, it is difficult to compare our study to theirs, as there were no significant differences in EE across FA types before or after controlling for FFM. The difference between our study and the study by Clevenger et al.(Reference Clevenger, Stevenson and Cooper23) could be that the increased adiposity in obese participants resulted in abnormal body composition phenotypes characterised by high levels of FM relative to levels of lean body mass(Reference Prado, Wells and Smith53) that may disrupt normal metabolic processes. One way to measure this is by calculating the ratio of FM:lean body mass which may provide insight to the potential metabolic dysfunctions that occur when these tissues are disproportionate(Reference Prado, Wells and Smith53–Reference Lauretani, Russo and Bandinelli55). The participants in the study conducted by Clevenger et al.(Reference Clevenger, Stevenson and Cooper23) reported a FM:lean body mass ratio just above the 50th percentile based on the reference values outlined by Xiao et al. (Reference Xiao, Purcell and Prado56) that are based on sex, age and BMI, whereas our sample was just above the 5th percentile based on sex, age and BMI. Therefore, it is possible that abnormal body composition components may impede on the relationship between FFM and EE, and studies that employ overweight and obese populations should consider this relationship in future designs.
Despite our study’s lack of significance for substrate oxidation, our study is the first to find a significant relationship between FM, total fat oxidation and RER AUC following a MUFA-rich meal in premenopausal, normal-weight women. This relationship, however, was not observed for HF meals rich in SFA or PUFA. Interestingly, we were able to detect this relationship in the absence of obesity, where total FM across our participants was small. Moreover, when we adjusted for FM in our analysis, FM was not a significant predictor of any fat oxidation-related metric measured in our study showing that the relationship between FM and fat oxidation following a HF meal is specific to the consumption of MUFA. There are a few potential reasons why this relationship was observed, although the underlying reasons are still not fully understood. First, MUFA and PUFA have shown greater stimulation of PPAR than SFA(Reference Piers, Walker and Stoney20,Reference Kliewer, Sundseth and Jones57) , specifically PPARα, which has shown to increase fat oxidation(Reference Fruchart, Duriez and Staels58). Our study also used extra-virgin olive oil as the main MUFA contributor in the HF MUFA-rich test meal. In rodent models, olive fruit extracts have shown to up-regulate PPARα and subsequent utilisation of FA in hepatic tissue(Reference Kim, Koppula and Sung59,Reference Domínguez-Avila, González-Aguilar and Alvarez-Parrilla60) , although this does not explain the relationship between FM and MUFA which is less clear. HF MUFA-rich diets have also shown to increase adiponectin mRNA gene expression which assist in the breakdown of FA(Reference Paniagua, Gallego de la Sacristana and Romero61). It is possible that a relationship between increased FM and greater adiponectin gene expression exists and is mediated by MUFA consumption, although this may be nullified as an individual approaches obesity or insulin resistance. Another reason for the observed relationship could be the metabolic fates of MUFA in adipose relative to unsaturated FA(Reference Bergouignan, Momken and Schoeller62). MUFA and unsaturated FA vary in their storage and transportation which may have specific metabolic consequences relative to levels of FM(Reference Bergouignan, Momken and Schoeller62). The FA composition of adipose tissue is predominately MUFA, and studies show this to be true regardless of the dietary intake of MUFA or SFA(Reference van Staveren, Deurenberg and Katan63–Reference Hunter, Rimm and Sacks65). Adipose tissue preferences for FA mobilisation occur based on degree of saturation, where mobilisation increases as degree of unsaturation increases(Reference Bergouignan, Momken and Schoeller62,Reference Raclot and Groscolas66) . It appears that in the postprandial state, where humans spend most of their time(Reference Piers, Walker and Stoney20), there is a level of selective division in cellular metabolism that prefers oleate from the adipose tissue rather than from the diet(Reference Yew Tan, Virtue and Murfitt67). Therefore, when adipocytes are larger in size (i.e. greater FM), they may have a greater capacity to store and mobilise MUFA in the postprandial state, which may be why we were able to observe this relationship. Further, it has been demonstrated that increased FM is associated with an increase in Δ9 desaturase activity(Reference Yew Tan, Virtue and Murfitt67), which has shown to desaturate C16 FA and result in more unsaturated FA in adipose tissue which may allow for increased oxidation of MUFA from adipocytes.
The relationship between FM and fat oxidation following MUFA consumption is supported by several studies(Reference Polley, Miller and Johnson19–Reference Piers, Walker and Stoney22). Although direct relationships between fat oxidation and FM were not specifically examined, Piers et al.(Reference Piers, Walker and Stoney20) showed that fat oxidation increased with an increase in waist circumference after a MUFA meal, while Soares et al. (Reference Soares, Cummings and Mamo21) found similar results in obese postmenopausal women who likely go through increased FM accumulation during the menopause transition(Reference Greendale, Sternfeld and Huang68). Piers et al. (Reference Piers, Walker and Stoney22) also reported reductions in FM without changing total energy or fat intake after dietary substitution of SFA with MUFA. Despite the potential relationship between MUFA and fat oxidation, our study was unable to show differences in acute carbohydrate or fat oxidation between HF meals enriched in either SFA, MUFA or PUFA. However, this supports the findings of several comparable studies(Reference Clevenger, Stevenson and Cooper23,Reference Clevenger, Kozimor and Paton24,Reference Casas-Agustench, López-Uriarte and Bulló37–Reference Flint, Helt and Raben39,Reference Kien and Bunn69) that employed a %FA of interest of at least 40 % over a 5 h period. These studies employed a wide range of BMI and all come to similar findings, so underlying mechanisms may provide a better explanation. One possibility is that the percentage of total energy from fat (50–70 %) in the test meals from some studies(Reference Clevenger, Kozimor and Paton24,Reference Casas-Agustench, López-Uriarte and Bulló37–Reference Flint, Helt and Raben39) may have caused an imbalance between fat intake and fat oxidation(Reference Schutz, Flatt and Jéquier70), where the amount of fat consumed promoted storage of dietary fat rather than oxidation. It has been reported that it can take several days to achieve a balance between fat intake and fat oxidation(Reference Polley, Miller and Johnson19,Reference Stevenson, Miller and Skillman25,Reference Schrauwen, van Marken Lichtenbelt and Saris71) , which may have been why our study, among others, was unable to see differences.
One limitation of our study is that our test meals were designed to be 35 % of our participants’ estimated total daily EE. While this allowed our test meals to be specific to our participants, there is the possibility of estimation error(Reference Woods, Garvican-Lewis and Rice72). Yet, this allowed us to tailor the test meals to each participant’s needs v. serving isoenergetic test meals for all participants. Our test meals also contain a large amount of fat relative to standard American diets. However, it is not uncommon for Americans to consume an acute HF meal on regular occasions, so we believe that the applicability of our test meals renders them appropriate. We only controlled diet for 1 d prior to testing, but there were no differences in baseline substrate oxidation or RMR, and all meals provided on the day prior to testing contained the same dietary fat content. It is possible that our 3-h testing duration underestimated the total postprandial response to HF based on the time needed for digestion and absorption to occur after a large meal. However, in most cases, at 180 min following consumption of the test meal, measurements approached baseline values or had begun to descend back to baseline. It is also important to measure shorter periods given that Americans spend most of their day in the post or interprandial state and rarely go longer than 3 h without consuming either another meal or a snack.
In conclusion, our study showed in premenopausal, normal-weight women that FFM is the most significant contributor to EE regardless of the FA composition of a HF meal. Therefore, we conclude that increases in FFM, specifically skeletal muscle, are more important in achieving a negative energy balance than selection of FA type, and health care professionals should consider this when prescribing weight loss interventions. Although it is well known that significant increases in FFM are necessary to see increases in EE, the maintenance of existing FFM during weight loss and weight management may limit the decreases in EE seen during weight loss when FFM is lost unintentionally. Limiting decreases in EE by maintaining FFM may help improve the failure rate of dietary interventions that lead to weight regain from losses in EE. We also conclude that MUFA consumption is associated with increased fat oxidation, a process that may be mediated by the amount of FM an individual possesses. The underlying mechanisms for the relationship between FM, MUFA and total fat oxidation are unknown, and more research is necessary. Future studies should investigate the underlying mechanisms that explain how the level of FM mediates fat oxidation following MUFA consumption. Further, future studies should investigate the utility and feasibility of dietary strategies that maintain FFM rather than absolute weight loss.
Acknowledgements
We would like to thank both Miguel Lopez and Danielle Rivera, undergraduate students from the Department of Nutritional Sciences, for their contribution to data collection.
This work was supported by the TCU Science and Engineering Research Center (SERC grant no. 150321). The SERC had no role in the design, analysis or writing of this article.
A. J. G.: data collection, data analysis and writing of the manuscript. J. L. W.: formulation of research questions, designing the study, data collection and writing of the manuscript.
There are no conflicts of interest.


