


Undernutrition is one of the leading causes of morbidity in developing countries, and it is estimated that 45 % of deaths in children under 5 years of age are associated with malnutrition( 1 ). Since 1990, hunger and childhood mortality have declined by 50 %; however, in 2015, an estimated six million children under the age of 5 years died, and one-third of children in developing countries still show some degree of primary malnutrition, resulting from protein–energy deficiency( Reference Liu, Oza and Hogan 2 , 3 ). Children are especially vulnerable to malnutrition owing to their rapid growth rate and high energy demand to permit cognitive development, skeletal growth, muscle development and fat deposition( Reference DeBoer, Lima and Oría 4 ). In addition, undernutrition can lead to a weakened immune system. This can result in persistent or chronic infection, which may lead to additional complications, including wasting from rapid weight loss, secondary infections, changes in intestinal architecture and long-term impacts on productivity( Reference Victora, Adair and Fall 5 ). Malnutrition is also associated with distinct changes in intestinal bacterial populations with the microbiota of malnourished children considered ‘immature’ and difficult to reverse( Reference Blanton, Barratt and Charbonneau 6 ). Disruptions in the development of the intestinal architecture and microbiota often lead to recurring illness, from which the child may never fully recover( Reference Drozdowski, Thomson and Clandinin 7 ), with cognitive and motor deficits appearing by 5 years of age( Reference Grantham-McGregor, Cheung and Cueto 8 , Reference Bhutta, Ahmed and Black 9 ). Thus, the formation of the small intestine during childhood is crucial to long-term health, as the absorption of nutrients and defence against pathogens are established during this period.
The availability of an animal model that closely mimics human gastrointestinal physiology is key to translational research on preventative and therapeutic agents to combat the diarrhoeal illnesses commonly suffered by undernourished children( Reference Ziegler, Gonzalez and Blikslager 10 ). To this end, we have previously developed a pig model of childhood malnutrition( Reference Garas, Feltrin and Hamilton 11 ) and here we have extended this model to include bacterial challenge. Interventions that supply nutrients, as well as hydration, are key to improving the health of those suffering from the cyclical nature of malnourishment and diarrhoea. One possible therapy is milk containing the antimicrobial lysozyme. Lysozyme is an antimicrobial enzyme produced in secretions (including tears, saliva and breast milk) that cleaves peptidoglycan in bacterial cell walls( Reference Masschalck and Michiels 12 ). In milk, it is thought to play a vital role in innate immune function at mucosal surfaces and shaping neonatal gut bacteria( Reference Walker 13 , Reference Lönnerdal 14 ). Goats producing human lysozyme (hLZ) at 68 % of levels found in human milk were developed in order to improve udder health, dairy shelf-life and processing and health of those consuming the milk( Reference Maga, Shoemaker and Rowe 15 ). Previous work using the pig as a human-relevant animal model has shown that in the context of healthy animals hLZ milk can alter faecal microbiota( Reference Maga, Desai and Weimer 16 ), gut histology and gene expression( Reference Cooper, Brundige and Reh 17 ) in a beneficial manner and treat( Reference Cooper, Garas Klobas and Maga 18 ) and prevent( Reference Garas, Cooper and Dawson 19 ) enterotoxigenic Escherichia coli (ETEC)-induced diarrhoea. This study was designed to develop a malnourished infection model in young pigs in order to investigate any protective effects of consuming goat or hLZ milk before ETEC infection.
Methods
Animals, housing, diet and milk supplementation
In all, 3-week-old male and female Hampshire–Yorkshire cross pigs were supplied by the UC Davis Swine Facility, a specific-pathogen free facility. All pigs were weaned at 21 d of age and fed a post-weaning adaptation feed (21 % protein, 5 % fat) ad libitum for 4 d. Pigs were then divided into full-fed (FF) control and malnourished (Mal) groups balanced for litter, sex and weight. The FF pigs (n 6) were housed at the swine facility for the duration of the experiment and fed a standard commercial grower pig diet (18·7 % protein and 6 % fat) ad libitum (Table 1). Pigs in the malnourished groups (n 30) were transported to a separate facility where they were housed individually in a temperature-controlled room (26–28°C) with ad libitum access to water. To induce a state of malnourishment, pigs were fed a protein–energy-restricted diet (14·2 % protein and 6 % fat; gestation diet deficient in lysine, an essential amino acid, Table 1) in restricted amounts (3 % body weight/d). Feed was divided into two equal portions fed twice daily, in the morning and evening, for 3 weeks. In a previous study, this dietary scheme was shown to induce changes indicative of moderate malnutrition compared with healthy pigs fed a standard commercial diet( Reference Garas, Feltrin and Hamilton 11 ).
Table 1 Ingredient composition of experimental dietsFootnote *
* From weeks 3 to 5, the malnourished diet was supplemented with goat or human lysozyme milk, which provided 26·7 and 26·3 g/kg of protein, respectively, and 31·7 and 28·9 g/kg of fat, respectively.
After 3 weeks of dietary restriction, pigs continued to receive the restricted diet and were supplemented with milk for a further 2 weeks. Milk was collected by machine from non-transgenic control goats (goat milk) and hLZ transgenic goats (hLZ milk) in mid-lactation and batch-pasteurised at 65°C for 5 s every other day and stored at 4°C. Milk samples were collected after pasteurisation for Western blot analysis to confirm the presence of hLZ. Malnourished pigs were divided into groups balanced for litter, sex and weight, and fed no milk (Mal; n 10), goat milk (MalGoat; n 10) or human lysozyme milk (MalhLZ; n 10) for 2 weeks (Fig. 1), receiving 250 ml of the respective milk delivered twice daily in metal feeding pans (QC Supply). After 2 weeks of milk supplementation, a subset of each group (n 4/group) received ETEC challenge. During the challenge period, pigs continued to receive the restricted diet and milk supplementation.
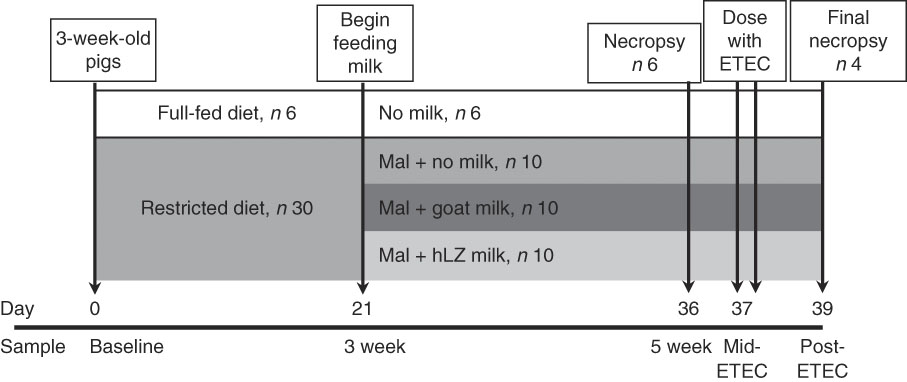
Fig. 1 Experimental design and sampling time points. Starting at weaning, 3-week-old pigs were fed a standard diet (full-fed, n 6) or a protein–energy-restricted diet (n 30) for a period of 3 weeks to induce malnutrition. Beginning on day 21 of the trial, malnourished (Mal) pigs were divided into three groups (n 10/group) and supplemented with goat milk, human lysozyme (hLZ) milk or no milk twice daily for 2 weeks. On day 36, six pigs in each groups were necropsied for sample collection (5-week time point), and on day 37 the remaining pigs were challenged with enterotoxigenic Escherichia coli (ETEC) twice at 12-h intervals and necropsied 2 d later (day 39) for sample collection.
Personnel were blinded to the milk treatment to prevent observational bias throughout the experiment including during data collection.
Weight was monitored every 2 d and snout-rump length and thoracic circumference were collected for all animals at baseline (day 0), after 3 weeks on standard or restricted diet (day 21), after 5 weeks (day 36) and for pigs that received ETEC on day 39. Z-scores were calculated by dividing weight (kg) by length (cm) ratio for each pig, subtracting the average ratio of a FF pig and then dividing by the sd of the FF pig ratio (((Mal pig weight/length)−(average FF pig weight/length))/(FF pig sd)). All housing, feeding and experimental protocols followed the Association for Assessment and Accreditation of Laboratory Animal Care International-approved practices and were approved by the UC Davis Institutional Animal Care and Use Committee. All animals were observed twice daily at feeding time, until administration of ETEC, when they were observed every 6 h.
Enterotoxigenic Escherichia coli culture and administration
Starting on the morning of day 37, four pigs in each treatment group (malnourished no milk (MalE), malnourished+goat milk (MalGoatE) and malnourished+human lysozyme milk (MalhLZE)) were dosed two times at 12-h intervals with 2×10⁷ colony-forming units (CFU) of porcine-specific ETEC O149 strain (ECL 8559; LT:STa:STb:East1:paa:hemβ:F4). This ETEC was isolated from a pig with clinical diarrhoea at weaning and was obtained from the E. coli Laboratory at the Université de Montréal( Reference Fairbrother, Nadeau and Gyles 20 ). Bacteria were grown in tryptic soya broth and enumerated as previously described( Reference Garas, Cooper and Dawson 19 ), resuspended in sterile saline to a concentration of 2×10⁶ CFU/ml and stored at 4°C until dosing. Each pig was dosed with 10 ml of solution (2×10⁷ total CFU) at both time points.
Blood samples
Whole blood and serum samples were collected from the superior vena cava on day 0 (‘baseline’), day 21 after 3 weeks of standard or restricted diet (‘3 weeks’), day 36 after 5 weeks of standard or restricted diet (with and without milk supplementation) (‘5 weeks’), day 38 approximately 32 h after the first ETEC dose (Mid-ETEC) and day 39 (Post-ETEC) using heparin and additive-free collection tubes. Complete blood counts (CBC) and serum chemistry panels were analysed by the UC Davis Veterinary Medicine Teaching Hospital Clinical Diagnostic Laboratory using the ADVIA 120 hematology system (Siemens Healthcare Diagnostics Inc.) and Cobas 6000 C501 Clinical Chemistry Analyzer (Roche Diagnostics), respectively. A total of thirteen CBC and nineteen blood chemistry parameters were analysed.
Activity and faecal scores
Activity of the pigs and stool consistency was evaluated twice daily starting on day 12, using a scale ranging from 1 to 4 for activity (1=lethargic; 4=normal activity) and the same scale ranging from 1 to 4 (1=watery diarrhoea; 4=normal consistency) for stool consistency (modified from Smiricky et al.( Reference Smiricky, Grieshop and Albin 21 )).
Necropsy, histology and barrier function
At necropsy, pigs were sedated with tiletamine HCl and zolazepam HCl (Telazol®; Zoetis Inc.) before blood draw, and then euthanised with sodium pentobarbital (Fatal Plus®; Vortech Pharmaceuticals Ltd). Pancreas, liver and intestine were removed and weighed immediately after euthanasia. Small intestine length was determined and used to calculate the midpoint of the small intestine to standardise a location for collecting jejunum samples. Tissue samples from the duodenum (10 cm distal to the pyloric sphincter), jejunum (mid-point) and ileum (20 cm proximal to the ileocaecal junction) were collected and rinsed with PBS to remove intestinal contents before fixing in 4 % buffered formalin solution. Samples were processed, stained with haematoxylin and eosin, imaged and villi length and width, crypt depth and lamina propria thickness measured for five well-oriented crypt–villi units per sample as previously described( Reference Garas, Cooper and Dawson 19 ).
Barrier function was assessed ex vivo by preparing and mounting jejunum tissue in Ussing chambers (Physiological Instruments) with electrical conductance and the flux of FITC-4000 (FD-4; Sigma-Aldrich) used to measure paracellular permeability (flow between cells) and the flux of horseradish peroxidase (HRP Type II; Sigma-Aldrich) used to measure transcellular transport (flow within cells), as previously described( Reference Garas, Feltrin and Hamilton 11 ).
Bacterial translocation into tissues
Spleen, liver and mesenteric lymph node tissues were collected aseptically at necropsy, rinsed with sterile PBS and stored on ice until homogenisation (within 1 h of sample collection). Approximately 100 mg of each tissue was homogenised in sterile PBS and 100 and 200 μl of each sample was plated on sheep blood agar. Plates were incubated at 37°C for 48 h at which point the number of total CFU were counted. Number of CFU was calculated per g of homogenised tissue.
Extraction and amplicon sequencing of bacterial DNA from faeces
Faecal samples were collected on day 0 before starting the restricted diet (baseline), day 21 (3 weeks), on day 36 (5 weeks), day 38 approximately 32 h after the first ETEC dose (Mid-ETEC) and day 39 (Post-ETEC) and stored at −20°C. Bacterial DNA was extracted using the ZR Fecal DNA MiniPrep kit (Zymo Research). Samples from the 3-week time point gathered in a related trial from an additional fourteen malnourished animals and three FF controls( Reference Garas, Feltrin and Hamilton 11 ) were also included. Samples were PCR-amplified as previously described in Mon et al.( Reference Mon, Saelao and Halstead 22 ) using primers specific to the V4 variable region of the bacterial 16S ribosomal RNA gene using forward primer F515 (5′-NNNNNNNNGTGTGCCAGCMGCCGCGGTAA-3′) with unique 8-bp barcodes (N) to allow for sample multiplexing and linker region (bases GT) for sequencing on the Illumina MiSeq platform, and reverse primer R806 (5′-GGACTACHVGGGTWTCTAAT-3′). PCR reactions were performed in triplicate 25-μl reactions, and the triplicates for each sample combined after amplification and run on a gel to determine relative concentration of PCR product. Resulting PCR products were pooled and purified using the QIAquick PCR Purification Kit (Qiagen) and submitted to the University of California Davis Genome Center DNA Technologies Core for 250-bp paired-end sequencing using the Illumina MiSeq platform.
RNA extraction, complementary DNA synthesis and gene expression analysis by quantitative RT-PCR
Tissues from the duodenum, jejunum and ileum were collected at necropsy, flash-frozen in liquid N2 and stored at −80°C until further processing. Total RNA was extracted using TRIzol® reagent (Life Technologies), RNA integrity number (RIN ≥8·0) confirmed with a bioanalyser and 4 μg used for complementary DNA (cDNA) synthesis by first treating with DNase I (Thermo Scientific) and RiboLock (Fermentas) followed by first-strand cDNA synthesis with oligo(dT) primers and RevertAid reverse transcriptase (Thermo Scientific). Expression of β actin (ACTB), IL-8, IL-10, mucin 1 (MUC1), mucin 2 (MUC2), TATAA-box binding protein (TBP), Toll-like receptor 4 (TLR4), TNFα and zona occludens 1 (ZO-1) was quantified using 50 ng of sample cDNA and Fast SYBR® Green Master Mix (Applied Biosystems) and an Applied Biosystems® 7500 Fast Real-Time PCR system with primer sequences and conditions as previously described( Reference Garas, Cooper and Dawson 19 ). TBP was used as a housekeeping gene to normalise expression levels( Reference Nygard, Jørgensen and Cirera 23 , Reference Wang, Wang and Liu 24 ).
DNA extraction and F4 receptor genotyping
Receptor polymorphism for early susceptibility to F4+ETEC strains was tested using a PCR-restriction fragment length polymorphism assay( Reference Jensen, Frydendahl and Svendsen 25 ). DNA was extracted from splenic tissue of all pigs dosed with ETEC using the QIAmp DNA Mini Kit (Qiagen) and intron 7 of the mucin 4 gene was PCR-amplified using forward primer 5′-GTGCCTTGGGTGAGAGGTTA-3′ and reverse primer 5′-CACTCTGCCGTTCTCTTTCC-3′. The resulting 367-bp PCR product was digested with XbaI (Fermentas) to determine whether the pigs carry resistant (develop diarrhoea <24 h after inoculation) or susceptible (develop diarrhoea <24 h after inoculation) alleles. The resistant allele has no XbaI cleavage site, whereas the susceptible allele results in cleavage of the 367-bp PCR product into 151 and 216-bp fragments. All pigs were classified into three categories based on which alleles were present: resistant–resistant (RR), susceptible–resistant (SR) and susceptible–susceptible (SS) with heterozygous SR pigs have the same phenotype as SS pigs.
Statistical analysis
Sample size (minimum n 4/group) was determined based on histological data from previous work( Reference Garas, Feltrin and Hamilton 11 , Reference Cooper, Brundige and Reh 17 , Reference Garas, Cooper and Dawson 19 ), with a statistical power of 0·8 and α error of 0·05. All groups were balanced for litter of origin and numbers of male and female pigs, and neither factor influenced outcomes. Statistical analysis for CBC and serum chemistry parameters was performed using a linear mixed effect model using the lme function in the nlme package in R to accommodate repeated measures; treatment least-squares mean (LSM) and LSM errors are reported for each response. Faecal and activity scores and weight were analysed using repeated measures in Proc GLM in SAS® software version 9.3 (SAS Institute Inc.). Weight (organ and body), translocation and gut permeability data were compared using the parametric test one-way ANOVA using SAS and differences were tested using the Tukey’s test. PROC GLIMMIX with LSM was used to analyse histological parameters to accommodate subsamples and an unbalanced design and to determine LSM and standard error of the mean comparisons. Translocation data were analysed using the lm function in R to fit a linear model. Analysis of quantitative RT-PCR results was performed using REST-MCS 2009 software (Qiagen) with randomised pair-wise tests based on the Pfaffl method and incorporating differences in primer efficiency. For all analyses, P values <0·05 were considered significant differences.
Microbiota data were analysed using Quantitative Insights Into Microbial Ecology (QIIME( Reference Caporaso, Kuczynski and Stombaugh 26 )) version 1.8.0 to perform demultiplexing and quality filtering as recommended( Reference Bokulich, Joseph and Allen 27 ) align sequence-reads to known bacterial 16S sequences using the GreenGenes 13_8 database and open reference operational taxonomic unit picking and taxonomy assignment at 97 % similarity( Reference McDonald, Price and Goodrich 28 ). Samples were rarified to the smallest number of sequences generated by a single sample to prevent sampling bias. QIIME was also used to generate principal coordinate analysis using weighted UniFrac to look at sample clustering by time and treatment, and bar graphs to visualise relative abundance of bacterial populations. Multivariate analysis was conducted using linear discriminant analysis (LDA) effect size analysis (LEfSe)( Reference Segata, Izard and Waldron 29 ) with default parameters to determine statistical differences in bacterial diversity and populations using absolute count data. LDA scores >2 were considered significant.
Results
Weight gain
After 3 weeks of feeding the restricted diet, FF pigs weighed significantly more than Mal (13·3 (sd 0·73) v. 7·6 (sd 0·20) kg; P<0·0001) (Fig. 2). At week 5, 2 weeks after milk was introduced, FF pigs weighed significantly more than Mal, MalGoat and MalhLZ pigs (all P<0·0001), weighing approximately twice as much as the malnourished animals (Fig. 2, Table 2). There was no difference in the weight of MalGoat and MalhLZ pigs (P=0·619), with MalhLZ pigs tending to weigh more (1·5 kg) than Mal pigs (P=0·055), whereas the 1·1kg difference between MalGoat and Mal pigs was not different (P=0·145). At the end of the trial, Post-ETEC, MalhLZE pigs weighed 1·97 kg more than MalE pigs (P=0·040), whereas MalGoatE pigs weighed 0·55 kg less than MalhLZE pigs and were not different from either the MalhLZE (P=0·520) or MalE (P=0·117) groups (Table 2).
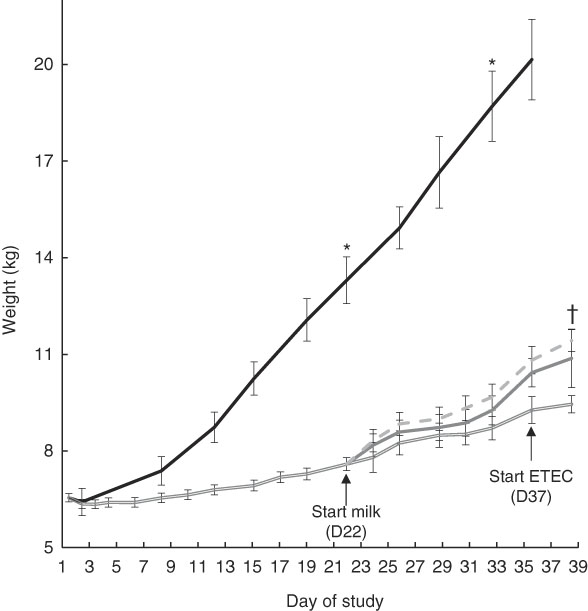
Fig. 2 Effect of diet and challenge on growth. Weights of malnourished (Mal (![]() ), n 34) animals compared with full-fed controls (FF (
), n 34) animals compared with full-fed controls (FF (![]() ), n 6) at the start of the experiment (baseline, day 1) through 3 weeks (day 21). Weights of Mal (n 10) animals and those supplemented with goat (MalGoat (
), n 6) at the start of the experiment (baseline, day 1) through 3 weeks (day 21). Weights of Mal (n 10) animals and those supplemented with goat (MalGoat (![]() ), n 10) and human lysozyme (MalhLZ (
), n 10) and human lysozyme (MalhLZ (![]() ), n 10) milk from days 21 to 35 and during enterotoxigenic Escherichia coli (ETEC) challenge of malnourished pigs with no milk supplementation (MalE, n 4) and those with goat (n 4) or human lysozyme (MalhLZE, n 4) milk supplementation. Values are means, with their standard errors represented by vertical bars. * FF different from Mal, MalGoat and MalhLZ, P<0·05; †MalhLZE different from MalE, P<0·05.
), n 10) milk from days 21 to 35 and during enterotoxigenic Escherichia coli (ETEC) challenge of malnourished pigs with no milk supplementation (MalE, n 4) and those with goat (n 4) or human lysozyme (MalhLZE, n 4) milk supplementation. Values are means, with their standard errors represented by vertical bars. * FF different from Mal, MalGoat and MalhLZ, P<0·05; †MalhLZE different from MalE, P<0·05.
Table 2 Body and organ measurements at 5 weeks and after enterotoxigenic Escherichia coli (ETEC) challenge (Least square means with their standard errors of the mean comparisons)
FF, full-fed; Mal, malnourished with no milk; MalGoat, malnourished+goat milk; MalhLZ, malnourished+human lysozyme milk; MalE, malnourished with no milk+ETEC challenge; MalGoatE, malnourished+goat milk+ETEC challenge; MalhLZE, malnourished+human lysozyme milk+ETEC challenge.
a,b,cValues within a row with unlike superscript letters were significantly different (P<0·05).
Animal Z-scores for body weight and organ weights
After 3 weeks of consuming the restricted diet, Mal pigs tended to be shorter (P=0·098), had a smaller circumference (P<0·0001) and had a reduced weight-to-length ratio (Z-score=−2·34) compared with FF pigs (P<0·0001) (data not shown). By 5 weeks, body length was reduced by 18 % and circumference by 22 % in Mal compared with FF pigs and the Z-score continued to worsen to −3·95 (P<0·001 for all) (Table 2). In pigs supplemented with goat and hLZ milk, the Z-scores improved 16 and 20 %, respectively, with a trend for MalhLZ pigs to have a better Z-score than Mal pigs (P=0·100), but both MalGoat and MalhLZ pigs remained stunted compared with FF pigs (P<0·001). Milk supplementation positively influenced Z-scores Post-ETEC infection, with MalGoatE and MalhLZE pigs having Z-scores improved by 21 % (P=0·044) and 24 % (P=0·027), respectively, compared with MalE pigs (Table 2). Within a treatment, no difference was seen between infected and uninfected pigs for any treatment.
After 5 weeks, dietary restriction affected body organs, with malnourished pigs having liver, pancreas and small intestine weights that were 60 % (P<0·0001), 54 % (P=0·011) and 66 % (P<0·0001) lighter, respectively, than FF controls, as well as a 29 % reduction in the length of the small intestine (P<0·0001) (Table 2). Milk supplementation did not restore any parameter to near FF pigs; however, the small intestines of pigs fed hLZ milk were 31 % heavier than in malnourished pigs fed no milk (P=0·020). Pigs fed goat milk were not significantly different from malnourished pigs (P=0·102), or those supplemented with hLZ milk (P=0·430). For all other parameters measured, malnutrition, regardless of milk supplementation, resulted in significantly shorter body length, smaller circumference, smaller liver and pancreas and shorter intestine (Table 2).
ETEC infection altered several body measurements (Table 2). After challenge, the length of the small intestine was increased by 12 % in the MalE group compared with uninfected Mal pigs (P=0·006). Supplementation with hLZ milk before challenge also influenced small intestine length. MalhLZE pigs had the longest small intestines of all challenged groups, 9·9 % longer compared with MalE (P=0·027) and 11 % longer compared with MalGoatE (P=0·014) pigs, whereas MalGoatE pigs were not different from MalE pigs (P=0·736). The small intestines of challenged pigs in the both MalGoatE and MalhLZE groups were 11 % (P=0·013) and 23 % (P<0·0001) longer than uninfected Mal pigs. Pigs supplemented with both goat or hLZ milk had larger livers after challenge than both infected MalE pigs (29 %, P=0·021 and 33 %, P=0·010, respectively) or uninfected Mal pigs (35 %, P=0·005 and 39 %, P=0·002, respectively), but pigs fed goat or hLZ milk were not different (P=0·715). Small intestine weight increased by 32 % in MalGoatE pigs and by 42 % in MalhLZE pigs compared with uninfected malnourished pigs (P=0·012 and P=0·002, respectively), but MalE pigs tended to be different from MalhLZE pigs (P=0·066) and were not different from uninfected Mal pigs (P=0·141) or MalGoatE pigs (P=0·251). No differences were seen in body length, circumference or pancreas weight. Within a treatment supplemented with goat or hLZ milk, no difference was seen between infected and uninfected pigs.
Complete blood counts and serum chemistry
The restricted diet induced several differences in CBC and serum chemistry parameters after 3 weeks, as was also seen in a data set including these same pigs in a previous study( Reference Garas, Feltrin and Hamilton 11 ). Mal pigs had elevated erythrocyte count, mean corpuscular Hb concentration and serum bicarbonate, blood urea nitrogen, creatinine, total protein and albumin and a significant reduction in total leucocytes, neutrophils, monocytes, mean corpuscular volume (MCV), mean corpuscular haematocrit (MCH) and glucose, Ca, P, anion gap, globulin and alkaline phosphatase (online Supplementary Table S1). After 5 weeks, many of the differences and their magnitude remained between FF and Mal animals (Table 2). Mal pigs continued to have elevated erythrocyte counts (13 %), albumin (16 %) (both P<0·0001) and bicarbonate (29 %, P=0·002) and reduced leucocyte (36 %), MCV (11 %), MCH (10 %) (all P<0·0001), monocytes (58 %, P=0·0009) and serum P (22 %), Ca (8·2 %), anion gap (23 %) and globulin (38 %) (all P<0·0001) in addition to a 78 % reduction in creatinine kinase (P=0·001) compared with FF controls. Supplementation with goat or hLZ milk began to return several parameters including erythrocytes, monocytes, anion gap, bicarbonate, P, Ca and albumin, towards FF levels, with values falling between those for Mal and FF pigs (Table 3). Goat milk restored erythrocyte count to that of FF pigs as it reduced the number of erythrocytes by 11 % compared with Mal pigs (P<0·0001). Serum P levels were increased by 17 % in MalhLZ pigs compared with Mal pigs (P<0·0001) but were not different from FF pigs. After ETEC challenge, few differences were seen between the MalE, MalGoatE and MalhLZE treatment groups (Table 3). At Mid-ETEC, serum Ca levels were increased by 13 % in MalhLZE pigs compared with MalE pigs (P<0·0001). Post-ETEC, goat milk increased glucose levels by 49 % compared with MalE pigs (P=0·0008) and γ-glutamyl transferase was increased by 53 % in MalhLZE pigs compared with MalGoatE pigs (P=0·002).
Table 3 Significant differences in blood parameters (Least square means (LSM) and standard deviations)
FF, full-fed; Mal, malnourished with no milk; MalGoat, malnourished+goat milk; MalhLZ, malnouished+human lysozyme milk; MCV, mean corpuscular volume; MCH, mean corpuscular haematocrit; MalGoatE, malnourished+goat milk + ETEC challenge; MalhLZE, malnourished+human lysozyme milk + ETEC challenge; ETEC, enterotoxigenic Escherichia coli; Mid-ETEC, day 38 approximately 32 h after the first enterotoxigenic Escherichia coli dose; Post-ETEC, day 39 approximately 56 h after the first enterotoxigenic Escherichia coli dose; GGT, γ-glutamyl transferase.
a,b,cMean values within a row with unlike superscript letters were significantly different after adjustment for multiple means comparisons (P≤0·0026).
Faecal scores and F4 receptor genotyping
Although there was a decline in faecal score over time after dosing pigs with ETEC, no significant differences were found between treatments at any time point (Fig. 3). This is likely owing to the small sample size in each treatment (n 4) and high variability between pigs within each treatment, which is probably the result of F4 receptor variants for early-onset susceptibility. Receptor polymorphisms for early/late diarrhoea-onset phenotype were similar in the MalE and MalhLZE groups, with three of the four animals in each group being resistant–resistant and one being SR, and in the MalGoatE group two animals were RR and two SR.
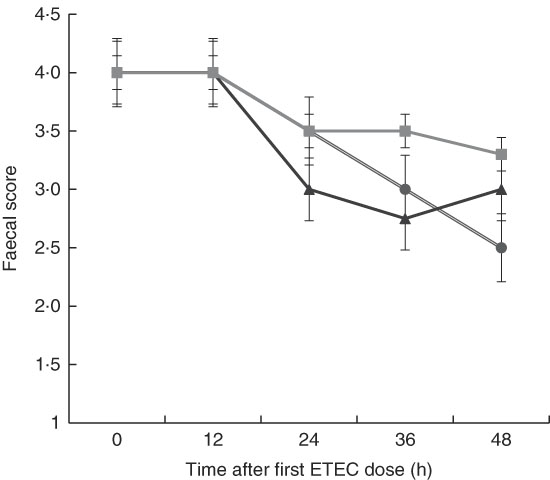
Fig. 3 Faecal scores after enterotoxigenic Escherichia coli (ETEC) challenge. Mean faecal scores (n 4/group), with their standard errors represented by vertical bars, for malnourished animals supplemented with no milk (![]() ), goat milk (
), goat milk (![]() ) or human lysozyme milk (
) or human lysozyme milk (![]() ) and challenged with ETEC. A score of 4 indicates normal solid faeces and 1 indicates watery diarrhoea. No significant differences were seen between the groups.
) and challenged with ETEC. A score of 4 indicates normal solid faeces and 1 indicates watery diarrhoea. No significant differences were seen between the groups.
Intestinal permeability
Intestinal barrier function, as measured in the jejunum, was impaired in malnourished pigs with increases of 4·3 times in electrical conductance (P<0·0001), 6·8 times in paracellular permeability (P=0·0003) and 8·6 times in transcellular transport (P=0·0001) compared with FF controls (Fig. 4(A)–(C)). Dietary supplementation with both goat and hLZ milk decreased the extent of the impairment caused by the restricted diet. Electrical conductance was improved by 43 % in the MalGoat (P=0·014) and 44 % in the MalhLZ (P=0·011) groups compared with Mal pigs and was not different from FF controls (Fig. 4(A)). Flux between cells (paracellular permeability) and within cells (transcellular transport) was significantly improved with hLZ milk. In MalhLZ pigs, paracellular permeability was decreased by 56 % compared with the Mal group (P=0·0064) and was not different from FF controls, with goat milk having a lesser effect as paracellular permeability tended to be lower than Mal pigs (P=0·0686) and remained significantly different from FF pigs (P=0·0249) (Fig. 4(B)). The same pattern was seen with transcellular transport where, compared with Mal animals, hLZ milk decreased flow within cells by 55 % (P=0·0041) and was not different from FF controls, whereas the MalGoat group did not differ from Mal and remained significantly different from the FF group (P=0·0111) (Fig. 4(C)).
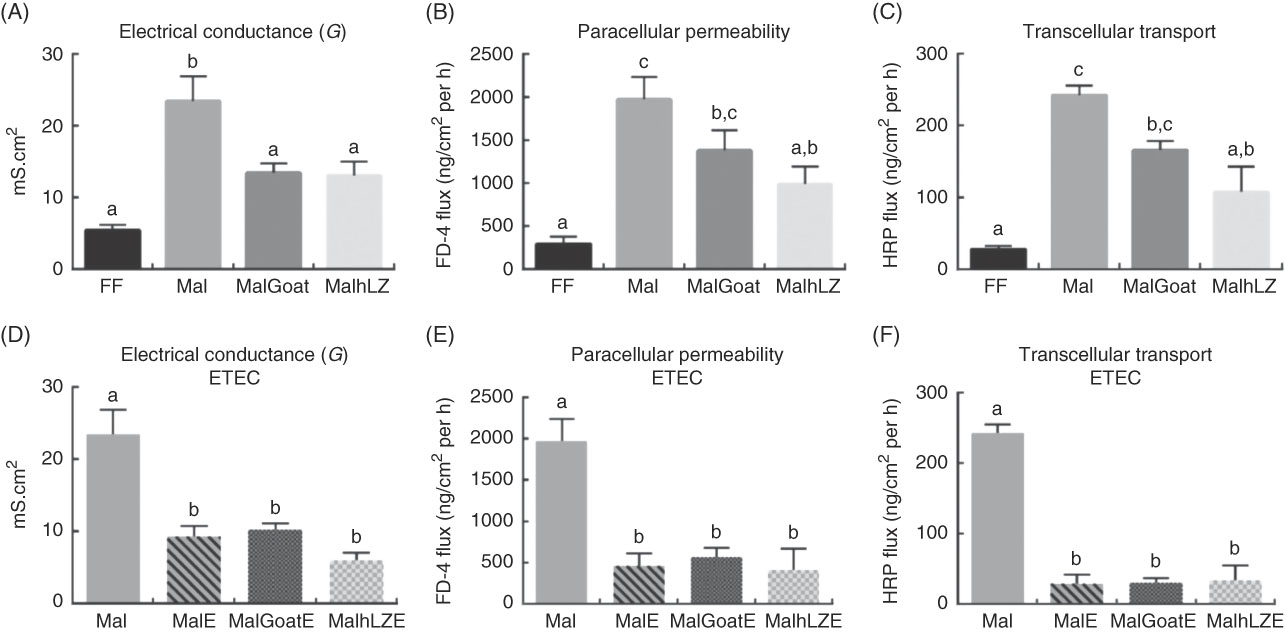
Fig. 4 Effect of diet and challenge on barrier function. Using chamber analysis of permeability between cells (electrical conductance and paracellular permeability) and within cells (transcellular transport) in the jejunum at 5 weeks after milk supplementation (A–C, n 6/group), and after enterotoxigenic Escherichia coli (ETEC) challenge (D–F, n 4/group). Values are means, with their standard errors represented by vertical bars. a,b,c Mean values with unlike superscript letters were significantly different (P<0·05). mS, millisiemens; FF, full-fed; Mal, malnourished with no milk; MalGoat, malnourished+goat milk; MalhLZ, malnourished+human lysozyme milk; MalE, malnourished with no milk+ETEC challenge; MalGoatE, malnourished+goat milk+ETEC challenge; MalhLZE, malnourished+human lysozyme milk+ETEC challenge; FD-4, FITC-4000; HRP, horseradish peroxidase.
Infection with ETEC reduced permeability in all groups to levels near those seen in FF pigs (Fig. 4(D)–(F)). MalE pigs had lower electrical conductance (60 %, P=0·0002), paracellular permeability (77 %, P=0·0002) and transcellular transport (88 %, P<0·0001) compared with Mal animals without ETEC challenge. Milk supplementation, both goat and hLZ, before ETEC infection did not significantly influence any measures of permeability, with both milk treatments not differing from non-supplemented infected animals.
Intestinal histology
Effect of milk supplementation and infection
The restricted diet resulted in decreases in all measures of intestinal histology along the length of the small intestine when comparing Mal pigs with FF controls, except the height of villi in the duodenum (Table 4, Fig. 5(a)–(d)). Both goat and hLZ milk promoted increases in villi width in the duodenum by 21 % (P=0·002) and 16 % (P=0·047), respectively, over Mal pigs, restoring it to that of FF controls, as well as the height of villi in the jejunum with villi in the MalhLZ group being 20 % longer than the MalGoat (P=0·045) and 54 % longer than Mal (P=0·0002) groups. Goat milk increased crypt depth in the duodenum by 24 % and villi width in the jejunum by 9 % so that they did not differ from the FF group. Neither milk influenced any parameter in the ileum.
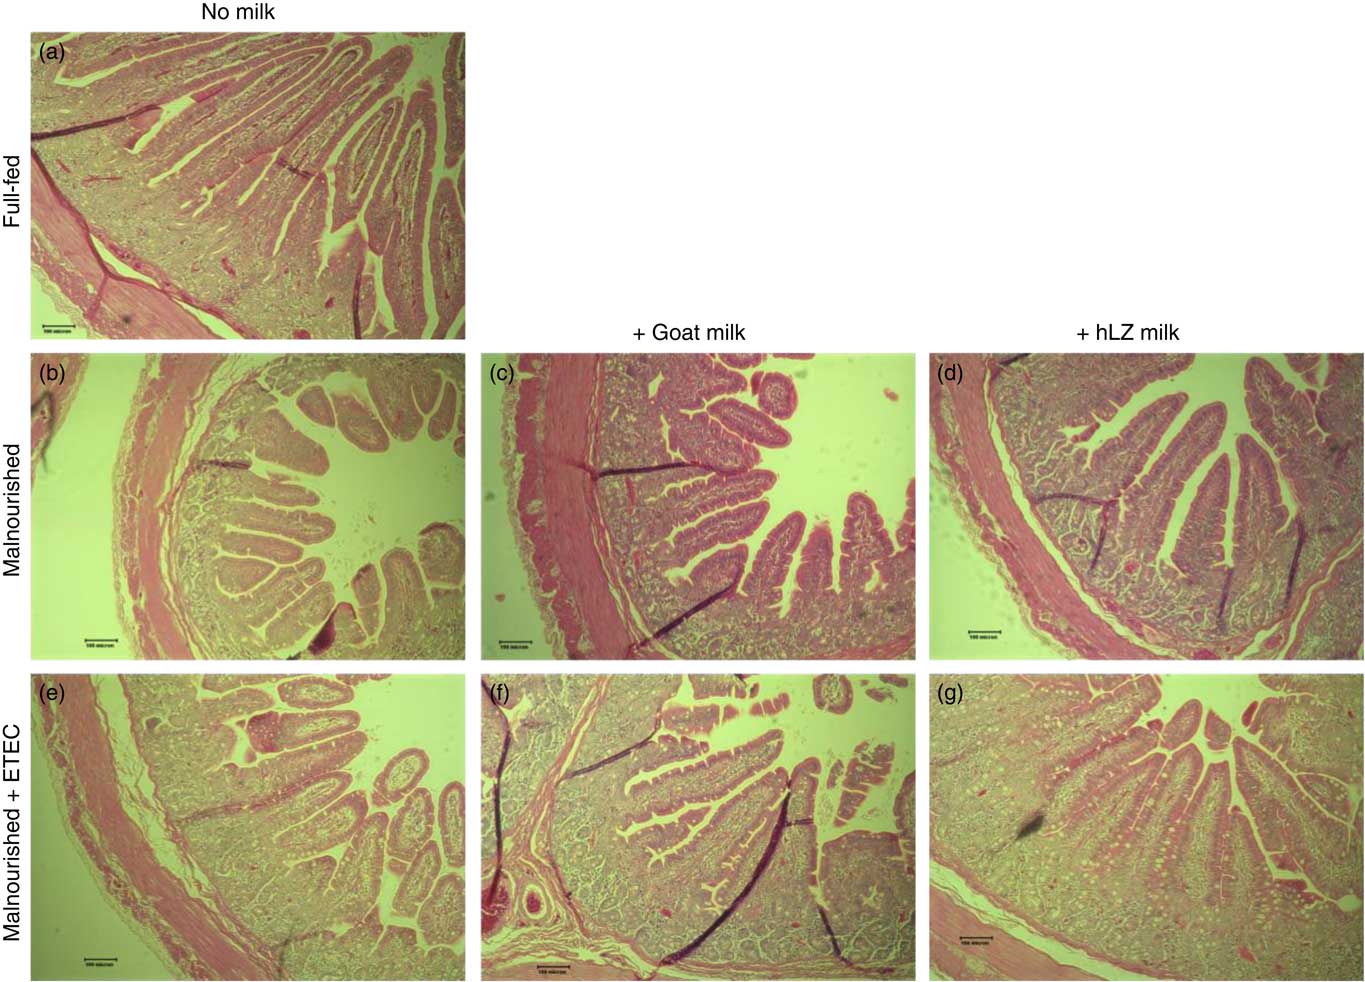
Fig. 5 Intestinal histology of the jejunum. Representative morphology of the jejunum (100×) of full-fed (a) and malnourished animals supplemented with no milk (b), goat milk (c) or human lysozyme (hLZ) milk (d) at 5 weeks before enterotoxigenic Escherichia coli (ETEC) challenge and after ETEC challenge having been supplemented with no milk (e), goat milk (f) or hLZ milk (g).
Table 4 Effect of malnutrition, milk consumption and enterotoxigenic Escherichia coli challenge on intestinal morphology (Least square means with their standard errors)
FF, full-fed; Mal, malnourished with no milk; MalGoat, malnourished+goat milk; MalhLZ, malnourished+human lysozyme milk; MalE, malnourished with no milk+enterotoxigenic Escherichia coli challenge; MalGoatE, malnourished+goat milk+enterotoxigenic Escherichia coli challenge; MalhLZE, malnourished+human lysozyme milk+enterotoxigenic Escherichia coli challenge.
a,b,cMean values within a row at each time point with unlike superscript letters were significantly different at 5 weeks (non-challenged, n 6/group) and at necropsy (challenged, n 4/group) (P≤0·05).
Effect of enterotoxigenic Escherichia coli infection
Infection with ETEC did not alter any parameter compared with non-challenged malnourished animals in any segment of the small intestine (Table 4, Fig. 5(e)–(g)). Supplementation with goat or hLZ milk before challenge had some effects on intestinal morphology when compared with non-challenged Mal pigs including deeper crypts and a thicker lamina propria in the duodenum of MalGoatE (50 %, P=0·007 and 34 %, P=0·019, respectively) and in the jejunum of MalhLZE pigs (59 %, P=0·005 and 37 %, P=0·024, respectively). In the duodenum of challenged pigs, goat milk supported 26 % deeper crypts than hLZ milk (P=0·046), and as in non-challenged animals villi height in the jejunum was influenced to a greater extent by hLZ milk as the villi of MalhLZE animals were 48 % longer than villi in MalE animals (P=0·0009). Again, no changes in histology were observed in the ileum of any group.
Gene expression
Gene expression was not significantly altered after 5 weeks in Mal pigs compared with FF, but goat and hLZ milk did influence gene expression (Table 5). The duodenum of the MalGoat and MalhLZ groups had lower expression of IL-10 than both Mal pigs (67 and 72 %, respectively) and FF pigs (74 and 79 %, respectively). MalhLZ pigs tended to have lower ACTB expression compared with Mal pigs. Both MalGoat and MalhLZ pigs tended to have lower IL-8 expression relative to FF pigs, and lower TNFα expression relative to both FF and Mal treatments. Goat milk altered the expression of many genes in the jejunum including increases of 4-fold in IL-10, 5-fold in TLR4, 7-fold in TNFα and 5-fold in ZO-1 over Mal pigs, whereas hLZ milk did not. In all, three of these changes, increases in IL-10, TLR4 and TNFα expression, were also seen in the ileum of MalGoat pigs with increases in expression of 3·9-, 3·9- 19-fold, respectively, and in MalhLZ pigs as well with increases of 4·7-, 3·8- and 12-fold, respectively. Infection with ETEC lowered duodenal expression of IL-10 by 1·8-fold and ileal expression of MUC2 by 4·5-fold when comparing Mal and MalE pigs (Table 4). Goat and hLZ milk supplementation before challenge resulted in similar decreases in duodenal IL-10 (2·5- and 2·6-fold, respectively) and ileal MUC2 (3·5- and 4·9-fold, respectively) expression compared with Mal pigs. The duodenum of MalhLZE pigs also had lower expression of TRL4 (3-fold) and TNFα (1·1-fold) than MalE pigs. Challenge decreased the expression of all but MUC1 in the jejunum of MalGoatE pigs compared with MalGoat pigs, whereas no changes in gene expression were seen comparing MalhLZ with MalhLZE pigs.
Table 5 Gene expression in intestinal tissues of challenged and non-challenged pigs
ACTB, β-actin; MUC1, mucin 1; MUC2, mucin 2; TLR4, Toll-like receptor 4; ZO-1, zona occludens 1; FF, full-fed; Mal, malnourished with no milk; MalGoat, malnourished+goat milk; MalhLZ, malnourished+human lysozyme milk; MalE, malnourished with no milk+enterotoxigenic Escherichia coli challenge; MalGoatE, malnourished+goat milk+enterotoxigenic Escherichia coli challenge; MalhLZE, malnourished+human lysozyme milk+enterotoxigenic Escherichia coli challenge; Post-ETEC, day 39 approximately 56 h after the first enterotoxigenic Escherichia coli dose.
a,bValues within a row with unlike superscript letters were significantly different at each time point (P<0·05).
* Values are fold changes relative to FF pigs at 5 weeks (non-challenged, n 6/group) and relative to Mal pigs Post-ETEC (challenged, n 4/group).
Bacterial translocation
There was a 79 % reduction in bacterial translocation into the mesenteric lymph node in MalhLZ pigs compared with FF pigs (P=0·0292), and a trend for a reduction when compared with Mal pigs (P=0·074) (Table 6), whereas MalGoat did not differ from any treatment, although it tended to have fewer CFU than FF pigs (P=0·091). In pigs infected with ETEC, a marked reduction in CFU/g tissue was seen, although no differences were found between treatments and MalE pigs owing to high variability within treatments (Table 6). MalGoatE and MalhLZE pigs had 87 % (P=0·0046) and 94 % (P=0·0038), respectively, fewer CFU/g splenic tissue than uninfected pigs fed the same milk, and MalGoatE pigs tended to have fewer CFU/g in the mesenteric lymph node compared with MalGoat pigs (P=0·0634).
Table 6 Bacterial translocation into mesenteric lymph node (MLN) and spleen (Mean values and standard deviations)
FF, full-fed; Mal, malnourished with no milk; MalGoat, malnourished+goat milk; MalhLZ, malnourished+human lysozyme milk; CFU, colony-forming units; n/a, none detected; MalE, malnourished with no milk+ETEC challenge; MalGoatE, malnourished+goat milk+ETEC challenge; MalhLZE, malnourished+human lysozyme milk+ETEC challenge; Post-ETEC, day 39 approximately 56 h after the first enterotoxigenic Escherichia coli dose.a,bMean values within a row with unlike superscript letters were significantly different (P<0·05) at 5 weeks (non-challenged) and Post-ETEC (challenged).
Microbiota of faeces
Effect of dietary restriction at 3 and 5 weeks
The restricted diet altered faecal microbiota, as unweighted UniFrac analysis of β-diversity showed distinct communities in malnourished and FF pigs at both 3 and 5 weeks of restriction (Fig. 6(a) and (b)). No differences were found in α-diversity (data not shown). Several differences in the abundance of bacterial families in malnourished and FF pigs were apparent by 3 weeks (Table 7). The phyla Proteobacteria, Spirochaetes and Planctomycetes were enriched in malnourished animals compared with FF controls. Of the more abundant families, malnourished pigs were enriched for Spirochaetaceae, Enterobacteriaceae, Mogibacteriaceae, Christensenellaceae and Turicibacteraceae and in Campylobacteraceae, Desulfovibrionaceae and Pirellulaceae among families present at <1 %. FF pigs had significantly higher abundance of Erysipelotrichaceae and Lachnospiraceae. In malnourished pigs, relatively few changes were seen between weeks 3 and 5 of restriction (Table 7, Fig. 6(a)), with malnourished pigs continuing to be enriched in many of the same families as seen at 3 weeks with the addition of Methanobacteriaceae when compared with FF controls. In FF pigs, more differences were seen between weeks 3 and 5 and FF pigs continued to be enriched for Lachnospiraceae, and were also enriched for Streptococcaceae, Paraprevotellaceae and Lactobacillales compared with malnourished pigs (Table 7).
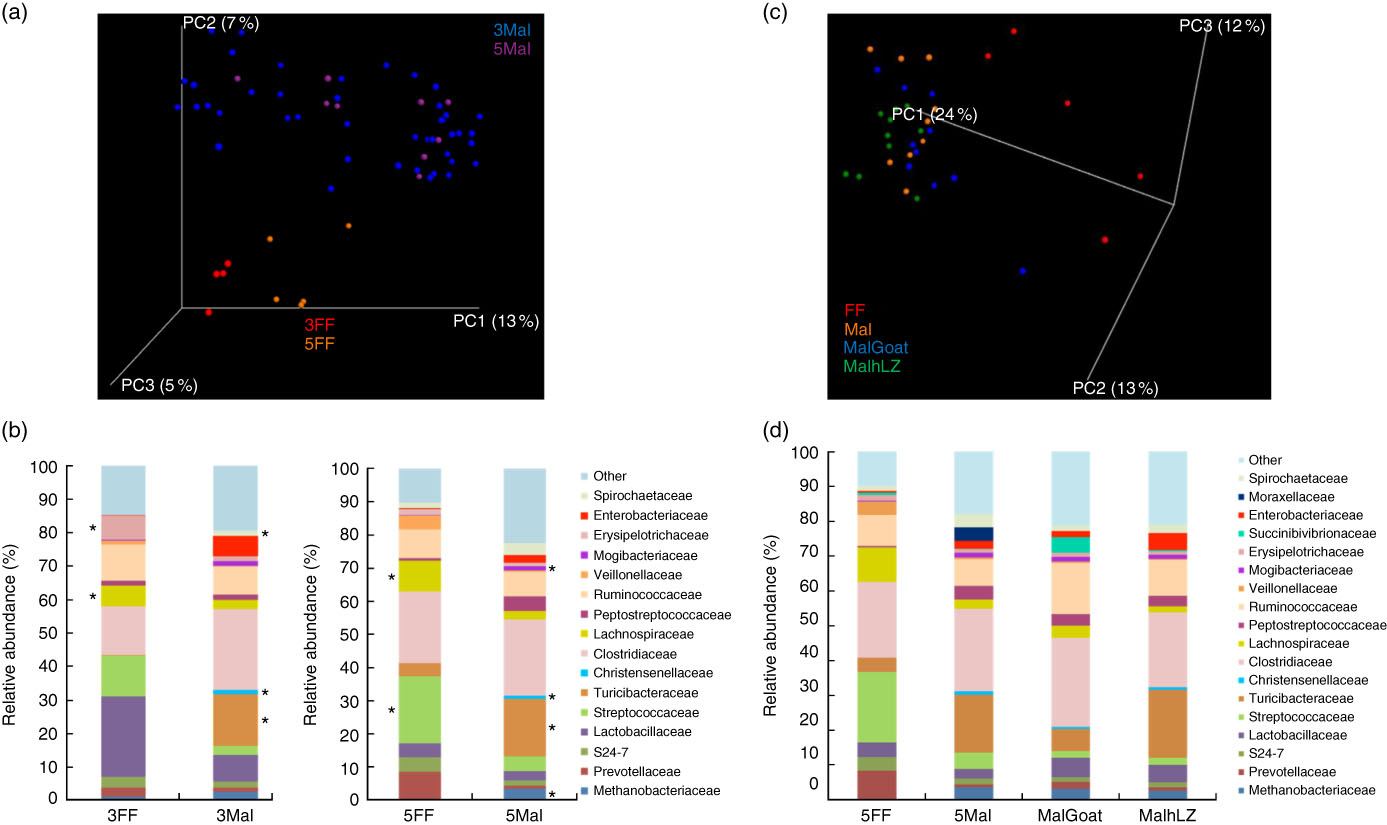
Fig. 6 Differences in faecal microbiota. (a) Principal coordinate (PC) analysis plot (unweighted UniFrac) showing microbiota communities cluster by diet after 3 and 5 weeks of dietary restriction. (b) Stacked bar chart showing average relative abundance at the family level in the faeces of full-fed (FF) (n 9) and malnourished (Mal) pigs (n 44) at 3 weeks and in FF (n 6) and Mal (n 10) pigs at 5 weeks. (c) PC analysis plot (weighted UniFrac) showing slight shifts in microbiota communities after milk supplementation. (d) Stacked bar chart showing average relative abundance at the family level in the faeces of FF (n 6), Mal (n 10), malnourished+goat milk (MalGoat) (n 10) and malnourished+human lysozyme milk (MalhLZ) (n 10) pigs after 2 weeks of milk supplementation. ‘Other’ represents families present at <1 %. *Significant changes in absolute counts of family abundance as determined by linear discriminant analysis effect size analysis with linear discriminant analysis score of 2 or greater considered significant.
Table 7 Significant changes in faecal bacteria due to diet (Relative abundance, %)
FF, full-fed; Mal, malnourished; LDA, linear discriminant analysis.
*Bacteria at the phylum level.
†Relative abundance (%) of bacterial families that differed (LDA >2·0) between FF (n 9) and Mal (n 44) animals at 3 weeks and FF (n 6) and Mal (n 10) animals at 5 weeks.
‡No significant difference (LDA <2).
Effect of milk on malnutrition
After 2 weeks of milk supplementation, faecal microbiota populations responded modestly but differently to goat and hLZ milk (Fig. 6(c) and (d)). There was a small but distinct shift by both milk groups clustering by treatment and segregating either side of no milk animals (Fig. 6(c)). Milk supplementation had no effect on α-diversity (data not shown). In terms of bacterial families present at >1 % of the entire population, both goat and hLZ milk enriched the faecal microbiota in Succinibivibrionaceae compared with malnourished animals with no milk supplementation (Table 8). Goat milk also enriched for Ruminococcaceae and reduced the abundance of Moraxellaceae, Veillonellaceae and Turicibacteraceae. Comparing milk treatments, MalGoat had enriched Veillonellaceae, Lachnospiraceae and fewer Turicibacteraceae and Bacilli compared with MalhLZ. Differences found between FF and Mal animals at 5 weeks were similar to those between FF and both milk-supplemented groups, with a few minor differences, although MalhLZ pigs had increased Bifidobacteraceae compared with FF pigs, whereas MalGoat and Mal did not.
Table 8 Changes in bacterial families due to milk supplementation
LDA, linear discriminant analysis; Mal, malnourished with no milk; MalGoat, malnourished+goat milk; MalhLZ, malnourished+human lysozyme milk.
*Relative abundance of bacterial families at 5 weeks that differed (LDA>2·0) owing to milk supplementation, n 10 for all groups.
†Bacteria at the phylum level.
‡No significant difference between treatments (LDA <2·0).
Effect of enterotoxigenic Escherichia coli infection
After 2 weeks of milk supplementation, microbial populations were distinct from each other in the subset of animals infected (online Supplementary Fig. S2a). Challenge with ETEC enriched for Fusobacteria (Fusobacteriaceae) and Enterococccaceae and depleted Rikenellaceae in the faeces of animals that received no milk supplementation compared with their non-challenged state (Post-milk) (Table 8). Different responses were seen in animals that were supplemented with milk before challenge with goat milk enriching for Firmicutes after challenge and reducing Pasteurellaceae and Campylobacterales, and hLZ milk before challenge reduced Proteobacteria, Enterobacteriaceae and Pseduomonadaceae and enriched for Actinomycetales (Table 9).
Table 9 Effect of infection on faecal microbiota (Relative abundance (%) and linear discriminate analysis (LDA) score)
Mal, malnourished with no milk; MalE, malnourished with no milk+ETEC challenge; MalGoat, malnourished+goat milk; MalGoatE, malnourished+goat milk+ETEC challenge; MalhLZ, malnourished+human lysozyme milk; MalhLZE, malnourished+human lysozyme milk+ETEC challenge; Post-ETEC, day 39 approximately 56 h after the first enterotoxigenic Escherichia coli dose.
*Bacteria at the phylum level.
†Relative abundance (%) of bacterial families that differed (LDA >2·0) between Post-milk and Post-ETEC time points within each treatment (n 4/group).
‡No significant difference (LDA <2).
Mid-ETEC, differences in β-diversity remained but were less pronounced (online Supplementary Fig. S2b). Animals supplemented with hLZ milk had a more stable faecal microbiota compared with those supplemented with goat milk or no milk, as evident by the Firmicutes:Bacteroidetes ratio (Fig. 7(a)). Although Rikenellaceae became underrepresented in MalE animals upon challenge, it was enriched in both MalGoatE and MalhLZE pigs compared with MalE pigs Mid-ETEC (Table 10). Both milks also led to depletions of Synergistacea and Pirellulaceae compared with non-supplemented pigs. Goat milk led to a greater abundance of Pseudomonadaceae and reduction in Turicibacteraceae and Desulfovibrionaceae, whereas hLZ milk promoted reduction of Tenericutes, Fusobacteriaceae, Coriobacteriaceae, Christensenellaceae and Ruminococcaceae. Compared with MalGoatE, MalhLZE was enriched for Turicibacteraceae and had fewer Proteobacteria and Pseudomonadaceae. Pigs in the MalhLZE group shed the least Enterobacteriaceae during challenge, 42 % less than MalE and 38 % less than MalGoatE, but there were no differences between groups (Fig. 7(b)).
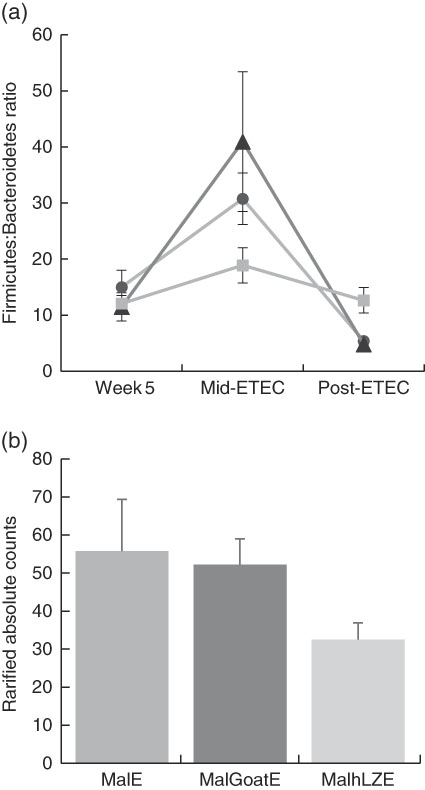
Fig. 7 Differences in faecal microbiota during enterotoxigenic Escherichia coli (ETEC) challenge. Values are means, with their standard errors represented by vertical bars. (a) Mean ratio of Firmicutes:Bacteroidetes in malnourished with no milk+enterotoxigenic Escherichia coli (MalE, ![]() ), malnourished+goat milk+enterotoxigenic Escherichia coli (MalGoatE,
), malnourished+goat milk+enterotoxigenic Escherichia coli (MalGoatE, ![]() ) and malnourished+human lysozyme milk+enterotoxigenic Escherichia coli (MalhLZE,
) and malnourished+human lysozyme milk+enterotoxigenic Escherichia coli (MalhLZE, ![]() ) animals (n 4/group) on day 36, after 2 weeks of consuming milk and before challenge (week 5), day 38, 32 h after challenge (Mid-ETEC), and day 39, at necropsy (Post-ETEC). This ratio is indicative of overall gut microbiota balance and showed more stability during the challenge period in MalhLZE animals. (b) Shedding of Enterobacteriaceae during challenge in MalE, MalGoatE and MalhLZE animals (n 4/group). Mean rarified counts with their standard errors of Enterobacteriaceae in faeces during ETEC challenge (Mid-ETEC).
) animals (n 4/group) on day 36, after 2 weeks of consuming milk and before challenge (week 5), day 38, 32 h after challenge (Mid-ETEC), and day 39, at necropsy (Post-ETEC). This ratio is indicative of overall gut microbiota balance and showed more stability during the challenge period in MalhLZE animals. (b) Shedding of Enterobacteriaceae during challenge in MalE, MalGoatE and MalhLZE animals (n 4/group). Mean rarified counts with their standard errors of Enterobacteriaceae in faeces during ETEC challenge (Mid-ETEC).
Table 10 Effect of milk and infection over time
LDA, linear discriminant analysis; Mid-ETEC, day 38 approximately 32 h after the first enterotoxigenic Escherichia coli dose; MalE, malnourished with no milk+enterotoxigenic Escherichia coli challenge; MalGoatE, malnourished+goat milk+enterotoxigenic Escherichia coli challenge; MalhLZE, malnourished+human lysozyme milk+enterotoxigenic Escherichia coli challenge; Post-ETEC, day 39 approximately 56 h after the first enterotoxigenic Escherichia coli dose.
* Relative abundance of bacterial families that changed over time (LDA >2·0) in response to infection and milk supplementation, n 4 for all groups.
† Bacteria at the phylum level.
‡ No significant difference between treatments (LDA <2·0).
Post-ETEC, at necropsy, differences in β-diversity persisted, with milk-treated groups more distinct from non-supplemented animals (online Supplementary Fig. S2c, Table 10). Both milk-supplemented groups had fewer Christensenellaceae, a family associated with lean body mass, than MalE pigs and MalhLZE pigs continued to be enriched for Rikenellaceae, a biomarker associated with both gut health and obesity. MalE pigs were enriched in Actinobacteria and Turicibacteraceae compared with MalGoatE pigs and were enriched in Alcaligenaceae, Pirellulaceae, Lachnospiraceae and Ruminococcaceae compared with MalhLZE pigs. Compared with MalGoatE, MalhLZE was enriched in Peptostreptococcaceae, and had fewer Lachnospiraceae.
Discussion
Protein- and energy-poor diets cause stunting and damage to the structure and function of the intestine, increasing susceptibility to diarrhoea-causing infections. Dietary interventions that can improve both the symptoms and dehydration associated with diarrhoea while also supplying macronutrients and micronutrients are essential to promoting growth and development of undernourished children. We assessed the use of lysozyme-rich goat milk as a dietary supplement to promote improvements in the intestinal epithelium in the face of malnourishment and infection. To this end, we used a pig model to investigate the multifaceted changes that occur at the level of the intestine during malnutrition and infection that is relevant to children beyond the age of breast-feeding. This model recapitulated many aspects of malnutrition seen in children and demonstrated the effectiveness of hLZ milk at ameliorating some of the malnutrition-induced damage to the gut.
Malnourished infection model
Animals weaned onto the restricted diet displayed signs of severe acute malnutrition after 3 and 5 weeks as seen in a related study( Reference Garas, Feltrin and Hamilton 11 ). These signs included reduced body weight, multiple changes in blood count and chemistry parameters, atrophy of the small intestine mucosa and impaired barrier function. In addition, distinct shifts in microbiota were evident by 3 weeks of dietary restriction and persisted at 5 weeks. Notably, an increase in Christensenellaceae was observed in faeces of all malnourished pigs compared with FF controls. Christensenellaceae has been associated with lean body mass in humans( Reference Ley, Turnbaugh and Klein 30 ), and indicates that a change in microbial population associated with decreased body mass is recapitulated in this model. A reduction in microbial diversity has been seen in malnourished children( Reference Subramanian, Huq and Yatsunenko 31 ) and adult pigs raised on a reduced protein diet( Reference Fan, Liu and Song 32 ). Although the faecal microbiota of malnourished animals did not have decreased species richness in our model, several changes were induced that are similar in malnourished children. One of the distinguishing features of the faecal microbiota of malnourished/stunted children compared with healthy children is an increased abundance of Proteobacteria( Reference Monira, Nakamura and Gotoh 33 ) including inflammatory taxa such as Campylobacteraceae and Desulfovibrionaceae( Reference Dinh, Ramadass and Kattula 34 , Reference Smith, Yatsunenko and Manary 35 ). Here, malnourished pigs had a 4-fold increase in the phylum Proteobacteria including significant increases in Enterobacteriaceae, Campylobacteraceae and Desulfovibrionaceae (a sulphate-reducing bacteria also seen elevated in malnourished children( Reference Smith, Yatsunenko and Manary 35 )) over FF controls and an enrichment in Turicibacteraceae, as has been seen in pigs raised on a low-protein diet( Reference Fan, Liu and Song 32 ), as well as Methanobacteriaceae. If overabundant, methanogens have been shown to cause physiological effects such as decreased motility and constipation( Reference Roccarina, Lauritano and Gabrielli 36 , Reference Triantafyllou, Chang and Pimentel 37 ); interestingly, high faecal consistency scores throughout this study was indicative of this effect (data not shown).
Challenge with ETEC had relatively little impact on the physical state of the intestine and modest effects on faecal microbial populations. Surprisingly, intestinal morphology was not altered by challenge; however, there was decreased expression of IL-10 and a tendency for IL-8 to be increased, indicating that an immune response had occurred. Decreased expression of MUC2 and ZO1 in the ileum also indicates some damage to the epithelium. The heat-stable enterotoxin b secreted by the ETEC strain used in this study has been shown to induce villous atrophy in young pigs, resulting in cuboidal or squamous epithelium at villous tips( Reference Rose, Whipp and Moon 38 ), which was also seen in weaned pigs challenged with an ETEC F4 (K88) strain as used here( Reference Liu, Piao and Thacker 39 , Reference Yi, Carroll and Allee 40 ). Lack of differences in intestinal morphology, as well as CBC, in challenged malnourished pigs may reflect that the animals were already compromised to such as extent that they could not mount a response as protein malnutrition and amino acid deficiency can alter immunocompetence by inhibiting the proliferation and differentiation of lymphocytes, erythrocytes and intestinal epithelial cells( Reference Souba 41 , Reference Huang, Shao and Neu 42 ). Faecal consistency continued to decline in MalE animals and they also had a 10-fold enrichment in Enterobacteriaceae in the ileum (data not shown), indicating infection by ETEC. Together, these data support a malnourished infection model in young pigs with a developing immune system that recapitulates many aspects of these aliments in young children and supports the use of the pigs as a more human-relevant animal model.
Effect of milk supplementation
In all, 3 weeks of the restricted diet was effective at inducing a moderate to severe state of malnutrition before starting milk supplementation, and the addition of goat or hLZ milk to the malnourished diet for 2 weeks improved several of the observed deficits. Although goat milk had no impact on growth and organ sizes, hLZ milk tended to improve growth and Z-score and resulted in a heavier small intestine, suggesting that hLZ milk supported increased intestinal development relative to Mal pigs. This is corroborated by significant changes in intestinal morphology, with hLZ milk supporting longer villi in the jejunum compared with both the Mal and MalGoat groups. In our model, malnutrition caused significant mucosal atrophy similar to the blunt villi seen in the proximal and distal intestine in another pig model of childhood malnutrition( Reference Lykke, Hother and Hansen 43 ) and along with a thinner lamina propria, as well as increased permeability, mimic changes seen in malnourished children( Reference McKay, Gaudier and Campbell 44 , Reference Korpe and Petri 45 ). Both goat and hLZ milk increased villi width in the duodenum and, taken with the lack of changes seen in ileal histology, suggests that goat milk consumption has a greater impact on the proximal small intestine. This is in contrast to a similar study in which cow milk promoted increases in surface area along the entire length of the small intestine of malnourished pigs( Reference Garas, Feltrin and Hamilton 11 ), suggesting that compositional differences between goat and cow milk can differentially influence intestinal morphology.
Intestinal permeability is largely influenced by nutritional status( Reference Ferraris and Carey 46 ) and supplementation with goat and hLZ milk helped to restore barrier function that was compromised by the restricted diet, with hLZ milk acting to a greater extent than goat milk alone. This was also seen with milk from lactoferrin cows( Reference Garas, Feltrin and Hamilton 11 ) and points to the antimicrobial nature of these compounds to influence barrier function likely through microbiota modulation. The ability of hLZ milk to improve barrier function is corroborated by the bacterial translocation data where decreased translocation to the mesenteric lymph node was seen. These improvements in barrier function may also correlate to several changes in gene expression in the jejunum, particularly increases of genes involved with the cytoskeleton and tight junctions, ACTB and ZO-1, observed in pigs supplemented with goat and hLZ milk. This suggests that malnutrition alone increases intestinal permeability, probably to increase macromolecule absorption and counteract nutrient deficiency, and milk may decrease permeability in part owing to increased nutrient availability and epithelial barrier integrity.
Changes in microbiota can be lasting and difficult to correct( Reference Blanton, Barratt and Charbonneau 6 ). While a distinct difference in β-diversity was evident between FF and malnourished pigs, there were relatively few differences seen after supplementing the malnourished diet with goat or hLZ milk. This is similar to studies that showed that protein added to the diet in the form of ready-to-use therapeutic food (RUTF) resulted in only a partial amelioration of microbiota dysbiosis caused by malnutrition( Reference Subramanian, Huq and Yatsunenko 31 , Reference Smith, Yatsunenko and Manary 35 ). The faecal microbiota of malnourished animals responded differently to goat and hLZ milk, with some of the significant changes that were seen indicating that the milks have the potential to positively influence the microbiota. Both goat and hLZ milk enriched for Enterococcaceae and goat milk for Ruminococcaceae, both of which have been identified as weight discriminatory taxa in malnourished children and are positively associated with weight gain( Reference Blanton, Charbonneau and Salih 47 ). Veillonella is negatively correlated with the nutritional index of children( Reference Ghosh, Gupta and Bhattacharya 48 ) and the family Veillonellaceae was found to decrease when milk was added to the diet, reflecting the increase in nutritional status. Both milks enriched for the family Succinivibrionaceae, members of which can ferment carbohydrates probably reflecting the addition of lactose to the diet. When protein in the form of RUTF was added to a malnourished diet, anti-inflammatory bacteria such as lactobacilli were increased( Reference Smith, Yatsunenko and Manary 35 ), members of which were also increased upon addition of either milk to the diet, suggesting commonalities in response of microbiota with the addition of protein in general to the malnourished diet, rather than the type of protein.
Milk supplementation and enterotoxigenic Escherichia coli infection
Faecal scores declined by 24 h post-challenge in all groups and then continued to decline in the MalE and MalGoatE groups. The decline in faecal scores over time in all treatments that received ETEC indicates that the infection, early-onset receptor variation and small sample size overwhelmed any significant treatment effect. Although pigs supplemented with hLZ milk exhibited faster rate of weight gain during infection, particularly compared with malnourished pigs that did not receive milk, we cannot conclude that this is owing to less severe diarrhoea. Rate of gain in hLZ-milk-supplemented pigs may be related to the relative lack of fluctuations in microbial populations seen pre-, mid- and post-ETEC, whereas pigs without milk or supplemented with goat milk had much larger fluctuations over time.
Body weight tended to be influenced by hLZ milk at 5 weeks, and Post-ETEC infection this difference became significant, with pigs fed hLZ milk weighing 2 kg more than malnourished animals. This suggests that supplementation with hLZ milk for a longer period of time before infection may have led to a significant difference in weight over non-supplemented animals. In addition, it demonstrates the effectiveness of hLZ milk consumption on improving weight gain in the face of infection. Feeding plant extracts with multiple bioactivities, including antimicrobial, to healthy pigs of the same age resulted in longer villi than non-supplemented, as also seen here, but did not improve growth performance during ETEC challenge( Reference Liu, Song and Che 49 ). The ability of hLZ milk to promote weight gain during challenge is likely related to the relative stability of microbiota in pigs fed hLZ milk. An elevated Firmicutes to Bacteroidetes ratio has been seen in humans with ETEC infection( Reference Youmans, Ajami and Jiang 50 ) and was also seen here. The magnitude of this increase, however, was 1·8- and 4·5-times lower in the MalhLZE group compared with the MalE and MalGoatE groups, respectively, and this ratio was more stable over time while fluctuating from 5 weeks to Mid-ETEC to Post-ETEC in the other groups. Bacterial families associated with gut homoeostasis, including Rikenellaceae and Peptostreptococcaceae, were increased and those associated with lean body mass (Christenelleaceae) decreased after challenge and at necropsy in MalhLZE pigs and may further explain the ability of these animals to gain weight in the face of ETEC infection. Although not significant, MalhLZE pigs shed 42 and 38 % less Enterobacteriaceae than MalE and MalGoatE pigs, respectively, indicating a less severe infection. Infected pigs supplemented with goat milk or hLZ milk had significantly heavier livers than uninfected and infected pigs not fed milk, which may indicate a more effective innate response to intestinal infection( Reference Thomson and Knolle 51 ). Unlike non-infected animals, there were no distinctions between milk treatments and barrier function. Post-ETEC infection, all measures of permeability were reduced to near levels seen in FF pigs, which is indicative of improved barrier function. This is further supported by decreased bacterial translocation into the spleen. Together, this indicates that barrier function improved in response to infection and inflammation, regardless of treatment, and may be related to the increase in lamina propria thickness seen in the jejunum after ETEC infection, especially in pigs fed hLZ milk. This decrease in permeability may be transient, and probably further decreases nutrient absorption.
The development of a model of malnutrition compounded by infection provides an opportunity to help identify causes of the diseases, and interactions between nutrition and diet, intestinal and faecal microbiota, intestinal infection and inflammation, gut barrier function and the systemic immune system. This study demonstrated that consumption of goat milk alone is able to alleviate some of the clinical and subclinical signs of malnutrition and ETEC infection, and hLZ milk consumption further improves the response. This study further demonstrated the potential for milk from genetically engineered livestock to improve the health and well-being of children suffering from infection and malnutrition, as goat milk containing hLZ has the potential to alleviate some symptoms of malnutrition and protect against ETEC infection, which could markedly improve the quality of life of individuals in developing nations.
Acknowledgements
The authors thank Kent Parker of the UC Davis Swine Research and Teaching Facility for provision of animals; Jan Carlson of the UC Davis Goat Barn for provision of milk; Cristiano Feltrin, Caitlin Cooper and Ronaldo Leite for assistance with sample collection and processing; Matt Menninger and Sami Lotti for cDNA preparation; and Udyam Kumar and Maire Rayburn for conducting histological measurements.
This work was supported by the Bill & Melinda Gates Foundation through the Grand Challenges Explorations initiative (grant no. OPP1067869). The Gates Foundation had no role in the design, analysis or writing of this article.
The authors’ responsibilities were as follows: E. A. M., H. E. R., L. C. G. and J. D. M. designed the study; L. C. G. conducted study, collected and analysed data; M. K. H. performed barrier function assays; M. W. D. and J.-L. W. performed statistical analysis for CBC and blood chemistry data; L. C. G. and E. A. M. drafted the manuscript; E. A. M. had primary responsibility for the final content; and all authors participated in data interpretation and read and approved the final manuscript.
The authors declare that there are no conflicts of interest.
Supplementary material
For supplementary material/s referred to in this article, please visit https://doi.org/10.1017/S0007114518002507


