


Generally, salt (sodium chloride: NaCl) intake is much higher than the WHO-recommended level of 5 g/d( 1 , Reference Brown, Tzoulaki and Candeias 2 ). A high salt intake has been shown to lead to increased blood pressure and is a major cause of CVD( Reference He and MacGregor 3 – Reference Mohan and Campbell 5 ). Most salt intake is due to ‘hidden salt’ in processed foods( Reference James, Ralph and Sanchez-Castillo 6 , Reference Mattes and Donnelly 7 ). Therefore, salt levels in food manufactured by industry need to be reduced. The food industry has already successfully lowered salt levels in many processed foods( Reference Dötsch, Busch and Batenburg 8 – 10 ) without the consumer being aware of this. Nevertheless, the need for more salt reduction in consumer products remains pressing and we have now arrived at the point where further reductions in salt might affect taste and liking of these products.
There is surprisingly little known about consumers’ taste perception and liking of reduced-salt products. A few studies have shown that people can increase their liking for reduced-salt products( Reference Bertino, Beauchamp and Engelman 11 – Reference Bolhuis, Temme and Koeman 14 ). In these studies participants shifted their optimal preferred salt level towards lower salt concentrations. The relationship between liking and salt intensity is described in an ‘optimum salt curve’ in which a certain salt concentration in food is preferred the most, and higher and lower concentrations are liked less( Reference De Graaf, Van Staveren and Burema 15 – Reference Drewnowski, Henderson and Driscoll 17 ). This curve is different for each individual and is based among other factors on prior food experience and customary use of salt and salty products in the diet( Reference Mattes 13 , Reference Zandstra, De Graaf and Mela 16 , Reference Tuorila-Ollikainen, Salovaara and Kurkela 18 , Reference Sullivan and Birch 19 ). Ultimately, it is important to shift this curve to lower salt concentrations and the studies mentioned above indicate that it is possible to ‘learn’ to prefer products with lower salt concentrations. However, in those studies, participants were placed on extreme salt-restricted diets for several weeks to months in a row. This is different from everyday life: in practice, only a few single products within the total diet will be reduced in salt.
From the studies available on consumer's liking of single reduced-salt products, it seems that liking for these reduced-salt products remains within an acceptable range( Reference Bolhuis, Temme and Koeman 14 , Reference Bolhuis, Lakemond and De Wijk 20 – Reference Methven, Langreney and Prescott 25 ). However, the taste and other aspects of these reduced-salt products do differ perceivably from their regular-salt counterparts and consumers have to be motivated to repeatedly try these reduced-salt products before they start learning to like them. Therefore, further attention to increase consumers’ liking of reduced-salt products is required, alongside new approaches to reach this goal. Communication might be one of these approaches to compensate for, or manage expectations of, reduced-salt products.
Previous studies showed that communication can create expectations that influence taste perception and liking. For example, assimilation effects on liking have been shown for marketing communications, such as brand( Reference Di Monaco, Cavella and Di Marzo 26 , Reference McClure, Li and Tomlin 27 ) and price( Reference Lange, Rousseau and Issanchou 28 , Reference Plassmann, O'Doherty and Shiv 29 ). Also, nutritional information with regard to fat( Reference Kahkonen, Tuorila and Rita 30 ) and sugar( Reference Kuenzel, Zandstra and El-Deredy 31 ) increased the liking for these products. In contrast, labelling on ingredients (i.e. soya content in an energy bar) resulted in lower liking scores( Reference Wansink and Park 32 ). Recent research of Liem et al. ( Reference Liem, Aydin and Zandstra 33 ) found similar results on salt; placing the label ‘now with reduced salt’ on a soup decreased expected liking and perceived salt intensity even though all of the soups in their study had the same salt content. A follow-up study showed that this labelling may not just impact immediate taste perception but may drive compensatory salt use, even to the point of overcompensating( Reference Liem, Miremadi and Zandstra 34 ). Communication can thus have positive and negative effects on taste perception and liking, and to phrase the salt label in an optimal way is very important.
Currently, little is known about the impact of communication on long-term liking of reduced-salt products. Almost no scientific data are available regarding whether communication can compensate for perceivable reduced salt levels in food products. Therefore, the aim of the present study was to investigate the impact of communication around salt on long-term liking of reduced-salt soups. Liking was investigated in a natural in-home context over several weeks to reflect an everyday situation. In addition, we conducted a central location test – just before and directly after the in-home use period – to investigate whether liking obtained at the central location would predict liking obtained at the repeated in-home consumption. We hypothesized that positive communication on salt reduction would increase liking of the reduced-salt soups in the long run.
Methods
Participants
The study took place in Paris (France) and a total of 646 French adults (26 % male) participated. Individuals were recruited by an external market research agency (Quovadis, Germany) and were included in the study if they were: aged 18–65 years; did like chicken noodle soup (scoring ≥4 on a 7-point scale); were main brand users of dry soup products; were responsible for the groceries; and consumed dry soups at least once every two weeks. By means of a screening questionnaire, potential participants were divided into three ‘salt-interest-and-action’ groups, based on the five stages of the Trans Theoretical Model of Behavioural Change( Reference Prochaska, DiClemente and Norcross 35 ), i.e. ‘no interest and no action’ group (stage 1), ‘interest but no action’ group (stages 2 and 3) and ‘interest and action’ group (stages 4 and 5). Men and women, age groups and salt-interest-and-action groups were equally divided across test conditions. The study was performed according to ESOMAR guidelines( 36 ) and individuals were paid for participation.
Test products
Three dry soups varying in salt content were included in the study: (i) a benchmark product, which was a chicken noodle soup available on the market in France at that time (370 mg Na/100 ml prepared soup); (ii) a 22 %-reduced-salt soup (290 mg Na/100 ml prepared soup); and (iii) a 32 %-reduced-salt soup (250 mg Na/100 ml prepared soup). The recipe for all soups was the same, only the salt content was different. Each dry soup was packed in a white sachet of dimensions 11 cm × 16 cm with a coloured sticker measuring 8 cm × 4 cm that contained the communication message (see below) and the Knorr brand name and logo. The soups were specifically developed for the present study (Unilever, Heilbronn, Germany). The levels of salt selected for the study were chosen based on the results of two pilot studies. All soups were first tested by eleven trained sensory panellists to ensure that only products that were clearly different in perceived saltiness intensity would be included in the main study. As expected, saltiness of the reduced-salt soups differed from the benchmark (2-AFC difference test; P < 0·05). Additionally, the soups were tested by 105 French consumers in a central location test in a ‘sip test’ where consumers only tasted one spoonful. The consumers from this pilot study did not participate in the main study. The three soups did not differ in liking in the pilot study (benchmark: 4·6 (sd 1·8); 22 %-reduced-salt: 4·6 (sd 2·1); 32 %-reduced-salt: 4·3 (sd 1·9); P > 0·05 on a 10-point scale) and were moderately liked, which assured that an increase in liking after repeated consumption was possible.
Study procedures
The study was divided into three steps. In step 1 all individuals participated in a central location test (CLT 1) in which the three soups were evaluated in random order. Approximately 75 ml of soup was offered at about 65°C in small transparent plastic cups. The following questions were asked: ‘Please indicate how much you look forward to eat this soup right now’, ‘Please taste the product and indicate how much you like the product’, ‘What, if anything, did you particularly like about the product?’ and ‘What, if anything, did you particularly dislike about the product?’. The first two questions had to be answered on a 7-point scale ranging from ‘not at all’ to ‘very much’ and ‘don't like it all’ to ‘like it very much’. The last two questions were open answer questions.
In step 2, participants were divided into six groups and received one of the three soups to use at home for 5 weeks, either with or without communication on the package. Participants were not informed on the real aim of the study but were told that the study consisted of tasting and consuming soups over a 5-week period at home. For the communication message on the packages we chose ‘same great taste, less salt and more herbs’. This is a positively framed message and does not focus only on salt. Participants were asked to consume one full portion of the soup twice weekly. One pack of soup was enough for 1 litre of soup, so participants were able to consume the soups with their family at a conveniently chosen time (e.g. a moment that they would normally consume soup). With the packs of soups participants also received preparation instructions for the soup. Before and during consumption, participants (but not their family) were asked to answer the following questions: ‘How hungry are you at this moment?’, ‘How thirsty are you at this moment?’, ‘Please indicate how much you want this soup right now?’, ‘Please taste the product and indicate how much you like the product’ and ‘How did you consume the soup?’. All questions could be answered on 7-point scales except for the last question which could be answered by selecting one of the following possibilities: ‘alone’, ‘with the whole family’ or ‘with part of the family’.
In step 3, all individuals again participated in a central location test (CLT 2; identical to step 1). Additionally, salt interest and action state based on the Trans Theoretical Model of Behavioural Change( Reference Prochaska, DiClemente and Norcross 35 ) was again assessed (same as in the screening questionnaire). Subsequently, the level of knowledge, attitudes and behaviour regarding salt was measured by asking participants to what extent they agreed with thirteen statements (from 1 = ‘strongly disagree’ to 7 = ‘strongly agree’; Table 1).
Table 1 Mean scores and standard deviations indicating to what extent French consumers (n 646) agreed with statements regarding knowledge, attitudes and behaviour of salt reduction (from 1 = ‘strongly disagree’ to 7 = ‘strongly agree’)
Statistical analysis
Data are presented as means and standard deviations. Statistical analyses were performed using the SPPS statistical software package version 16·0. A value of P < 0·05 was used as criterion for statistical significance.
To evaluate changes in product ratings over time in the in-home period, individual-level regression analyses were performed to calculate individual slopes over time with the product ratings (desire and liking) as the dependent variables and time (exposure days) as the independent variable. These slopes served as an overall measure of the rate of change over time (i.e. increase, stable or decrease pattern), and were subsequently analysed with a 2 × 3 ANOVA testing the effects of communication, product and their interaction on changes in desire and liking. Hunger and thirst ratings in the in-home period were analysed by two-way ANOVA including test group and time (exposure days).
Differences between the two central location tests in desire and liking were analysed with paired t tests. Differences between soups (in the same central location test) were analysed with one-way ANOVA. To investigate if the specific soup consumed during the in-home period affected the ratings of the second central location test, a separate ANOVA was performed within the subgroups. Additionally, mean liking ratings obtained at the central location test and at home were analysed with paired t tests within each experimental group, to test whether liking measured at the central location test (before and after) would predict liking during the repeated in-home consumption. Both t tests using the average in-home rating (as reported) and individual in-home ratings on each day were performed (data not shown as they did not affect the conclusion).
The knowledge, attitudes and behaviour statements measured during the second central location test were analysed between the different experimental groups with one-way ANOVA.
Results
In-home use period
On average, all soups were moderately to well liked, with mean scores ranging from 4·4 to 4·8 on 7-point scales on the first exposure day. Liking scores increased slightly over time for all soups (P < 0·05; Fig. 1). In contrast to our hypothesis, communication had no effect on liking scores; mean liking scores for the ‘with communication’ and ‘without communication’ groups were not statistically significantly different (P > 0·05). The increase in liking in both the ‘with communication’ and ‘without communication’ groups was also equally strong. Interestingly, there were no differences in liking scores between the three different soups, i.e. between the benchmark soup and the reduced-salt soups (P > 0·05).
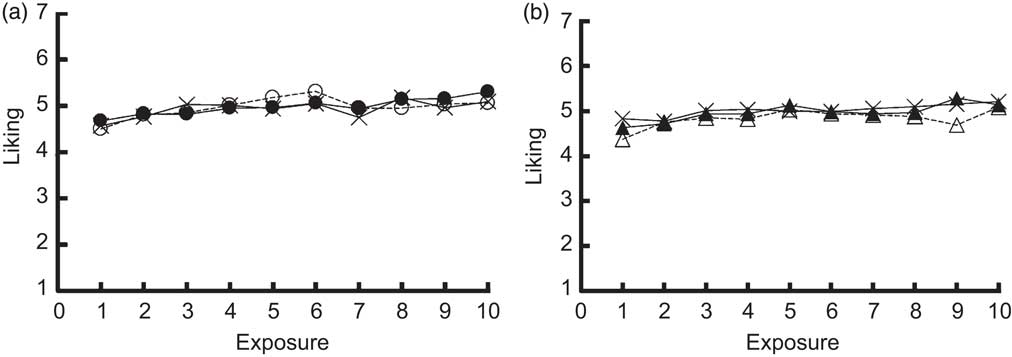
Fig. 1 Liking of the regular-salt soup (benchmark, —×—) and the 22 % (—●—, —▴—) and 32 % (- -○- -, - -▵- -) reduced-salt soups over time (5 weeks, two exposures per week) among French consumers (n 646), measured on a 7-point scale (from 1 = ‘not liked at all’ to 7 = ‘liked very much’), for groups (a) with communication (—●—, - -○- -) and (b) without communication (—▴—, - -▵- -)
Desire to eat the soup remained stable over time with on average a score of 5·3 (sd 0·8). There was no main effect of product or communication on desire-to-eat scores, i.e. scores were not significantly different between the three soups or between the ‘with communication’ and ‘without communication’ groups (P > 0·05).
Hunger and thirst scores were not significantly different between groups or between consumption days (P > 0·05). Average ratings were 5·2 (sd 1·3) for hunger and 4·5 (sd 1·5) for thirst.
In most cases the soup was consumed alone, on average in 59 % of the cases v. 20 % consumed with the family or 21 % with part of the family.
Central location tests before and after the in-home use period
Figure 2 shows the liking and desire ratings of the three soups as measured in CLT 1 and CLT 2. The benchmark soup received significantly higher liking and desire ratings than the reduced-salt soups in both central location tests (P < 0·05). Both reduced-salt soups were comparable in liking and desire. Comparing the results of the central location test before the in-home use period with the one after the in-home use period showed a small but significant decrease in liking for the benchmark soup (from 5·1 (sd 1·4) to 4·9 (sd 1·4); P < 0·05). No significant differences in liking between the two tests were found for the reduced-salt soups. Desire also showed a small but significant decrease after the in-home use period for the benchmark and the 22 %-reduced-salt soup (mean scores before 5·1 (sd 1·2) and 4·8 (sd 1·3), mean scores after 4·9 (sd 1·4) and 4·6 (sd 1·4) for respectively the benchmark and 22 %-reduced-salt soup; P < 0·05).
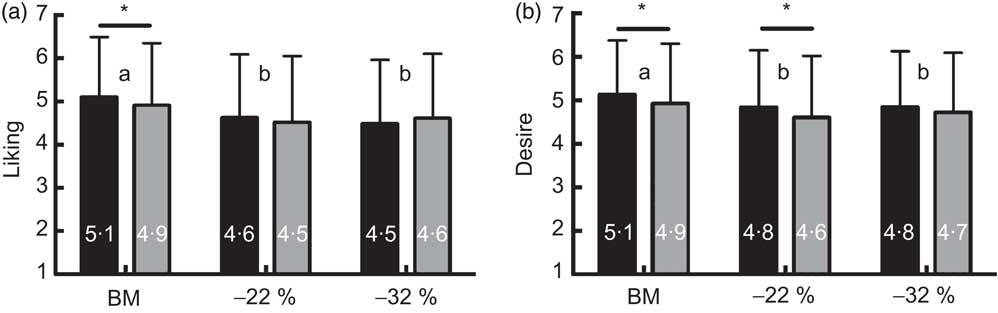
Fig. 2 Liking (a) and desire (b) for the regular-salt soup (benchmark (BM)) and the 22 % and 32 % reduced-salt soups in the first (CLT 1, ![]() ) and second (CLT 2,
) and second (CLT 2,
![]() ) central location test among French consumers (n 646), measured on a 7-point scale (from 1 = ‘not liked at all’/'not desired at all’ to 7 = ‘liked very much’/'desired very much’). Values are means with their standard deviations represented by vertical bars. Mean values were significantly different between CLT 1 and CLT 2 for the same soup: *P < 0·05. a,bMean values for products with unlike superscript letters were significantly different (P < 0·05)
) central location test among French consumers (n 646), measured on a 7-point scale (from 1 = ‘not liked at all’/'not desired at all’ to 7 = ‘liked very much’/'desired very much’). Values are means with their standard deviations represented by vertical bars. Mean values were significantly different between CLT 1 and CLT 2 for the same soup: *P < 0·05. a,bMean values for products with unlike superscript letters were significantly different (P < 0·05)
The second central location test was not significantly affected by the specific product that was consumed during the in-home use period (P > 0·05).
The open answers to the questions about which aspects participants particularly liked or disliked about the products could be categorized into taste, smell, visual and textural aspects (data not shown).
Central location compared with in-home use
Table 2 shows the effect of testing location (i.e. CLT 1, CLT 2 v. at home) on the liking of the soups. The benchmark soups when eaten at home received similar liking scores to those when tasted at the central location (P > 0·05). However, the reduced-salt soups were scored significantly higher in liking when eaten at home than when tasted at the central location (P < 0·05).
Table 2 Mean liking scores and standard deviations of the three soups with and without communication, obtained at the first (CLT 1) and second (CLT 2) central location test and at home, specified for the six groups according to the soup they repeatedly consumed at home, among French consumers (n 646). Paired t tests were used to compare the liking scores of the central location tests with the average in-home scores
*Liking in-home is the average of the ten liking scores at home across the 5 weeks.
Knowledge, attitudes and behaviour
The mean scores showing to what extent participants agreed with the statements regarding knowledge, attitudes and behaviour of salt reduction are presented in Table 1. There were no statistically significant differences between the six experimental groups. This indicates that participants with different states of knowledge, attitudes and behaviours were equally divided over the six experimental groups.
Discussion
The present study investigated the impact of salt labelling and repeated in-home consumption on long-term liking of reduced-salt soups. Beforehand, we expected the reduced-salt soups to be less liked compared with the regular-salt product and that communication would lead to an increased acceptance. However, contrary to our expectations, there was no significant difference in liking between the three soups when consumed at home, whereas the reduced-salt soups were less liked than the regular-salt soup in the central location test. Labelling did not boost liking scores, which is probably explained by the fact that all soups were similarly liked when eaten at home. In addition, results showed that initial liking measured at the central location was not predictive of liking after repeated in-home consumption. Further research with other reduced-salt soups under realistic choice conditions in a natural context is needed to confirm these conclusions.
Salt is commonly used to provide saltiness, to enhance the general flavour of a food and to interact with other flavour elements, e.g. reduce bitterness( Reference Breslin and Beauchamp 37 ). The great challenge is therefore to reduce salt while maintaining the good taste of the original product to ensure consumer liking and enjoyment. In our study, we expected that the reduced-salt soups would be less liked than the regular-salt soup: the salt (NaCl) was removed and not replaced by other salts or adjusted for in the recipe, which resulted in three soups that clearly differed in perceived saltiness. In contrast to expectations, we found no significant difference in liking between the three soups when consumed at home, whereas the reduced-salt soups were less liked than the regular-salt soup in the central location test. This decreased hedonic discrimination in in-home testing confirms previous research( Reference Boutrolle, Arranz and Rogeaux 38 – Reference King, Meiselman and Hottenstein 41 ) and shows that the influence of the eating environment on liking can be powerful. During the central location test, participants received a small portion of soup (approximately 75 ml) which had to be tested alone in isolation, in a laboratory test environment. This is completely different from the in-home situation, in which participants consumed a full portion of the soup, at a moment chosen by the participant him- or herself, in a familiar context and at times in the presence of family and friends. The latter could have had a positive influence on the evaluation of the soups. Previous studies also showed that the preference for test products is higher in in-home tests compared with central location tests( Reference Boutrolle, Arranz and Rogeaux 38 , Reference Boutrolle, Delarue and Arranz 39 ) and that context variables such as the function of the product as a meal component, social interaction, the environment of consumption and freedom of food choice significantly affect product evaluation in a positive direction( Reference King, Weber and Meiselman 40 – Reference Zandstra, De Graaf and Van Trijp 42 ).
Another reason for the similar liking scores of the soups eaten at home could be that participants may have added salt back themselves. A disadvantage of the in-home testing is that one has less control over the use of the products. For instance, we do not know how participants have prepared or consumed the soups at home. It is possible that they added more or less water than instructed and thereby changed salt concentrations or that they added salt or flavour enhancers to the soups, which could explain the unexpected liking scores. It was a deliberate choice not to check salt use at the table or while cooking to maintain the manner of consumption as natural as possible. On a daily basis it is estimated that salt from table salt and cooking is only responsible for approximately 10 % of total salt intake compared with approximately 75 % from processed and restaurant foods( Reference James, Ralph and Sanchez-Castillo 6 , Reference Mattes and Donnelly 7 , Reference Andersen, Rasmussen and Larsen 43 , Reference Sanchez-Castillo, Warrender and Whitehead 44 ). In addition, Beauchamp et al. ( Reference Beauchamp, Bertino and Engelman 45 ) and Shepherd et al. ( Reference Shepherd, Farleigh and Wharf 46 ) showed that participants do not fully compensate via salt shaker for the reduced salt content of their diet or meal, compensation was only 22 % and 20 % respectively. Interestingly, a recent laboratory study by Liem et al. ( Reference Liem, Miremadi and Zandstra 34 ) showed the contrary: participants who received reduced-sodium soups were much more likely to add salt, even to the point of overcompensating. The latter also suggests that explicit questions on liking may be less sensitive to the effects of reduced-salt formulations than other behavioural measures. Therefore, future studies need to include direct measures on: (i) table salt use, to quantify to what extent participants compensate for reductions in salt; and (ii) preference, as more pronounced changes may be demonstrated in terms of preference rather than liking( Reference Zandstra and El-Deredy 47 ).
In the present study, we probably did not shift the ‘optimum salt curve’ towards a lower preferred salt level as the regular-salt soup was still slightly preferred over the reduced-salt soups in the second central location test. We know that shifting this optimum is possible when the total diet is reduced in salt for an extended period of time( Reference Dötsch, Busch and Batenburg 8 , Reference Webster, Dunford and Hawkes 9 ). Together, our observations with a single reduced-salt product in the diet support the notion that it requires a higher exposure frequency over a longer period of time to establish a clear shift in the optimum.
So far, two studies have shown that it is possible to gradually reduce salt content in a single product in small steps over time( Reference Bolhuis, Temme and Koeman 14 , Reference Girgis, Neal and Prescott 21 ). For instance, Girgis et al. ( Reference Girgis, Neal and Prescott 21 ) showed a successful strategy of reducing salt content in bread. Participants’ usual bread was replaced by the study bread for a period of 6 weeks. Gradually, the salt content of the study bread was decreased in steps of 5 %, resulting in the end in a reduction of about 25 %. Although they found significantly declining saltiness scores in the group receiving the reduced-salt bread compared with the control group (bread with usual salt content), they found no differences in liking for the breads. In addition, a few single taste-test studies showed generally that a 20–30 % reduction of salt was still acceptable, although this was product specific( Reference Kremer, Mojet and Shimojo 22 , Reference Methven, Langreney and Prescott 25 , Reference Adams, Maller and Cardello 48 , Reference Malherbe, Walsh and Van Der Merwe 49 ). A current challenge lies in getting consumers to try these products repeatedly, so that they adapt slowly to these product changes over time and eventually shift the optimal preferred salt level.
To date it remains unknown if labels not only influence consumers’ taste perception but also choice of salt-reduced products. In our study, consumers were not free to choose among different versions of soups (e.g. high-salt v. low-salt). Having a choice would more closely reflect the everyday situation in the supermarket and at home, where consumers can choose from several products from different brands. Also, if consumers do not choose reduced-salt products several times it is possible that the number of exposures is not high enough to shift the optimum and hence increase the liking of the foods. Especially, if one industry partner will reduce the salt content of their products whereas the other does not, it might be hard for consumers to learn to like the taste of reduced-salt foods. This advocates for an industry-wide plan to reduce the salt content of certain food segments simultaneously. In fact, not only industry but several stakeholders, e.g. government, public health organisations, chefs, scientists, health-care professionals and also consumers, need to work together and take their responsibility in order to achieve large reductions in salt intake( Reference Dötsch, Busch and Batenburg 8 , Reference Busch, Feunekes and Hauer 50 ).
Liem et al. ( Reference Liem, Aydin and Zandstra 33 ) showed that on-pack reduced-salt labels can have a negative impact on consumers’ expectation and taste perception of salt-reduced products: consumers believed it will be less tasty. In the current study, we framed the salt label in a different, more positive way compared with the one in the study of Liem et al. ( Reference Liem, Aydin and Zandstra 33 ), i.e. from ‘now with reduced salt’ to ‘same great taste, less salt and more herbs’, but interestingly this re-framing of the message did not have any effect on liking. Preferably, we would have included a broader range of products (i.e. clearly varying in liking as intended) across different product categories and using different types of messages to investigate the effects of on-pack salt labelling on long-term liking in a more structural way. This would then have provided a clear opening for communication messages that are framed in such a way that it is motivating for consumers to choose salt-reduced products, not only once but repeatedly over time( Reference Zandstra, Miyapuram and Tobler 51 ).
Finally, the question remains how best to implement these results. The results are found for one specific product, i.e. chicken noodle soup, in one country, i.e. France. From unpublished internal data the authors are aware that salt reduction possibilities depend very much on product type, usage, consumers’ interest and awareness around salt reduction, and all need a different approach. To meet the WHO-recommended level of 5 g of salt daily, further reductions in the salt content of foods are required while maintaining good taste and consumer liking, as well as a change in attitudes and behaviour among consumers. Further studies in various countries are recommended to gain a better understanding of consumers’ interest in salt reduction and motivation to change towards reduced-salt alternatives, i.e. population-based perceptions regarding salt and level of intake, drivers of intake, how people use salt and preferred ways of communication. These findings will support ongoing development of effective global strategies for salt reduction.
Conclusion
Research in the area of salt reduction is limited while the need for acceptable low-salt products is high. The present study showed that a salt reduction of up to 32 % in a chicken noodle soup did not affect long-term liking scores obtained within a natural in-home context. In addition, initial liking measured at the central location was not predictive of liking after repeated in-home consumption. How far we can go in reducing salt in other products without compromising product quality, and how this impacts consumers’ choice behaviour and in turn table salt use at home, are still unanswered questions.
Acknowledgements
Sources of funding: The study was funded by Unilever. Conflicts of interest: There are no conflicts of interest to declare. Ethics: The study was not approved by an ethical committee, but was performed according to ESOMAR guidelines (2010). Authors’ contributions: A.A.W. helped design the experiment, collected and analysed the data, and contributed significantly to writing the manuscript, D.H.A.v.H. provided significant advice and consultation. N.Z. analysed the data and contributed significantly to writing the manuscript. E.H.Z. helped design the experiment and contributed significantly to writing the manuscript. Acknowledgements: The authors would like to thank Graham Cleaver for his critical help in the statistical analyses, Beatrijs Hauer and Gerda Feunekes for their valuable input in earlier versions of this paper, and Edouard Bonnet for the development of the soups.


