


Nutrient profiling (NP) systems are able to classify foodstuffs relative to each other according to their contribution to balanced diets( 1 ). Those systems, recognised as relevant public health tools, are developed with the aim to guide consumers towards healthier food choices( Reference Lobstein and Davies 2 ) through food labelling( Reference Roodenburg, Popkin and Seidell 3 ), regulation of nutrition and health claims( 4 ) and control of advertising towards children( Reference Matthews 5 , 6 ). For food manufacturers, NP systems can be used in order to improve the nutritional quality of their product portfolio( Reference Nijman, Zijp and Sierksma 7 , Reference Vlassopoulos, Masset and Charles 8 ). In view of those many different purposes, currently available NP systems are based on different algorithms. Some of them apply the same algorithm to each food (‘across-the-board’), whereas others are category specific( Reference Scarborough, Rayner and Stockley 9 ). Number, type (to encourage and/or to limit) and level of recommended value for nutrients to be included in the algorithm, as well as functional unit (per energy content, grams or portion size), also need to be defined when developing an NP system( Reference Drewnowski, Maillot and Darmon 10 , Reference Drewnowski 11 ). Finally, the NP systems’ outcome can be disseminated either as one (or more) quantitative score(s) or as classes (e.g. PASS and FAIL)
The WHO has published guidelines to develop and validate NP systems( 12 ). The comparison of foods classifications produced by the newly developed NP system with those from an already validated NP system remain one of the simplest validation process. Another method for validating NP models is the assessment of construct validity against healthy and unhealthy diets( 12 ). This implies to test whether healthy foods (identified by nutrient profile system tested) make healthy diets, and unhealthy foods make unhealthy diets using validated measures of dietary quality.
The Nestlé Nutritional Profiling System (NNPS) has been designed to guide nutrition-oriented reformulation of foods and beverages, as described in detail previously( Reference Vlassopoulos, Masset and Charles 8 ). A previous study highlighted the potential beneficial effect on the food supply (especially a reduction of SFA, Na and added sugar) of reformulating foods according to the NNPS in five countries (USA, UK, France, China and Brazil)( Reference Combet, Vlassopoulos and Mölenberg 13 ). Two studies using diet simulation approaches indicated that following the NNPS guidelines for food reformulation was associated with positive impacts in dietary intakes, especially linked to a reduction of nutrients to limit (energy, SFA, Na and added sugars) intakes( Reference Masset, Mathias and Vlassopoulos 14 , Reference Gressier, Privet and Mathias 15 ). However, neither the comparison of food classification produced by NNPS with those from an already validated NP model nor the construct validity test (higher intakes of foods positively rated by NNPS system are associated with healthier diets) of this model were carried out.
The objective of this paper was to conduct validation tests of the NNPS, by comparing its outcomes with the validated UK Ofcom NP system and by measuring its contribution to dietary quality in two nationally representative dietary surveys (France and the USA).
Methods
Databases
Dietary intakes were retrieved from two representative national dietary surveys conducted in France and the USA (details are provided in the online Supplementary Figs S1 and S2). For France, dietary data were derived from the 7-d food records of the Individual and National Survey on Food Consumption 2 (INCA2) conducted in 2006–2007 by the French Agency for Food, Environmental and Occupational Health Safety( 16 ). For the USA, the first 24-h dietary recall of the National Health and Nutrition Examination Surveys (NHANES) 2011–2012( 17 ) wave was used. The analysis was conducted on a final sample of 1918 adults (776 men and 1142 women) for France and 5073 adults (2533 men and 2540 women) for the USA. The use of supplements was not taken into consideration. The two studies were conducted according to the guidelines laid down in the Declaration of Helsinki( 18 ), and all procedures involving human subjects were approved by the NCHS Research Ethics Review Board (Protocol no. 2011–17) for NHANES and the French Data Protection Authority (Commission Nationale Informatique et Libertés) for INCA2. Written informed consent was obtained from all subjects.
The two related food composition tables were used: the Ciqual 2013 for France( 19 ), complemented with added sugars estimations based on the methodology proposed by Louie et al.( Reference Louie, Moshtaghian and Boylan 20 ) and using a national average food recipes database, and the Food National Database for Dietary Surveys (FNDDS) 2011–2012 completed with added sugar contents from the Food Patterns Equivalents Database for the USA( 21 , 22 ).
In both data sets, each food was categorised into one of the thirty-five categories of the NNPS( Reference Vlassopoulos, Masset and Charles 8 , Reference Combet, Vlassopoulos and Mölenberg 13 ), by four trained researchers by (1) identifying the product role in the diet and (2) grouping products based on similar nutrient composition and/or challenges in the reformulation process. When categorisation was not straightforward, allocation to a specific category was reviewed by the team.
Nutrient profiling systems
All foods and beverages declared to be consumed by INCA2 and NHANES participants were scored against the NNPS and UK Ofcom NP systems.
The NNPS is a category-specific NP system that sets nutrient targets per serving as consumed, based on age-adjusted dietary guidelines( Reference Vlassopoulos, Masset and Charles 8 , Reference Combet, Vlassopoulos and Mölenberg 13 ). For every thirty-five categories, targets were defined for energy, total and saturated fats, added sugars and Na; for some categories, targets for other nutrients such as protein, fibre and Ca were set according to their specificity (e.g. Ca target for dairy products). The NNPS outcome is a ‘PASS’ if all nutritional targets are reached by a product, and a ‘FAIL’ otherwise. NNPS categories are defined for packaged food, and beverage products aimed at the general population, unprocessed fruits, vegetables, meat and fish products are out-of-scope of the NNPS, as well as alcoholic beverages or products with regulated composition (e.g. infant formula, medical foods).
NNPS outcomes were compared with the UK Ofcom NP system, which has been developed in the UK in order to distinguish ‘healthier’ and ‘less healthy’ foods and drinks for television advertising( Reference Rayner, Scarborough and Lobstein 23 ). This profiling system is considered as ‘across-the-board’ by applying the same algorithm to all products except alcoholic beverages. By calculating the number of points for ‘negative’ nutrients (energy, saturated fats, total sugar and Na), which can be offset by points for ‘positive’ nutrients (fruits and vegetables, fibre and protein), the UK Ofcom defines a single score. Points are allocated on the basis of the nutritional content in 100 g of a food product or a drink. On the basis of this score, the model gives a binary outcome, which determines whether the food or drink is ‘healthier’ or ‘less healthy’ – that is, whether the food can be advertised to children or not. Two threshold levels are set: one for all food products and another for beverages.
Indicators of nutritional quality of diets
Nutrient intakes of each individual were estimated by matching food consumption (from INCA2 and NHANES) to food composition databases (CIQUAL and FNDDS, respectively). Then, nutritional quality of diets in each country was assessed using three nutrient-based diet quality indicators and a country-specific food-based index. For the latter, the Programme National Nutrition Santé Guideline Score (PNNS-GS)( Reference Estaquio, Kesse-Guyot and Deschamps 24 ) was applied to French diets, and the Healthy Eating Index 2010 (HEI-2010)( Reference Guenther, Casavale and Reedy 25 ) to US ones. The PNNS-GS is used to estimate the adherence of a diet to the French Nutrition and Health Program (PNNS) recommendations by allocating points when the food consumption is in accordance with the recommendation. It is between −1 and 15 and was shown to be positively correlated with better nutrient intakes and nutritional status( Reference Estaquio, Kesse-Guyot and Deschamps 24 ). All foods declared to be consumed by the French participants of the study were classified into the PNNS categories. Then the amount of food consumed for each category was estimated for each individual and points were attributed according to the PNNS-GS algorithm( Reference Estaquio, Kesse-Guyot and Deschamps 24 ). Because physical activity was not possible to estimate, the PNNS-GS ranged between −1 and 12·5 in the present study. The HEI-2010 is a validated measure of diet quality that assesses conformance to the 2010 Dietary Guidelines for Americans( Reference Guenther, Casavale and Reedy 25 ). It combines twelve components (total fruit, whole fruit, total vegetables, greens and beans, whole grains, dairy products, total protein food, seafood and plant proteins, fatty acids, refined grains, Na and empty energy content), whose sum has a maximum of 100 points.
The following daily nutrient-based diet quality indicators were estimated for each individuals of the two studies: mean adequacy ratio (MAR), mean excess ratio (MER) and solid energy density (ED). As previously described( Reference Madden, Goodman and Guthrie 26 – Reference Torheim, Ouattara and Diarra 28 ), the MAR was calculated as the mean percentage of daily recommended intakes for twenty-two nutrients; each ratio (intake/recommended intake×100) was truncated at 100 so that a high intake of one nutrient could not compensate for the low intake of another. It was used as a positive indicator of nutritional quality. The MER( Reference Vieux, Soler and Touazi 29 ) was built similarly to the MAR but included only nutrients to be restricted (Na, added sugars and SFA). In the same way as for the MAR, each ratio (intake/recommended intake×100) could not go under 100, so that a low intake of a nutrient could not compensate for the high intake of another. It thus correlates positively with bad nutritional quality. The ED was calculated by dividing solid dietary weight (g) by energy intake (kJ (kcal)) coming from solid foods for each individual( Reference Ledikwe, Blanck and Khan 30 ). Dietary ED was used as an indicator of bad nutritional quality, as decreasing the ED of the diet is recommended by several public health authorities( 31 , 32 ) to prevent obesity and obesity-associated disease conditions( Reference Ledikwe, Blanck and Kettel Khan 33 ).
Statistical analysis
The analysis was split into a food- and a diet-based description (Table 1).
Table 1 Validation steps followed, analyses and statistical tests used in France and in the USA
NP, nutrient profiling; NNPS, Nestlé Nutritional Profiling System; MAR, mean adequacy ratio; MER, mean excess ratio; ED, energy density; PNNS-GS, Programme National Nutrition Santé Guideline Score; HEI-2010, Healthy Eating Index 2010.
At the food level, the nutrient compositions of foods were used to estimate the UK Ofcom score distributions across NNPS PASS, FAIL and out-of-scope products. The effect of the NNPS classification on the UK Ofcom score was tested either with Welch or usual ANOVA according to the outcome of the Levene’s test of homogeneity of variances. The UK Ofcom score was then transformed into its binary outcome to test the agreement between NNPS and UK Ofcom binary outcomes. The κ coefficient( Reference Viera and Garrett 34 ) was computed and its difference with 0 was tested.
At a diet level, individuals of both countries were classified according to two methodologies: first, the individual MAR, MER and ED scores were compared with their respective country- and sex-specific medians and each individual was classified within four groups of gradual nutritional quality (‘high’, ‘intermediate +’, ‘intermediate −’ and ‘low’)( Reference Vieux, Soler and Touazi 35 ). The nutritional quality of a diet was defined as ‘high’ if its MAR was above the median and its MER and ED below their respective medians. Second, individuals were classified by dividing the sample in quartiles of food-based diet quality indicators (i.e. PNNS-GS and HEI-2010). Contributions of NNPS PASS, FAIL and out-of-scope food items to total energy intakes were compared among those groups and tested by ANOVA and tendency tests. Finally, the relations between contributions of NNPS PASS, FAIL and out-of-scope to total energy intakes and other dietary indicators of nutritional quality (as well as components of country-specific food-based index) were assessed through both simple and multiple (adjustment for age, sex and energy intakes) linear regressions. The tests were conducted using the statistical software package SAS version 9.4 and the SURVEYREG, SURVEYMEANS and SURVEYFREQ procedures.
Results
In both France and the USA, food items with a NNPS FAIL outcome had a significantly higher UK Ofcom score than food items with a PASS outcome (Fig. 1); that is, they were ‘less healthy’ according to the UK Ofcom measure. In most of the thirty-five categories, this difference remained, except, for example, in cakes, cookies and desserts and confectionery bars in France and cakes, cookies and desserts in the USA (online Supplementary Fig. S3). NNPS FAIL products also showed a significantly higher variability of UK Ofcom score than NNPS PASS products (Fig. 1).
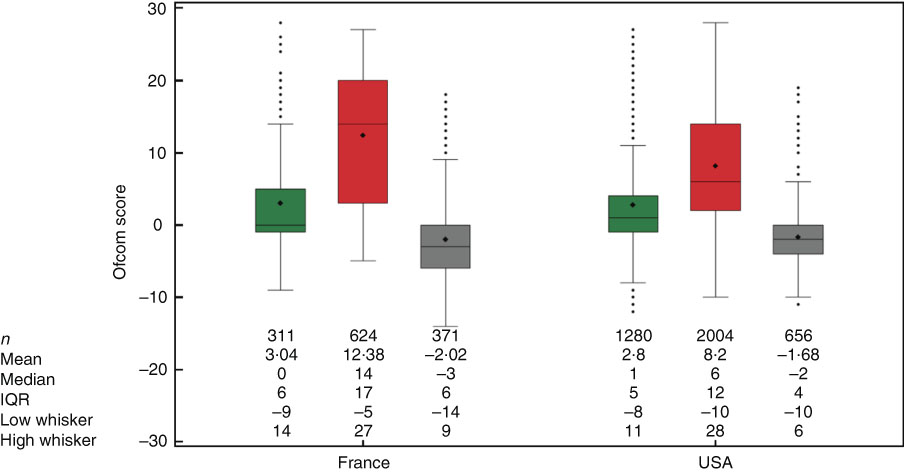
Fig. 1 UK Ofcom score among Nestlé Nutritional Profiling System (NNPS) PASS (![]() )/FAIL (
)/FAIL (![]() )/out-of-scope (
)/out-of-scope (![]() ) food items in France and the USA. The length of the box represents the interquartile range (IQR; the distance between the 25th and 75th percentiles). The symbol (♦) in the box interior represents the group mean. The horizontal line in the box interior represents the group median. The horizontal lines outside the box (whiskers) are drawn at maximum value for each group (respectively, minimum value) or at last value inside Q3+1·5×IQR (respectively, first value inside Q1−1·5×IQR). The points outside the box represent the outliers (any points that are a distance of more than 1·5×IQR from the box). Within France and the USA, homogeneity of variances among NNPS status was tested using Levene’s test and mean UK Ofcom scores were statistically compared using general linear models. Both variances and means (two by two comparisons using Bonferroni’s correction) were significantly different from one NNPS outcome to another in both countries.
) food items in France and the USA. The length of the box represents the interquartile range (IQR; the distance between the 25th and 75th percentiles). The symbol (♦) in the box interior represents the group mean. The horizontal line in the box interior represents the group median. The horizontal lines outside the box (whiskers) are drawn at maximum value for each group (respectively, minimum value) or at last value inside Q3+1·5×IQR (respectively, first value inside Q1−1·5×IQR). The points outside the box represent the outliers (any points that are a distance of more than 1·5×IQR from the box). Within France and the USA, homogeneity of variances among NNPS status was tested using Levene’s test and mean UK Ofcom scores were statistically compared using general linear models. Both variances and means (two by two comparisons using Bonferroni’s correction) were significantly different from one NNPS outcome to another in both countries.
The overall percentage of agreement between binary NNPS and UK Ofcom classifications was 75·7 % in France and 68·8 % in the USA. κ coefficients indicated a moderate (κ=0·47) and a fair (0·37) agreement, respectively (Table 2). Among categories with five food items or more, the percentage of agreement went from 31·3 to 100 % in France and from 10·3 to 94·1 % in the USA. In France (respectively, in the USA), five (respectively 15) κ coefficients were significant. Those coefficients went from 0·51 (moderate agreement) to 1 (almost perfect agreement) in France and from 0·11 (slight agreement) to 0·78 (substantial agreement) in the USA (Table 2).
Table 2 Nestlé Nutritional Profiling System (NNPS) and UK Ofcom outcome in the different NNPS categories in France and the USA* (Numbers and percentage of agreement)
* No percentage of agreement if n 0. No κ coefficient and Pvalue if all food items in a category have the same outcome (all PASS or all FAIL).
† These include porridges and other hot cereal items; ready-to-eat cold cereals were not assessed with the NNPS; other grain products such as pasta, rice and bread were classified as ‘Side dishes’.
The percentage of energy coming from foods and beverages in scope of NNPS assessment, that is processed multi-ingredient food product, was 77 % in France and 84 % in the USA (Table 3). The MAR was 78·8 % in France and 77·4 % in the USA, the MER was 30·4 and 58·6 % in France and the USA, respectively, and solid ED was 724 kJ/100 g in France and 803 kJ/100 g in the USA. The total quantity consumed was 2745 g/d in France and 3614 g/d in the USA.
Table 3 Proportion of women, age and diet characteristics (energy coming from in-scope products, quantity consumed, energy intake and nutritional quality indicators) of the study samples (Mean values with their standard errors)
MER, mean excess ratio; MAR, mean adequacy ratio; HEI-2010, Healthy Eating Index 2010; PNNS-GS, Programme National Nutrition Santé Guideline Score.
The proportions of high nutritional quality diets (MAR higher than median and MER and ED lower than their respective medians) were 6 % in France and 9 % in the USA. In both countries, the contribution to energy intake of NNPS PASS and NNPS out-of-scope products linearly increased significantly with the increase of nutritional quality of diets (Fig. 2(a)). In contrast, the contribution of NNPS FAIL decreased with the increase of the diet quality. In the high nutritional quality group of eaters, the cumulative contribution of out-of-scope and NNPS PASS foods reached 67 and 70 % in France and the USA, respectively, whereas it was only 51 and 34 % in the low nutritional quality group of eaters, respectively. In France and the USA, the contributions of NNPS PASS, FAIL and out-of-scope food items to total energy intakes were significantly different between the four quartiles of food-based indicators – that is PNNS-GS and HEI-2010, respectively (Fig. 2(b)). The linear tendency of energy coming from each NNPS outcome was significant in both countries.
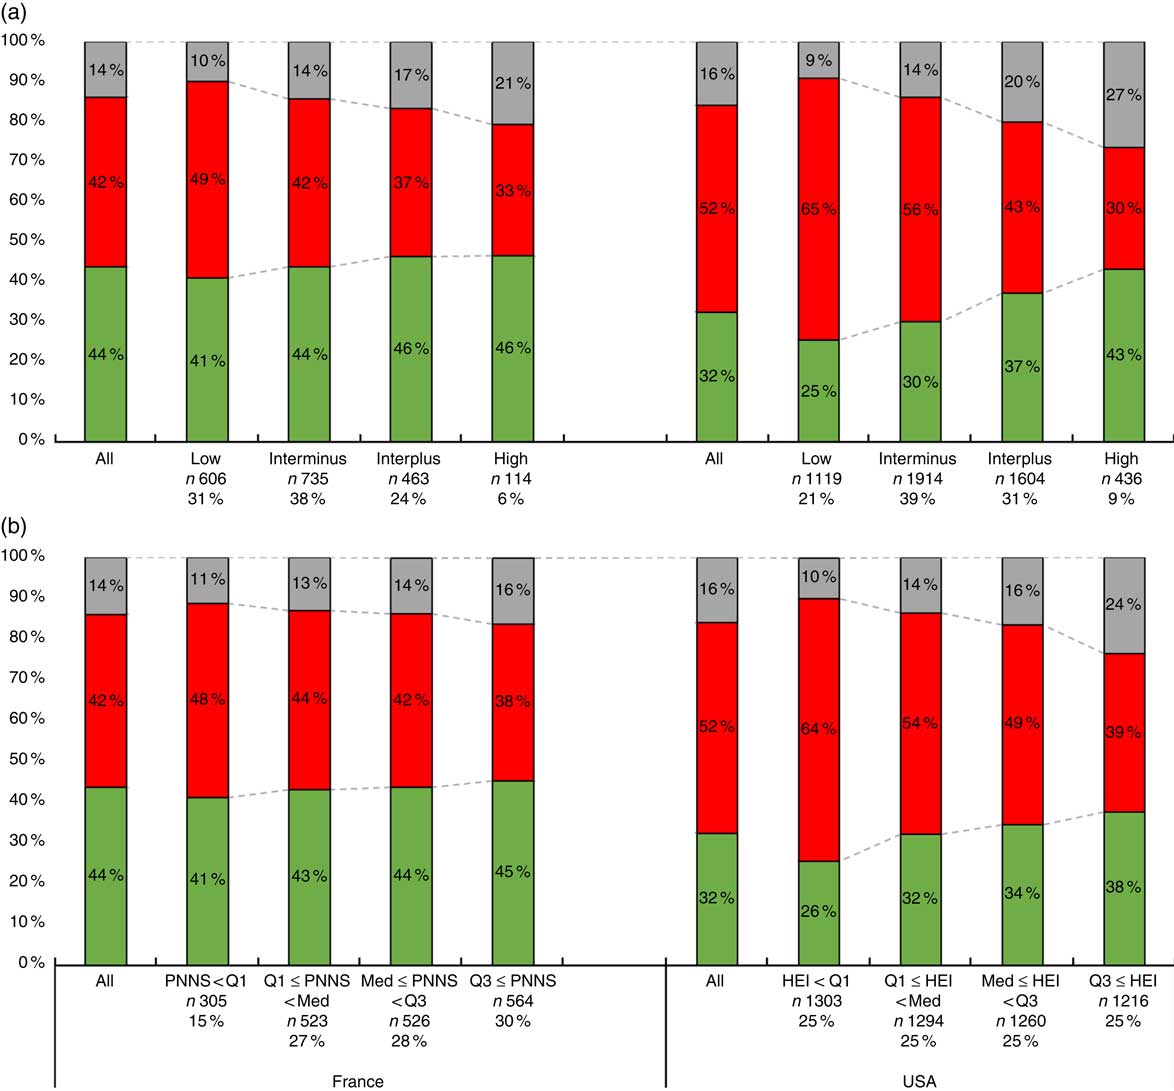
Fig. 2 Raw mean contributions of Nestlé Nutritional Profiling System (NNPS) PASS (![]() )/FAIL (
)/FAIL (![]() )/out-of-scope (
)/out-of-scope (![]() ) foods and beverages to total energy intake among four groups of eaters (nutrient-based quality of diet) (a), and among four groups of eaters (food-based quality of diet) (b) in France and the USA. Contributions were significantly different between groups of nutritional quality for each grouping method and both countries (raw and adjusted for age, sex and total energy intake; Fisher’s tests). Contributions of each NNPS outcome to energy intake were significantly (P<0·05) increasing/decreasing linearly between each group of nutritional quality in both countries (raw and adjusted for age, sex and total energy intake; Wald’s tests). PNNS, Programme National Nutrition Santé; HEI, Healthy Eating Index.
) foods and beverages to total energy intake among four groups of eaters (nutrient-based quality of diet) (a), and among four groups of eaters (food-based quality of diet) (b) in France and the USA. Contributions were significantly different between groups of nutritional quality for each grouping method and both countries (raw and adjusted for age, sex and total energy intake; Fisher’s tests). Contributions of each NNPS outcome to energy intake were significantly (P<0·05) increasing/decreasing linearly between each group of nutritional quality in both countries (raw and adjusted for age, sex and total energy intake; Wald’s tests). PNNS, Programme National Nutrition Santé; HEI, Healthy Eating Index.
In both countries ED and MER were positively correlated with the contribution of NNPS FAIL food items to total energy intake and negatively correlated with the contribution of NNPS PASS and out-of-scope food items (Table 4). In contrast, the MAR and the PNNS-GS in France and the HEI-2010 in the USA were positively correlated with the contribution of NNPS PASS and out-of-scope food items to total energy intake and negatively correlated with the contribution of FAIL food items to total energy intake. In France, consumption of starchy foods, alcoholic and non-alcoholic beverages and fruit and vegetables were the main PNNS-GS components associated with one or more of the NNPS outcomes’ contributions. In the USA, almost all components of HEI-2010 score were associated with the contribution to energy of NNPS PASS, FAIL or out-of-scope, but the consumption of empty energy content (i.e. solid fats, alcoholic beverages and added sugars) was especially correlated with NNPS PASS and FAIL, and the consumption of refined grains with out-of-scope (online Supplementary Table S1).
Table 4 Raw and adjusted (for age, sex and total energy intake) standardised β-coefficients for the association between contribution of Nestlé Nutritional Profiling System (NNPS) PASS/FAIL/out-of-scope and indicators of nutritional quality of diets in both countriesFootnote *
MAR, mean adequacy ratio; MER, mean excess ratio; PNNS-GS, Programme National Nutrition Santé Guideline Score; HEI-2010, Healthy Eating Index 2010.
* All standardised β-coefficients were significantly different from zero (P<0·05), except †.
† Raw standardised coefficient for contribution of NNPS PASS was not significantly different from zero (P>0·05).
Discussion
By referring to the WHO guidelines to validate NP systems( 12 ) as a model to test the validity of the NNPS, we showed that the NNPS classified foods similarly as the validated UK Ofcom NP system, and that a high (respectively, low) dietary energy contribution of NNPS PASS (respectively, NNPS FAIL) foods and beverages was positively associated with diet healthiness in both France and the USA.
At the food level, the NNPS showed a good convergence with both the UK Ofcom score (lower Ofcom score in NNPS PASS than in NNPS FAIL) and the UK Ofcom food classification (75·7 and 68·8 % of overall agreement in France and the USA, respectively). This first validation step was reinforced as the convergence remained within food categories, demonstrating the ability of the NNPS to discriminate foods within categories. The UK Ofcom NP system was chosen as the NP system reference for several reasons: it was validated using a similar procedure as the one presented here( Reference Arambepola, Scarborough and Rayner 36 ), it was applied to different national databases( Reference Jenkin, Wilson and Hermanson 37 – Reference Julia, Kesse-Guyot and Touvier 39 ) and it is used in real life today by the UK broadcasting regulator to limit advertising to children( 40 ). Moreover, it has been used as inspiration for allowing health claims on foods in Australia, New Zealand and South Africa( 12 ), for food labelling in Australia, New Zealand and France( Reference Cooper, Pelly and Lowe 41 , 42 ) and for regulating television advertising of foods to children in Ireland and New Zealand( Reference Rayner 43 ). Nonetheless, good agreement was challenged within some food categories. For example, in the ‘cakes, cookies, desserts’ category, the agreement was actually high (83 % in France and 71 % in the USA), but the high proportion of both NNPS FAIL (87·6 %) and UK Ofcom less healthy (95·5 %) products led to non-significant κ coefficient. This was explained by big variations in portions sizes: while the NNPS took these differences into account, the Ofcom did not as it is calculated per 100 g. As a result, the variability of UK OFCOM score was very high in the NNPS FAIL group, which led to the non-significant results.
At the diet level, higher contributions of NNPS PASS and lower contributions of NNPS FAIL products to energy intake were associated with higher diet quality, in both countries and with all the diet-quality scores (nutrient- or food-based, expressed in class or in a continuous way). These results suggested that dietary shifts or reformulations towards products meeting the NNPS standards would result in higher dietary quality. Yet, trends and correlations with dietary quality were stronger when considering the contribution of NNPS FAIL products to energy intakes than when considering the contribution of NNPS PASS products. Similarly, stronger associations were observed between individual components of the diet quality indexes and contribution of NNPS FAIL products. These differences could be explained by characteristics of the NNPS.
First, the NNPS is mainly based on nutrients to limit, with only twelve categories (out of thirty-five) including positive nutritional factors. Therefore, obtaining a PASS status is more linked to a lower content of nutrients to limit rather than a higher nutritional density. This explains the higher associations observed between the NNPS Pass contributions and the negative nutrient scores (MER, ED). These results highlight that, in line with many other reformulation initiatives, the NNPS is mainly a ‘nutrient-to-limit reformulation’( Reference Scrinis and Monteiro 44 ) system, and confirms previous observations that potential reformulations following NNPS standards would lead to reductions in intakes of nutrients to limit but would have limited effect on intakes of fibres and Ca( Reference Gressier, Privet and Mathias 15 ). Hence, the more systematic inclusion of positive nutritional factors, including ingredients or food groups to be promoted, could allow the NNPS to become a more ‘positive-nutrient reformulation’ system( Reference Scrinis and Monteiro 44 ). Two specificities of the NNPS are that it includes total and trans-fat, and fructose in addition to saturated fats, added sugars and Na as nutrients to limit, and that all nutrient criteria need to be met to obtain a PASS status. These characteristics would need to be maintained to ensure that no substitutions are made between different sources of fats or sugars when reformulating products.
Second, NNPS categories focus on transformed foods, in which there is a recipe, as its goal is to guide product reformulation. These categories, defined on the basis of main ingredients and processing (e.g. freezing, drying and so on), are not necessarily linked to guidelines that mention separate food groups irrespective of the degree of processing and of their combination. In some cases, NNPS PASS foods belong to categories that are usually not recommended in guidelines, and are products that can remain carriers of nutrients to limit – for example, in the cake, cookies and deserts category. As a result, a higher consumption of an NNPS PASS cookie is likely not to increase one’s HEI-2010 or PNNS-GS score, and might even lower these scores (e.g. through the empty energy content component of the HEI-2010). On the other hand, a higher contribution of a NNPS FAIL cookie, which is directly linked to guidelines, would have been captured as such by the diet-quality scores used in this analysis. Similarly, the NNPS categorisation explains the stronger association observed between contribution of NNPS out-of-scope products and diet quality v. contribution of NNPS PASS products, as most of these out-of-scope products are ‘raw’ and unprocessed products directly linked to guidelines as mentioned above. As a result, the further inclusion of such raw ingredients and unprocessed foods as new categories or as positive nutritional factors could allow the NNPS to be better aligned with existing food-based recommendations. In addition, a fewer number of categories could allow the NNPS to better predict overall dietary quality( Reference Scarborough, Arambepola and Kaur 45 ). Indeed, while traditional reformulation promotes product transformation or equivalently within-category shifts (e.g. from sweetened yogurt to unsweetened yogurt), such an approach was shown not to be sufficient to achieve optimal dietary quality when following NNPS standards( Reference Gressier, Privet and Mathias 15 ). To further assess the potential contribution of NNPS PASS, FAIL and out-of-scope products to diets of optimal nutritional quality, and the relative effect of within- v. between-category shifts, diet modelling approaches could be used( Reference Maillot, Vieux and Amiot 46 , Reference Maillot, Drewnowski and Vieux 47 ).
Although the inclusion of two countries increased the robustness of the study by showing that results were similar in both contexts, the results should not be compared per se as the two dietary surveys followed different methodologies. As an example, the French food table is composed by a lower number of foods than in the USA, which might induce less significant agreement when considering a food category per food category analysis. The portion sizes used to categorise foods according to the NNPS algorithm were based on the Reference Amounts Customarily Consumed defined in the USA. As no regulated serving size is available in France, these portion sizes were applied to the French food table, whereas it is known that French people usually consume smaller portion sizes than the US-population( Reference Rozin, Kabnick and Pete 48 ). Analysis using serving sizes derived from French national food surveys might be more appropriate when considering French data sets. Further, the estimation of intakes varied between the INCA2 and NHANES surveys. The INCA2 7-d food records allowed to limit intra-individual variability but relied more strongly on participants memory and may have influenced dietary behaviours during data collection time( Reference Shim, Oh and Kim 49 ). On the other hand, the NHANES 24-h recall can limit misreporting thanks to the Automated Multiple-Pass Method( 50 ), but using only 1 d of data may not reflect individuals usual behaviours. We followed the usual survey-specific analyses methods as the objective was not to compare absolute estimates between the two surveys but trends across the populations. As recommended by Subar et al.( Reference Subar, Freedman and Tooze 51 ), we used self-reported energy intakes as adjustment parameters, and expressed relative contributions of NNPS PASS/FAIL foods rather than absolute estimates.
At the diet level, indicators of diet quality were not based on the same standards. For example, the MER appeared to be higher in the USA (30·4 % in France and 58·6 % in the USA) partly because of a difference in dietary reference values for SFA (10 % of energy intake in France, 7 % in the USA) and Na (2365 mg/d for women and 2759 mg/d for men in France and 2300 mg/d in the USA). In addition, the association between energy contribution of NNPS FAIL products and dietary quality appeared to be stronger in the USA because individuals in the low nutritional quality group had a higher contribution of NNPS FAIL foods in the USA than in France. In contrast, when considering individuals in the high nutritional quality group, the contribution of NNPS FAIL to energy intake was similar between both countries. This suggests high disparities in food consumption and nutrient intakes in the US population and a particular need to develop adapted policy strategies to improve nutritional intakes of individuals with poor dietary habits. These trends might also be explained by differences in the nutritional profiles of foods and beverages available in the two countries. Further investigations ought to assess along harmonised lined the nutritional quality of food and beverages available to individuals in different countries.
Conclusion
The good agreement of food classification with UK Ofcom system and the encouraging outcomes of construct validity tests against healthy and unhealthy diets in two nationally representative surveys suggest that applying the NNPS as a guiding principle for food reformulation could be a powerful initiative from the food industry to complement other policies in order to improve nutritional quality of diets. Nonetheless, the results highlighted potential options for an evolution of the NNPS, which would allow this reformulation-oriented system to be better aligned with current dietary guidelines.
Acknowledgements
The authors thank Fabio Mainardi (Nestlé Institute of Health Science) for providing the HEI-2010 calculations.
This study was funded by Nestec SA.
G. M. designed and conducted the research, analysed data and wrote the paper. L. P. analysed data and wrote the paper. F. V. designed the research and wrote the paper: All authors have primary responsibility for final content.
At the time of submission, G. M. was employed by Nestec SA, Switzerland; L. P. and F. V. were employed by MS-Nutrition, France. MS-Nutrition received funding from Nestec SA for this study.
Supplementary material
For supplementary material/s referred to in this article, please visit https://doi.org/10.1017/S0007114518002490


