


Japan has experienced a remarkable dietary transition in the decades following World War II(Reference Matsumura1–Reference Smil and Kobayashi3). Dietary transition together with the expansion of urbanisation, socioeconomic changes and less physical activity has been associated with the epidemic of obesity/overweight and lifestyle-related non-communicable diseases and has become a significant health issue in recent years(Reference Afshin and Forouzanfar4). Although Japan has the lowest prevalence of obesity among developed countries, the mean BMI has consistently increased in both men and women since the 1970s, and approximately 30 % of men are overweight(Reference Afshin and Forouzanfar4). In contrast, the mean BMI in young women has decreased, and excessive thinness in young women is also regarded as a public health concern in Japan(Reference Yoshiike, Kaneda and Takimoto5–Reference Sugawara, Saito and Sato9).
Japan, the country with the longest life expectancy(10), has the highest ageing population in the world, with >28 % representing the elderly population (aged ≥65 years)(10). Thus, a practical nutritional assessment of the elderly by evaluating the anthropometric status (such as BMI) is particularly essential for developing better healthcare policies for healthy ageing.
Adult height can be a useful indicator of the nutritional status and health of a population, which is determined based on the nutritional status in their early life(Reference Barrett, Barman and Boitano11). Being taller is associated with enhanced longevity and a decreased risk of mortality from stroke, CVD, etc.(Reference Perkins, Subramanian and Davey Smith12–14). Several cross-sectional studies in Japan have reported secular trends in height, weight and BMI of children, adolescents, young adults and the middle-aged population(Reference Yoshiike, Seino and Tajima15–Reference Hori, Kitamura and Kiyama18). However, evidence remains sparse for Japanese elderly populations regarding changes in trends in height, weight, BMI and other anthropometric parameters. There is evidence that anthropometric status such as height, weight and BMI are important markers of health in the elderly. For example, a previous report estimated that a 2–4 cm decline in peak height occurs during a person’s lifetime, probably owing to a decrease in bone and muscle mass(Reference Fernihough and McGovern19). Malnutrition and frailty are also important issues to be addressed in the elderly population(Reference Verlaan, Ligthart-Melis and Wijers20). Therefore, understanding the factors (such as the prevalence of overweight, underweight and other anthropometric parameters) that may predict the quality of life and wellbeing among the elderly population has become increasingly important for dynamic ageing. Therefore, this study aimed to examine the trends in height, weight and BMI distribution during a 44-year interval of dietary transition among the Japanese elderly population, and to provide the annual variation in descriptive information on the total prevalence of underweight or overweight/obesity within this population as a measure of population wellbeing.
Methods
Data sources and Japan National Health and Nutrition Survey outlines
We used data from two cross-sectional annual surveys – the Japan National Nutrition Survey (J-NNS) and the Japan National Health and Nutrition Survey (J-NHNS) from 1973 to 2016 – with permission from the Ministry of Health, Labour and Welfare of Japan(Reference Ikeda, Takimoto and Imai21). J-NHNS was previously called J-NNS (1973–2002)(Reference Katanoda and Matsumura2). It is unique because height and weight measurements of the Japanese population have been conducted annually since 1946. After the US occupation of the Okinawa prefecture (a prefecture is equivalent to a province in Japan) ended in 1972, all forty-seven prefectures have participated since 1973. Occasionally, when huge natural disasters such as severe earthquakes occurred, the affected prefectures were exempt from participation.
Methodological details of J-NNS and J-NHNS are described elsewhere(Reference Katanoda and Matsumura2,Reference Ikeda, Takimoto and Imai21) . In brief, participants were household members aged ≥1 year living in the 300-unit blocks (approximately 5700 households; N 15 000) that were randomly extracted from the unit blocks of the Comprehensive Survey of Living Conditions of each year, stratified by prefecture and sampled according to the population size, except for 2012 and 2016, where expanded surveys were conducted. For these 2 years, ten-unit blocks consisting of 2010 census units were randomly sampled from each prefecture, except for the most densely populated Tokyo, where fifteen units were sampled. This tripled the sample size compared with the size of the usual survey year (approximately 23 750 households; N 61 000). In 2011, Iwate, Miyagi and Fukushima prefectures were excluded from the survey because of the Great East Japan Earthquake, and Kumamoto prefecture was excluded in 2016 because of the earthquake in April 2016 and Typhoon No. 10 in August 2016.
Sample size and anthropometric measurement
The present analyses were limited to individuals aged ≥65 years who had complete data on height and body weight measurements (N 94 508). More than 90 % of the participants’ height and body weight were measured by trained fieldworkers using standardised procedures. For the remaining participants (approximately 10 %), height and weight were measured either by other household members at home, or self-reported. Height (to the nearest 0·1 cm) and weight (to the nearest 0·1 kg) were measured while the participants were barefoot and wearing light clothes only. However, data regarding height and weight measurements (direct or by self-report) were available only after the 2012 survey.
BMI was calculated as weight (in kg) divided by height-squared (m2). Underweight was defined as BMI <18·5 kg/m2, and overweight/obesity as BMI ≥25·0 kg/m2 according to the WHO BMI cut-offs for Asian adults(Reference Tanaka, Imai and Nakade23). Extreme values of height, weight and BMI data were excluded (height <120 cm; weight <20 or >150 kg; BMI < 13 or >40 kg/m2; N 966). Finally, a total of 93 542 subjects, that is, 40 503 men and 53 039 women, were included in the analysis.
Age standardisation
As the distribution of age differed across surveys, height, weight, BMI and the prevalence of underweight and overweight/obesity were adjusted to the 2010 Population Census using five age groups, namely 65–69, 70–74, 75–79, 80–84 and ≥85 years, and anthropometric measurements using the direct method. The 2010 census survey was chosen because it was the last census survey conducted before the Great East Japan Earthquake in 2011.
Statistical analysis
Sex-specific and age-adjusted mean height, weight and BMI and the prevalence of overweight/obesity and underweight were calculated for each year. For the expanded 2012 and 2016 J-NHNS data (with three times the sample size of a usual survey), weighing was performed to correct the differences in the number of households in each prefecture. Weight for the number of households in each prefecture was calculated by dividing the total number of households during the previous 3 years in each prefecture by that of 2012 and 2016 (e.g. total number of households in each prefecture in 2009–2011/number of households in each prefecture in 2012)(24). Prefecture-specific weight values are shown in the online Supplemental Table S1.
Trend analyses were performed using the Joinpoint Regression Program (version 4.2; National Cancer Institute, USA; http://www.surveillance.cancer.gov/joinpoint). Joinpoint regression analysis (also known as piecewise linear regression) uses the statistical criteria to determine the minimum number of linear segments needed to describe a trend and determine the annual percentage change (APC) for each segment. The response variable for the analysis was the natural logarithm of the age-standardised mean height, weight, BMI, the prevalence of overweight/obesity and underweight; the independent variable was surveys from 1973 to 2016 stratified by sex. The range of the number of joinpoints to be tested was set between 0 and 4, and the optimal number for the joinpoint model was selected using the Monte Carlo permutation method, which tests whether a change in the trend is statistically significant(25).
Next, participants’ birth years were grouped by decade, leading to six birth year groups: ≤1899, 1900–1909, 1910–1919, 1920–1929, 1930–1939 and ≥1940. The first birth year group (≤1899) contained only participants aged 70–79 and >80 years; the second (1900–1909), third (1910–1919), fourth (1920–1929) and fifth (1930–1939) groups included all three age groups (65–69, 70–79 and >80 years); and the last birth year group (≥1940) included data only for those aged 65–69 and 70–79 years. Trend analyses were performed for height, weight, BMI and the prevalence of overweight/obesity and underweight in each age group (65–69, 70–79 and >80 years) according to birth year group. Trends according to birth year were analysed using the general linear model and the Cochran-Armitage trend test. Statistical analyses were performed using the SAS statistical software, version 9.4 (SAS Institute Inc.). All reported P values were two-tailed, with a P value <0·05 considered statistically significant.
Results
General characteristics of participants
Table 1 describes the general characteristics of the 93 542 study participants and the mean age, height, weight, BMI and the prevalence of overweight/obesity and underweight in 40 503 (43·3 %) men and 53 039 (56·7 %) women. The mean ages were 72·9 and 73·4 years in men and women, respectively. The prevalence of overweight/obesity was 22·5 and 26·8 % in men and women, respectively, and the prevalence of underweight was 8·6 and 9·7 % in men and women, respectively. Furthermore, the mean age of the participants increased significantly among both men and women (P < 0·001) according to the survey year. The mean age was 72·0 and 71·8 years for men and women in 1973, and 73·9 and 74·5 years in 2016, respectively (online Supplemental Table S2).
Table 1 General characteristics of elderly Japanese participants from the 1973–2016 Japan National Health and Nutrition Survey

* Mean values of height, weight and BMI are shown.
Trends in average BMI, height and weight
The trends in average BMI, height and weight adjusted for age groups are shown in Fig. 1. Joinpoint regression analysis showed a significant increase in age-standardised average height and weight of both men and women from 1973 to 2016 (Fig. 1a and b). From 1973 to 2016, the average height among the elderly Japanese increased by 0·1 % per year in both men and women (Fig. 1a). The trend in age-standardised average weight increased over time from 1973 to 2016 with an APC of 0·5 % in men. The average weight in women showed a significant annual increase of 0·4 % from 1973 to 2002, followed by 0·1 % from 2002 to 2016 (Fig. 1b). Joinpoint regression analyses identified a change in the trend for average BMI in 2007 among men with a significant increase in APC of 0·3 % from 1973 to 2007, and 0·1 % from 2007 to 2016. For women, APC was 0·2 % from 1973 to 2002, and a significant decrease in APC of 0·1 % was subsequently observed (Fig. 1c, online Supplemental Table S3).

Fig. 1 Trends in mean height (a), mean weight (b) and mean BMI (c) for men and women aged ≥65 years from 1973 to 2016 Japan National Health and Nutrition Survey. ![]() , men observed value;
, men observed value; ![]() , men modelled value;
, men modelled value; ![]() , women observed value;
, women observed value; ![]() , women modelled value
, women modelled value
Trends in the prevalence of overweight/obesity and underweight
The trends in the prevalence of overweight/obesity increased over time from 1973 to 2016, with an APC of 2·2 % in men. In contrast, a significant change in trends was identified in 2002 in women, with an increase in APC of 1·0 % from 1973 to 2002, and thereafter, a significant reverse trend with an APC of –1·5 % was observed in women. The prevalence of underweight showed a significant decreasing trend, with an APC of 3·2 % from 1973 to 2016 in men, while a significant decreasing trend with an APC of 1·9 % from 1973 to 2003, followed by a gradual increase in APC of 0·9 % (non-significant) from 2003 to 2016, in women (Fig. 2).
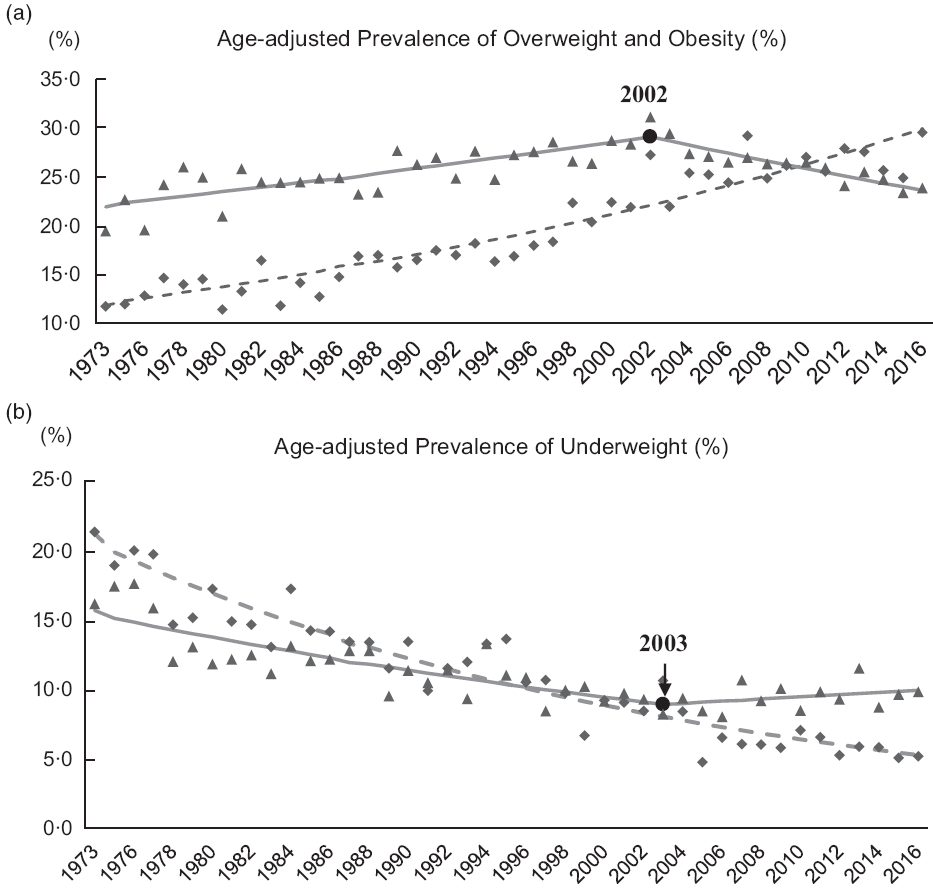
Fig. 2 Trends in age-adjusted prevalence of overweight/obesity (a) and underweight (b) for men and women aged ≥65 years from 1973 to 2016 Japan National Health and Nutrition Survey. ![]() , men observed value;
, men observed value; ![]() , men modelled value;
, men modelled value; ![]() , women observed value;
, women observed value; ![]() , women modelled value
, women modelled value
Trends according to the birth year
Figures 3 and 4 show the mean height, weight, BMI and the prevalence of overweight/obesity and underweight in men and women according to the birth year group for each age group (65–69, 70–79 and ≥80 years). A significant increasing trend in mean height, weight, BMI and the prevalence of overweight/obesity while a significant decreasing trend in the prevalence of underweight was observed across birth year groups in men of all age groups (P for trend <0·001). For women, a significant increase in mean height and weight was observed (P for trend <0·001) from the first (≤1899) to the last (≥1940) birth year groups across all age groups, except for women aged 65–69 years, and no difference in mean weight was observed for the last two birth year groups (1930–1939 and ≥1940). Women in the >80 years age group showed an increase in mean BMI and the prevalence of overweight/obesity and a decreasing trend in the prevalence of underweight in all birth year groups from ≤1899 to 1930–1939. For women aged 65–69 and 70–79 years, an increased mean BMI, an increased prevalence of overweight/obesity, and a decreased prevalence of underweight were only observed in participants born before 1940. A sudden decrease in mean BMI and the prevalence of overweight/obesity and an increase in the prevalence of underweight were observed in women, aged 65–69 and 70–79 years, born after 1940 (Figs 3 and 4).
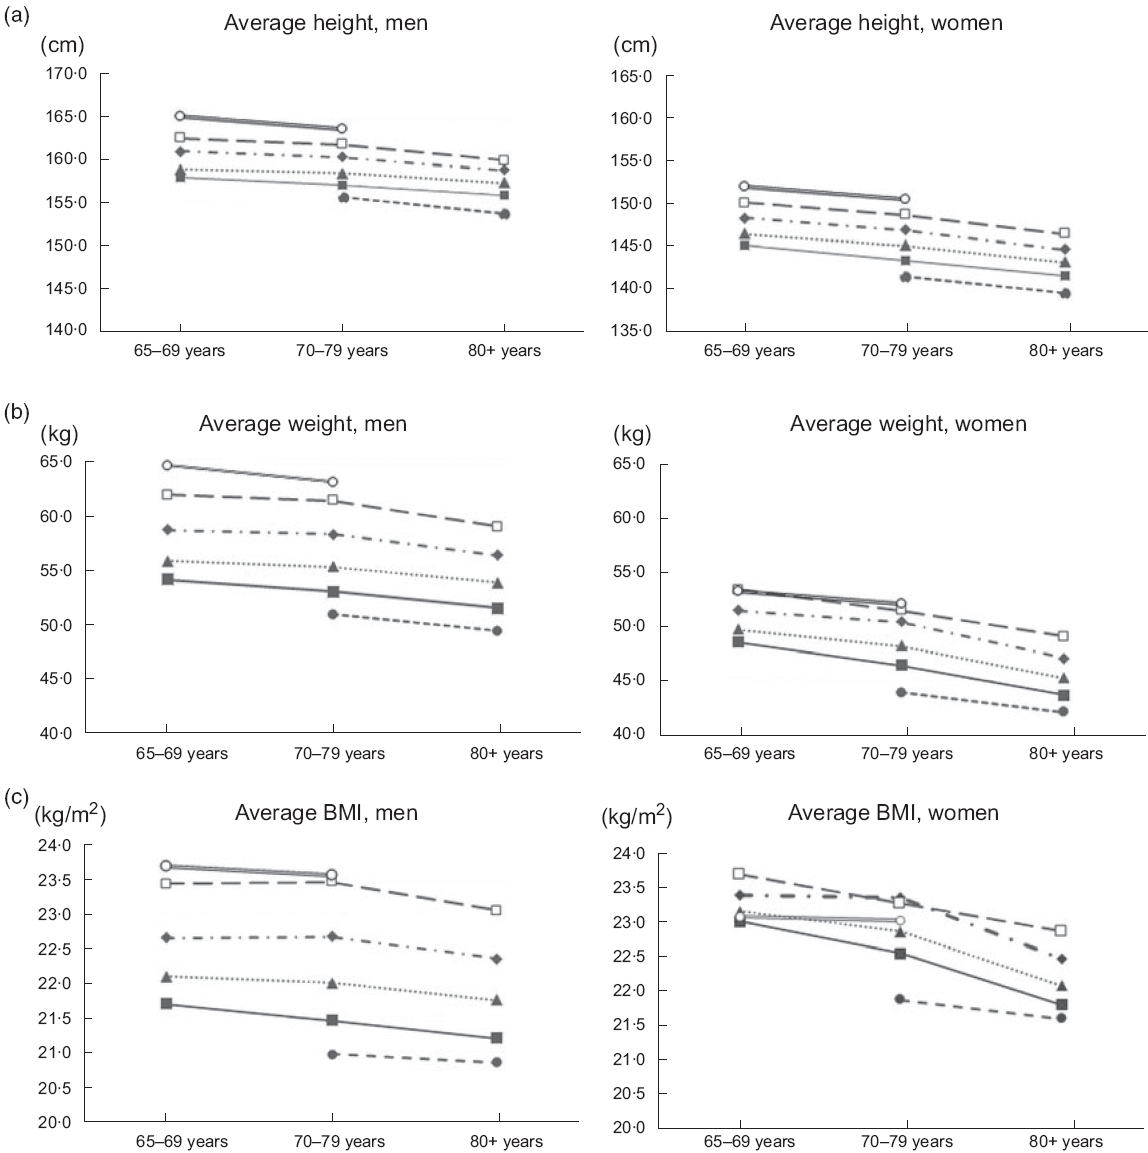
Fig. 3 Age-specific trends in mean height (a), weight (b) and BMI (c) by birth year group. ![]() , ≤1899;
, ≤1899; ![]() , 1900–1909;
, 1900–1909; ![]() , 1910–1919;
, 1910–1919; ![]() , 1920–1929;
, 1920–1929; ![]() , 1930–1939;
, 1930–1939; ![]() , ≥1940
, ≥1940

Fig. 4 Age-specific trends in overweight/obesity (a) and underweight (b) by birth year group. ![]() , ≤1899;
, ≤1899; ![]() , 1900–1909;
, 1900–1909; ![]() , 1910–1919;
, 1910–1919; ![]() , 1920–1929;
, 1920–1929; ![]() , 1930–1939;
, 1930–1939; ![]() , ≥1940
, ≥1940
Discussion
This current study describes the secular trends in age-standardised mean height and weight, mean BMI and the prevalence of overweight/obesity and underweight in the elderly Japanese population (age ≥65 years) during the past 44 years based on the data from the 1973–2016 J-NNS and J-NHNS. Average height and weight increased over the four decades in both men and women. The prevalence of overweight/obesity dramatically increased and nearly tripled in men, accompanied by a significant decrease in the prevalence of underweight. However, in women, we found that the increasing trend in average BMI and the prevalence of overweight/obesity reached a peak in 2002 and showed a decreasing trend thereafter, whereas the downward trend in the prevalence of underweight showed a gradual increase in women since 2003. This discrepant trend in the prevalence of overweight/obesity and underweight among the Japanese women may be a unique feature that has not been observed in western and other populations. A previous study also reported that in the elderly population, ‘anorexia of ageing’ is more obvious in women, possibly resulting in poor nutritional status and lower BMI(Reference Kim, Fay and Feuer26).
A higher prevalence of thinness among the young Japanese women has been previously reported(Reference Takimoto, Yoshiike and Kaneda6–Reference Sugawara, Saito and Sato9); however, in this study, the elderly women also showed a decrease in mean BMI after 2002, and an increase in the prevalence of underweight after 2003. One of the possible factors associated with this observation may be the increased awareness and consciousness of body image and body weight control accompanied by the announcement of the National Health Promotion Movement in the 21st century, Health Japan 21 (2000) and the enactment of the Health Promotion Law (2003)(Reference Otsuka, Kato and Nishita27).
Human height has steadily increased over the past two centuries(14). Trends of height increase in the elderly Japanese population may be because of improvements in health and nutrition in the second half of the 20th century(28). A dramatic secular increase in the height of Japanese citizens since World War II has been suggested because of dietary transitions towards a modern western dietary pattern during the post-war period(Reference Matsumoto29). Westernisation of the Japanese diet may also be associated with increased BMI and prevalence of obesity(Reference Takahashi30).
In men, a significant joinpoint change in mean BMI was identified in 2007, and the rate of increment in BMI slowed down after 2007. This may be because of the introduction of the new screening and interventional programme for metabolic syndrome in middle-aged adults, called ‘Specific Medical Check-ups and Specific Health Guidance’ in 2008(Reference Yoneda, Ohno and Oki31,32) .
The analyses of trends according to the birth year showed that recently born participants were taller and heavier across all age groups of both genders. However, a sudden decrease in BMI and the prevalence of overweight/obesity and a sudden increase in the prevalence of underweight were found among the most recently born women (≥1940) in the 65–69 and 70–79 years age groups. These findings are thought to be associated with the restriction of food supply during World War II; children born during this period experienced food shortages during both their childhood and early adult life(Reference Tsushita, Hosler and Miura33). Some studies suggest that nutritional status in early life could affect body composition and the susceptibility to either obesity or thinness in later stages of life(34,Reference William, Li and Kuh35) .
The current study is the first to report changes in the trends of anthropometric measurements over a 44-year period by birth year in the elderly population in terms of population averages. A strength of the present study is that >90 % of participants’ height and body weight were measured by trained fieldworkers using standardised procedures, rather than being self-reported. However, the study also had some limitations. When interpreting the trends of increase or decrease in height, weight, BMI and the prevalence of overweight/obesity or underweight, it is important to consider epidemiological factors that affect these trend changes, such as dietary habits, nutritional status, physical activity or exercise habits. Therefore, secular trends in mean BMI and the prevalence of overweight/obesity and underweight in the elderly population should be closely monitored in parallel with the effect of dietary changes, energy intake and physical activity (step counts). Moreover, it is well known that body composition changes with ageing(Reference Rolland-Cachera, Akrout and Péneau36,Reference Kyle, Genton and Hans37) , and for the elderly, their physical wellbeing depends on their physical activity levels(Reference Short, Vittone and Bigelow38). Moreover, BMI does not reflect the amount or location of body fat mass(Reference JafariNasabian, Inglis and Reilly39), thus failing to identify the loss of fat-free mass (such as skeletal muscle mass) with ageing(Reference Kyle, Genton and Hans37,Reference Kwon, Kim and Kim40) . Finally, although >90 % of participants’ height and weight were measured by trained fieldworkers, approximately 10 % of participants’ height and weight were self-reported. Previous studies have suggested that the discrepancy between self-reported and measured height and weight rises with age, and underestimation of excess weight by self-reported values has also been reported in older adults(Reference Jackson, Janssen and Sui41,Reference Kuczmarski, Kuczmarski and Najjar42) .
In summary, this current study demonstrated positive secular increases in height, weight and BMI among the elderly Japanese (aged ≥65 years) for the period from 1973 to 2016. However, particular attention should be paid to a rapid increase in the prevalence of obesity among elderly Japanese men. Comprehensive intervention strategies should include periodical monitoring, education on healthy dietary behaviour, physical exercises and appropriate body weight control in elderly women. Further studies are needed to determine the underlying background of the changes in the trends of these anthropometric parameters in the elderly Japanese population.
Acknowledgements
Acknowledgements: None. Financial support: This study was supported by the Health Japan 21 (the second term) Analysis and Assessment Project of the Ministry of Health, Labour and Welfare, Japan. The Ministry of Health, Labour and Welfare had no role in the design, analysis or writing of this article. Conflict of interest: The authors have no conflicts of interest to declare. Authorship: H.T. substantially contributed to the conception and design, and the acquisition of data. H.T. and I.T. contributed to the analysis and interpretation of data, and I.T. drafted the manuscript. E.O., C.O. and A.S. took part in the interpretation of data and provided critical revisions of the manuscript for important intellectual content. H.T. made a final revision and approval of the manuscript. All authors read and approved the final manuscript. Ethics statement: We obtained consent for the secondary use of 1973–2016 NHNS data from the Ministry of Health, Labour and Welfare. This study was approved by the institutional review board of the National Institute of Health and Nutrition.
Supplementary material
For supplementary material accompanying this article visit https://doi.org/10.1017/S1368980019004828


