


The increased prevalence of obesity worldwide has contributed to a higher risk for cardiovascular and metabolic diseases, premature mortality and a health-related financial burden(1). Nutritional strategies have been implemented to combat obesity and its complications(Reference Yannakoulia, Poulimeneas and Mamalaki2). In recent years, intermittent fasting has emerged as an alternative to traditional dietary approaches(Reference Patterson and Sears3), with beneficial effects observed for body weight and metabolic parameters(Reference Longo and Mattson4).
Time-restricted eating (TRE) is a type of intermittent fasting that reduces the daily eating window (∼4 to 12 h) and extends the daily fasting period(Reference Di Francesco, Di Germanio and Bernier5). TRE is unique from other forms of intermittent fasting in that it requires a consistent time of the daily eating window. Additionally, TRE became popular for being able to promote health benefits with no need to count energies(Reference Di Francesco, Di Germanio and Bernier5). This approach, which aligns eating with the active biological phase, improves health outcomes in rodents – regardless of energy restriction, weight loss or diet quality(Reference Hatori, Vollmers and Zarrinpar6,Reference Chaix, Zarrinpar and Miu7) . In humans, under ad libitum conditions, TRE often produces unintentional reductions in energy intake, resulting in body weight loss and cardiometabolic benefits such as increased insulin sensitivity and decreased blood pressure(Reference Cienfuegos, Gabel and Kalam8–Reference Gabel and Varady11). Therefore, it is unclear whether the positive effects observed in humans occur due to caloric restriction (CR), even if unintentional, by fasting alone, or from a combination of both factors(Reference Queiroz, Macedo and Tinsley12). There is evidence that TRE promotes cardiometabolic improvements regardless of CR and weight loss(Reference Sutton, Beyl and Early13,Reference Wilkinson, Manoogian and Zadourian14) ; however, studies suggest that CR, but not TRE or other intermittent fasting types alone, provides the benefits often reported(Reference Trepanowski, Kroeger and Barnosky15–Reference Pureza, da Silva Junior and Praxedes17).
A subtype of TRE, known as early time-restricted eating (eTRE), limits food intake to the early hours of the day, in order to align eating with the human body’s circadian rhythms(Reference Sutton, Beyl and Early13). The circadian system controls metabolism in a cycle of approximately 24 h, orchestrating numerous metabolic events(Reference Reinke and Asher18). Several metabolic processes function optimally in the first half of the day, including insulin sensitivity, glucose tolerance and the thermic effect of food(Reference Poggiogalle, Jamshed and Peterson19). Although the individual circadian preference (chronotype) should be considered when defining dietary patterns as early or late(Reference Galindo Muñoz, Gómez Gallego and Díaz Soler20), there is a growing body of evidence showing that food intake out of synchrony with body’s circadian rhythms (e.g. delayed and prolonged eating schedule) can be inappropriate and promote negative impacts on health, including increased obesity risk and cardiometabolic impairments(Reference Garaulet, Gómez-Abellán and Alburquerque-Béjar21,Reference Jakubowicz, Barnea and Wainstein22) .
As typically implemented, delayed commencement of eating could mitigate beneficial effects of TRE on metabolic health(Reference Heilbronn and Regmi23). Nevertheless, only one study has directly compared eTRE v. delayed time-restricted eating (dTRE), with similar findings between protocols(Reference Hutchison, Regmi and Manoogian24). However, this study was performed exclusively in men and each TRE condition lasted only seven days(Reference Hutchison, Regmi and Manoogian24). The present study compared the chronic effects of eTRE, dTRE and traditional diet (control/active comparator) protocols, both with CR, on body weight, body composition and cardiometabolic risk factors in adults with overweight and obesity. We chose to prescribe a similar energetic deficit to all groups to assess the effects of these dietary interventions under isoenergetic conditions. We hypothesised that the greatest health improvements would be observed with eTRE, particularly for glucose metabolism, with dTRE also demonstrating some benefit relative to CR alone.
Methods
Ethical approval
This study was approved by the Research Ethics Committee (nº 3·525·665) of the Federal University of Rio Grande do Sul, conducted following the Declaration of Helsinki, reported following the Consolidated Standards of Reporting Trials(Reference Moher, Hopewell and Schulz25) and registered at clinicaltrials.gov as NCT04647149. Recruitment was continuous by social media and flyers placed around the university, and the first participant signed the consent form on 3 September 2019.
Study design and participants
The study was a single-centre, parallel-group, 8-week randomised trial, performed between September 2019 and May 2020 at the Federal University of Rio Grande do Sul, Brazil. Due to the Coronavirus Disease 2019 pandemic, recruitment of new participants was suspended on 18th March 2020. Participants met the following inclusion criteria: adults between 20 and 40 years, BMI between 25·0 and 34·9 kg/m2 and not engaging in any structured exercise programme during the past three months. Participants were free of CVD, type 1 or 2 diabetes mellitus, hypertension and dyslipidaemia. Current cigarette smoking, use of supplements or medications that could affect the main outcomes of the study, unstable weight for three months before the beginning of the study (defined as ≥ 5 % weight loss or gain), regular alcohol consumption (2 servings/day for males and 1 serving/d for females) and regular fasting (> 16 h per day) were also exclusion criteria for the present study. Moreover, individuals with night eating syndrome, night shift workers and pregnant, lactating or menopausal women, as well as those with fasting plasma glucose and TAG levels > 126 mg/dl and > 150 mg/dl, respectively, were excluded from participation. Over 600 people expressed interest in the study. Thus, pre-screening through a cell phone interview was performed. Based on this pre-screening, eligible participants were scheduled for a screening visit at the laboratory in the morning after overnight fasting. At this visit, participants provided oral and written informed consent to the principal researcher. After an admission interview, evaluations of height and body weight to calculate BMI, resting metabolic rate to calculate energy intake and resting blood pressure occurred. Additionally, a blood collection was conducted to assess fasting plasma glucose and TAG levels.
Eligible participants who provided consent were scheduled for a laboratory visit within two weeks of the initial screening visit. Participants arrived at the laboratory between 06.30 and 08.00 after overnight fasting. First, body weight, resting metabolic rate, respiratory exchange ratio and body composition were measured. After these assessments, a fasting capillary and venous blood collection and a 2-hour oral glucose tolerance test (2-h OGTT) were performed. Subsequently, participants consumed a standard meal. After 30 min, they performed a maximum effort cycle ergometer test. During this visit, physical activity levels (PAL), chronotype, risk of binge eating, appetite parameters and sleep pattern of the participants were assessed. All assessments were performed before and after the 8-week intervention period (Fig. 1(a)). Participants were instructed to maintain their usual PAL throughout the trial. After the first month of study, participants returned to the laboratory for a nutritional consultation. At this visit, recommendations for a healthy diet (e.g. portion size control, increasing consumption of fruits and vegetables and decreasing consumption of ultraprocessed foods and added sugars) were provided, and body weight was also measured. In addition, the importance of sending photos of meals and adherence to the diet plan/eating window plan was reinforced in order to increase engagement with the proposed activities.

Fig. 1. Study protocol. (a) Experimental design: Assessments performed at screening after signing the consent form: body weight, height, BMI, resting metabolic rate, blood pressure and initial blood collection. Assessments performed before and after 8 weeks: body weight, resting metabolic rate, body composition, collection of venous and capillary blood, 2-h oral glucose tolerance test, questionnaires and maximal effort test. b) Dietary interventions. The eTRE and dTRE groups consumed their three daily meals, respectively, between 08.00 and 16.00 and between 12.00 and 20.00, totaling 16 h of fasting per 24-h period. White, eTRE; light grey, dTRE and dark grey, control. TRE, time-restricted eating.
Randomisation
Participants were randomised in a 1:1:1 ratio to eTRE group, dTRE group or CR group. Randomisation was performed by an independent researcher using an automatic randomiser (https://www.randomizer.org/) and was stratified by sex and BMI (25·0–29·9 and 30·0–34·9 kg/m²). Allocations were concealed until pre-intervention measures were complete. The study staff assisting with data collection remained blinded regarding the allocation of participants. However, due to the nature of the study, the principal researcher and the participants were not blinded during the intervention.
Dietary interventions
Participants were prescribed a diet plan to promote weight loss, but no food was provided to them. Energy intake was calculated based on each individual resting metabolic rate multiplied by the PAL of 1·4, minus 25 % of the daily energy requirements. Diets were formulated to contain 50 % energy as carbohydrate, 20 % as protein and 30 % as fat. Participants were instructed to divide their daily energy intake between three meals each day, and snacks between meals were not allowed. Outside of the eating window, water and nonenergetic and unsweetened beverages, such as coffee, tea, yerba mate (Ilex paraguariensis), sparkling or still water, were allowed as a tool to increase compliance. Beverages with artificial sweeteners were not allowed during this period. Daily, the participants sent photos to the nutritionist researcher, through a smartphone messenger app, of the three meals immediately before consuming them. When participants did not send photos and the deadline for this had passed, they were asked to inform the nutritionist researcher of the time and content of the meals as soon as possible. Participants were strongly encouraged to eat only the meals prescribed by the nutritionist and to eat at the times indicated. A similar energy deficit and three meals per day eating frequency were prescribed for all groups to allow for a more direct comparison. The eTRE group was instructed to eat from 08.00 until 16.00 (8-h window), while the dTRE group was instructed to eat from 12.00 until 20.00 (8-h window), and the CR group was instructed to eat from 08.00 until 20.00 (12-h window) (Fig. 1(b)). The eating schedules were modestly customised by allowing each participant to advance or delay the intake of the first meal by a maximum of one hour. Nevertheless, the time of the last meal was adjusted according to the time of the first meal. For example, if the first meal was eaten at 07.00, the last meal would be at 15.00 in the eTRE group and at 19.00 in the CR group. To increase adherence, participants could change the timing of their eating window by one hour each day, rather than adopting an identical schedule each day. On the day before the final assessment, individuals in the eTRE group were instructed to consume the last meal at ∼20.00 to standardise the length of the fast relative to the other groups. Thus, all participants were assessed after the same duration of fasting.
Assessment of dietary compliance
After the interventions, food compliance was verified in two ways. Participants were considered adherent when their energy intake, determined via two 3-d food records (collected after 4 and 8 weeks of the intervention), was between 80 % and 110 % of their prescribed daily energy goal. Another 3-d food record was collected pre-intervention simply to describe the usual diet of the participants. The adherence to the eating window was analysed by the time of sending photos of meals. Participants who sent > 70 % of the photos of the meals during the 56 d (8 weeks) were considered adherent to sending photos. Of these, those who completed the eating window at the correct time were considered totally adherent (see ‘Dietary Interventions’ section above). The eating window was defined as the mean difference between the last and the first meal throughout all study. Non-adherent participants were not excluded from the main analyses (i.e. the per protocol analyses). The diet of the participants and their food records were evaluated using the nutritional software Dietwin Plus® version 3090.
Outcome measures
Body weight and body composition
Body weight was measured via digital scale with the participants fasted and wearing light clothes. Body composition was estimated by dual-energy x-ray absorptiometry (Lunar Prodigy Primo, GE Healthcare), software enCORE version 14.1. Participants were instructed to empty their bladder and to remove any metal accessories before this assessment. They were positioned in dorsal decubitus (supine), aligned and centred on the scanning table with hips and shoulders extended and hands in a neutral position. Participants were evaluated pre-and post-intervention at the same time of day and in the same nutritional state (fasted) at each assessment. The equipment was calibrated before evaluations according to the manufacturers’ specifications. Total mass, fat-free mass, fat mass, % fat and bone mineral content of the whole body, trunk, arms and legs were analysed. The same evaluator conducted all assessments.
Resting metabolic rate and respiratory exchange ratio
Resting metabolic rate and respiratory exchange ratio were assessed in an open-circuit calorimeter (Quark RMR, Cosmed) calibrated at the beginning of the day, using the canopy dilution technique. Resting metabolic rate assessments were performed between 06.30 and 08.30 in a room with controlled temperature, sound and light. Participants were positioned in a supine position for approximately 30 min, and the first 10 min of gas collection were excluded from the analysis. Thus, mean VO2 and VCO2 (l/min) values obtained during the final 20 min were used to calculate resting metabolic rate for a 24-h period, according to the Weir equation(Reference Weir26) The respiratory exchange ratio was determined by VCO2/VO2. Participants were instructed to avoid moderate-to-high intensity physical activities and not consume alcohol, caffeine or yerba mate (Ilex paraguariensis) during the 24 h preceding the test. They could intake only water ad libitum. Also, participants were instructed to sleep for at least eight hours and to fast for 11 h prior to assessments. Finally, participants were instructed to be transported to the laboratory in a motorised vehicle, if possible.
Biochemical measures
Blood samples were obtained following a 12-h overnight fast to analyse the levels of total cholesterol, LDL-cholesterol, HDL-cholesterol, non-HDL-cholesterol, TAG, glucose and insulin. The blood collection was conducted by the same experienced researchers. Blood (∼10 ml) was collected in EDTA vacuum tubes and centrifuged for 10 min at 1000 g and 4°C. Plasma was immediately stored at −80°C for later analyses. All blood samples were analysed in singlicate. Glucose, total cholesterol, HDL-cholesterol and TAG were measured by colorimetric method on an automatic analyser (Cobas C111, Roche). LDL-cholesterol was determined using the Friedewald equation(Reference Friedewald, Levy and Fredrickson27). Non-HDL-cholesterol was calculated as total cholesterol minus HDL-cholesterol(Reference Mach, Baigent and Catapano28). Capillary blood β-hydroxybutyrate levels were analysed in fasting using a ketone monitor (FreeStyle Optium, Abbot). Insulin levels were assayed using an enzyme-linked immunosorbent assay kit (DRG International, Inc.) according to the manufacturers’ instructions. The insulin resistance index was calculated by homeostasis model assessment of insulin resistance(Reference Matthews, Hosker and Rudenski29) and insulin sensitivity index by quantitative insulin sensitivity check index(Reference Katz, Nambi and Mather30). The β-cells functional capacity was assessed by homeostasis model assessment of β-cells functional capacity(Reference Matthews, Hosker and Rudenski29). 2-h OGTT was performed after fasting blood collection. For the test, participants consumed 75 g loads of dextrose (Max Titanium®) diluted in 300 ml of water within 5 min. Then, blood (∼5 ml) was subsequently collected at 30, 60, 90 and 120 min. Plasma glucose levels were analysed at all points, while insulin levels were measured only at the fasting and 120-minute timepoints. The Matsuda Index was calculated by using glucose and insulin concentrations at times 0 and 120 min from 2-h OGTT(Reference DeFronzo and Matsuda31,Reference Matsuda and Defronzo32) .
Subjective appetite, binge eating risk, sleep quality and chronotype
Participants rated their appetite levels, based on how they were currently feeling, across four dimensions (hunger, satiety, desire to eat and capacity to eat) using an adapted Visual Analog Scale(Reference Flint, Raben and Blundell33). The scale range is 0–100 mm, and each end represents the extremes. The scale was administered before the standard meal pre- and post-8 weeks. Binge eating risk was analysed by the Binge Eating Scale, a sixteen-item self-report questionnaire. Participants’ scores can range from 0 to 46, with higher scores indicating more severe binge eating problems(Reference Gormally, Black and Daston34). The Pittsburgh Sleep Quality Index(Reference Buysse, Reynolds and Monk35) was used to analyse the sleep quality through nineteen self-rated questions about seven sleep components. The score can range from 0 to 3 for each component, with a maximum score of twenty-one points. Scores above five points indicate poor quality of sleep. The Morningness-Eveningness Questionnaire was used only at the beginning of the study to determine the chronotype of participants. The score on this questionnaire can range from 16 to 86, with a higher score indicating a stronger morningness p(Reference Horne and Ostberg36). Except for the Binge Eating Scale, which was completed in the laboratory, the other questionnaires were answered online using a Google Forms link.
Maximum effort exercise test
The maximum effort exercise test was conducted on a cycle ergometer (Ergo-fit Cycle 167 med). During the test, respiratory gas analysis was performed breath-by-breath using an open-circuit spirometry system (Quark CPET, Cosmed). The test started with a warm-up, which consisted of cycling for 3 min at 20 W, followed by increments of 20 W every 1 min until exhaustion. During the test, pedaling cadence was required to be at least sixty revolutions per minute. Following completion of the test, there was a recovery period of 3 min at 20 W. Heart rate was measured continuously using chest belt telemetry (Polar Electro Oy), and the volunteers were verbally encouraged to perform maximum effort during the test. The following criteria were adopted to indicate exhaustion, with two or more items required to end the exercise test: volitional fatigue, respiratory exchange ratio ≥ 1·15, heart rate ≥ 95 % of age-predicted maximum heart rate (220−age), pedaling cadence < 60 revolutions per minute or tendency for a plateau in the oxygen consumption with increasing load. The peak oxygen consumption value was considered the highest oxygen consumption value attained during the final test(Reference Howley, Bassett and Welch37).
Physical activity levels
Participants’ PAL were evaluated in two ways. The International Physical Activity Questionnaire-Short Form(Reference Lee, Macfarlane and Lam38) was completed four times during the study (pre-intervention and after one, four and eight weeks). The International Physical Activity Questionnaire-Short Form questionnaire was completed online through a Google Forms link sent to the participants. Data were analysed as metabolic equivalent of task/min/week. Additionally, participants installed the Google Fit app to measure their PAL. At the end of the first, fourth and eighth week of study, participants reported their ‘move minutes per week’ provided by the app.
Power and sample size
The sample size calculation of the present study was performed using the F-test and the statistical test ‘ANOVA: repeated measures, within–between interaction’ in software statistical G × Power version 3·1·9. Fasting insulin was specified as the primary outcome and was used for the power analysis. Other outcomes were considered secondary. For the calculation, we used data of fasting insulin from a pilot study that investigated the chronic effects of the TRE approach in adults with obesity(Reference Gabel, Hoddy and Haggerty39), resulting in the effect size (f Cohen) of 0·31. However, we chose to adopt a smaller effect size (f Cohen of 0·25) based on the expectation of finding possible differences between the active TRE groups. For our primary outcome, we calculated that a total sample size of fifty participants would provide a power (β) of 80 % and a significance level (α) of 0·05, allowing an attrition rate of 20 %.
Statistical analysis
Data were analysed by a Generalised Estimating Equations model using main effects (group and time) and interaction (group × time). Generalised Estimating Equations were used instead of repeated measures-ANOVA due to dropouts and missing data that precluded the use of the repeated measures-ANOVA as was planned. Normality tests were not used since the Generalised Estimating Equations model enables the variables do not present a normal distribution(Reference Liang and Zeger40). Analyses were performed using available data from all participants who were randomly assigned (intention-to-treat) and for those who completed the study and had all data available (per protocol). Generalised Estimating Equations can handle missing values within the model; therefore, no data imputation was performed for the intention-to-treat analysis. Results are reported by per-protocol analysis unless indicated otherwise. Baseline values of the variables were not added as a covariate in the statistical analysis. Group and time were included in the model as fixed effects and time as a repeated measure. An unstructured working correlation matrix was employed based on the Quasi-likelihood under Independence Model Criterion values. For conservative purposes, pairwise comparisons between eighth week and baseline within each group and comparisons between groups at each point were only made if the P value for the interaction between group × time was < .05, using Least Significant Difference test. All data are presented as mean (95 % CI) unless otherwise indicated. Statistical analyses were performed in IBM SPSS version 18, and P < 0·05 was considered statistically significant.
Results
Participant characteristics and attrition
Seventy-four participants were screened and attended the first laboratory visit, with thirty-seven completing the study (Fig. 2). Dropout was higher in dTRE (31 %; 5 of 16) compared with eTRE and CR (19 %; 3 of 16 for both). However, only eTRE dropouts were due to the eating window, based on self-report (Fig. 2). Participants were primarily women (84 %) with grade I obesity (mean age 30 ± 6 years, BMI 30·5 ± 2·7 kg/m2) (Table 1). All results are presented in Table 2 (per-protocol) and Supplementary Table 1 (intention-to-treat). Results presented in text refer to the per-protocol analysis unless otherwise stated.
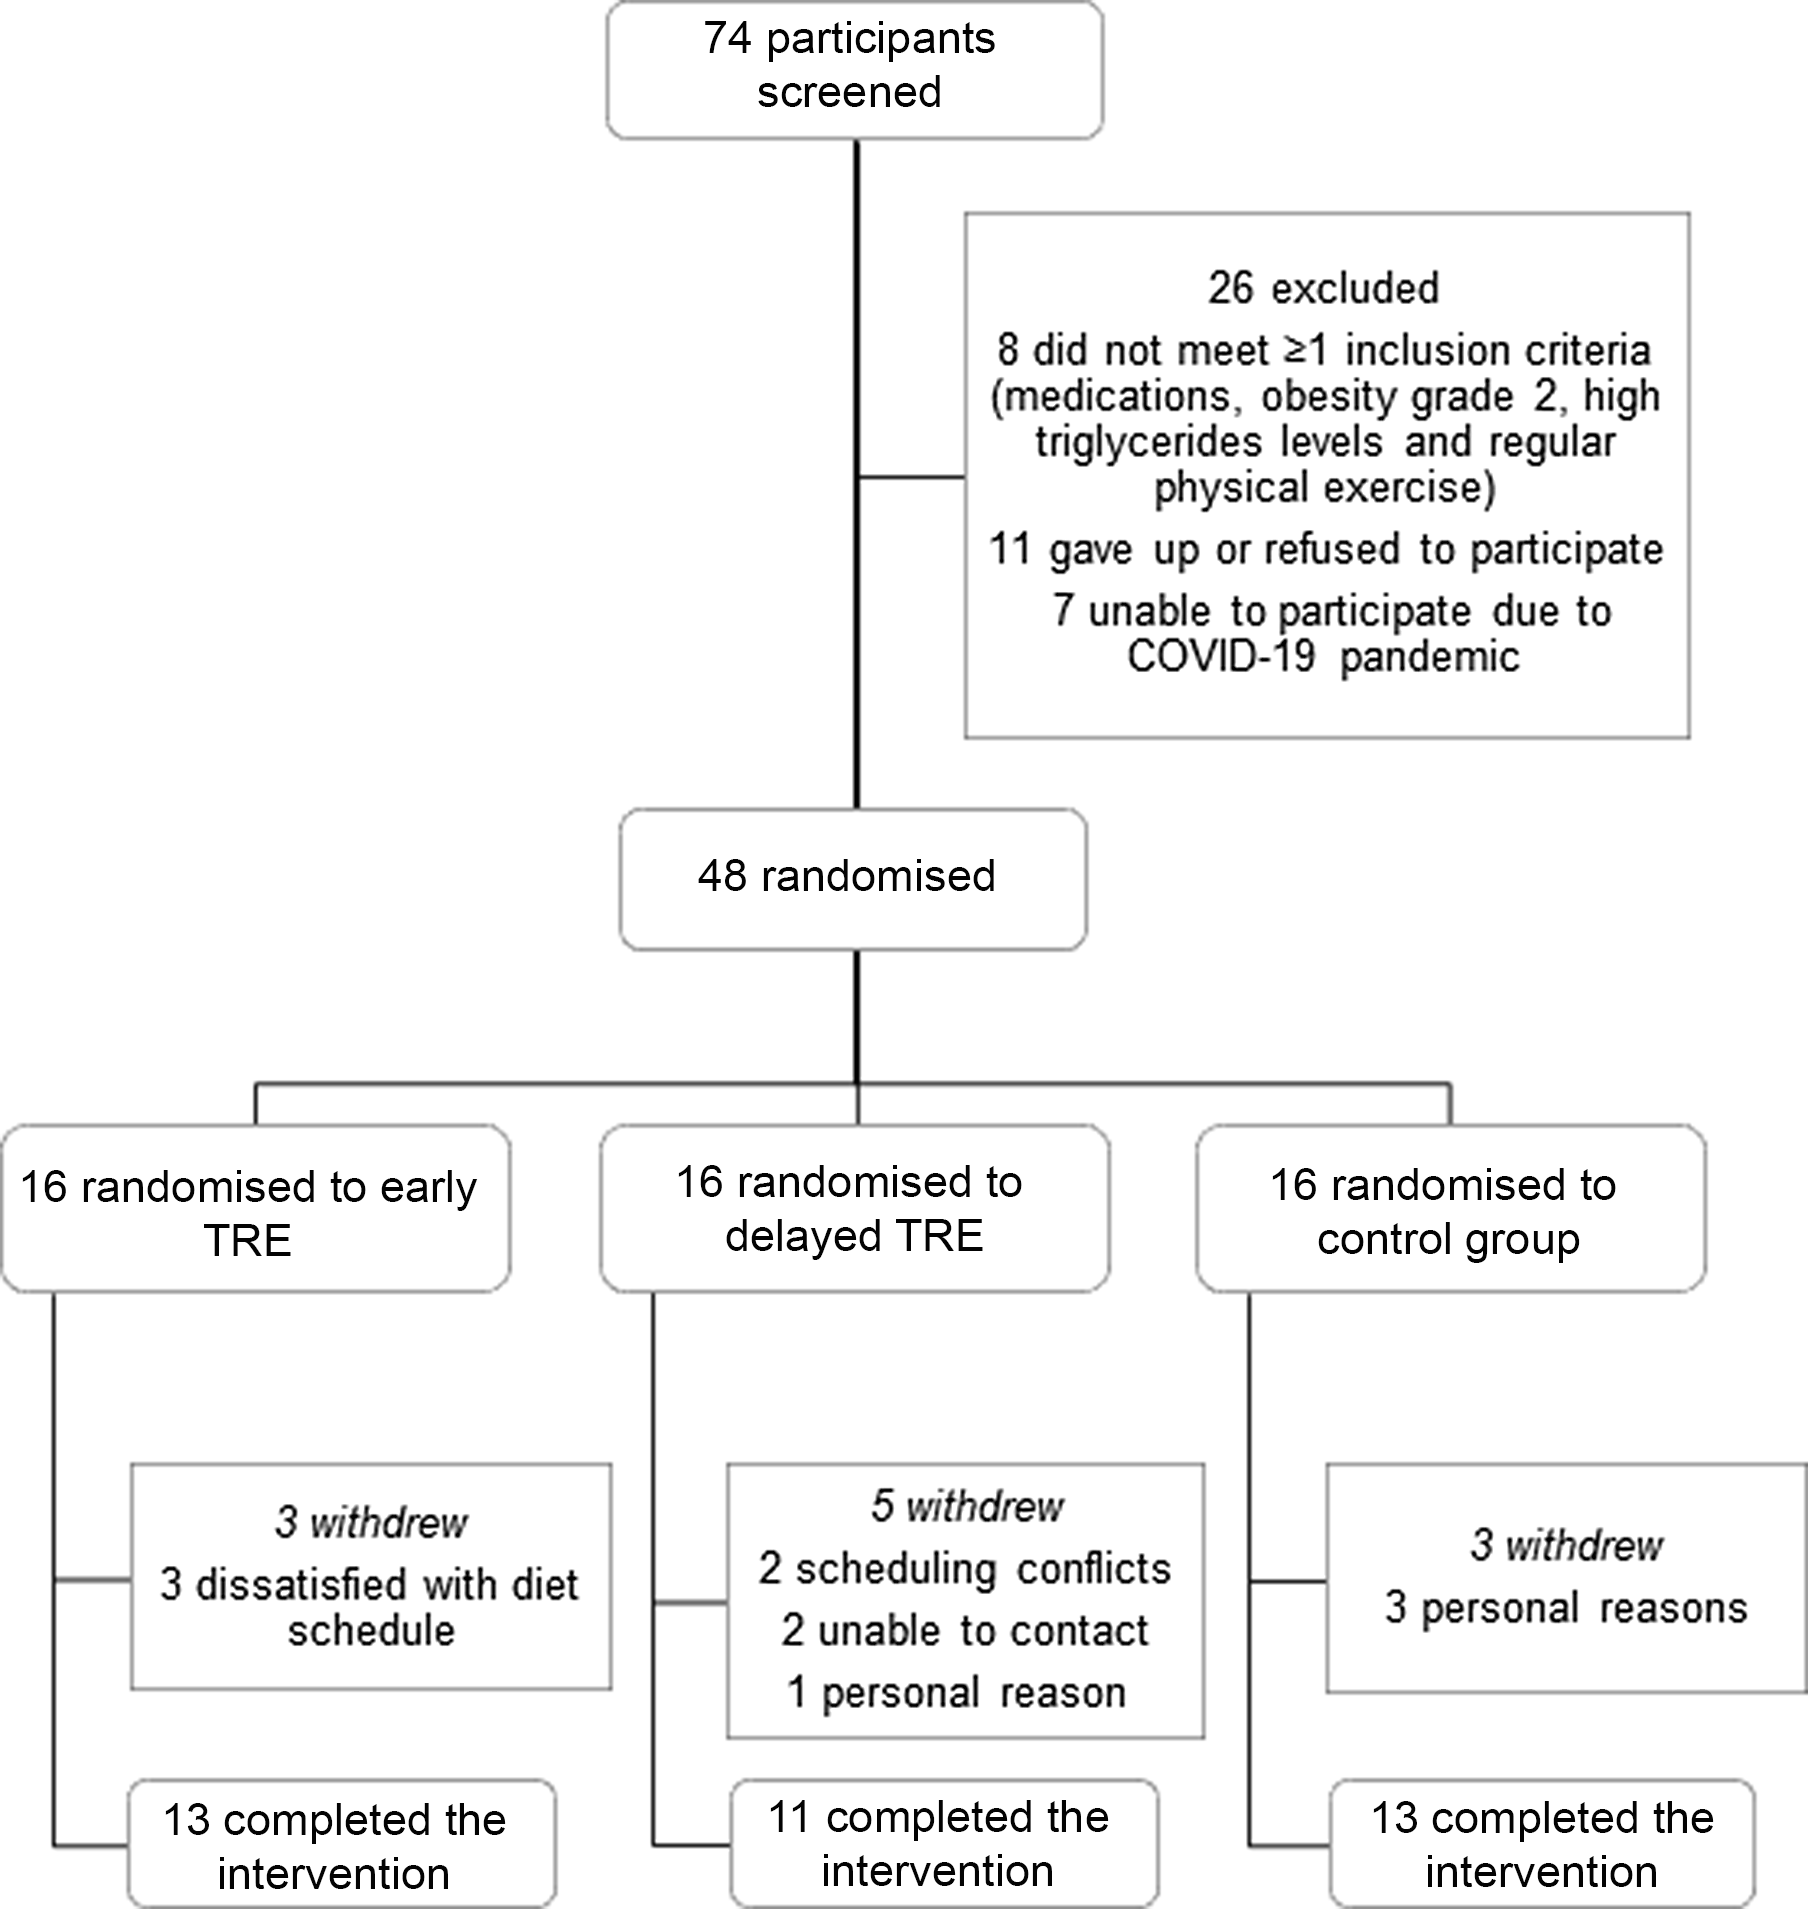
Fig. 2. Participants flow through the trial. TRE, time-restricted eating.
Table 1. Baseline characteristics of the study participants†
(Numbers and percentages)

BMI calculated as weight in kilograms divided by height in metres squared; DBP, diastolic blood pressure; MAP, mean arterial pressure (calculated as DBP in millimetres of mercury multiplied by two plus systolic blood pressure in millimetres of mercury and the result divided by three); SBP, systolic blood pressure; TRE, time-restricted eating; SI conversion factors: to convert glucose to millimoles per litre, multiply by 0·0555; to convert triglycerides to millimoles per litre, multiply by 0·0113.
* Kruskal–Wallis test showed that there was a significant difference between groups only for age in baseline (P = 0·011). Pairwise comparison revealed that there was a significant difference between eTRE and CR groups (P = 0·009).
† Data are presented as mean (standard deviation; sd), unless otherwise indicated.
‡ Missing data (eTRE, n 13; dTRE, n 10; energetic restriction, n 13; participants who completed the study: n 36; all participants: n 46).
§ Missing data due to errors in blood collection (eTRE, n 12; dTRE, n 10; energetic restriction, n 11; participants who completed the study: n 33; all participants: n 44).
Table 2. @Comparison of pre- and post-intervention outcomes (per protocol analysis)*
(Mean values and 95 % confidence intervals)

HOMA-β, homeostasis model assessment of β-cell function; homeostasis model assessment of insulin resistance, homeostasis model assessment of insulin resistance; TRE, time-restricted eating; QUICKI, quantitative insulin sensitivity check index.
SI conversion factors: To convert total, HDL- and LDL-cholesterol to millimoles per liter, multiply by 0·0259; to convert TAG to millimoles per liter, multiply by 0·0113; to convert glucose to millimoles per liter, multiply by 0·0555 and to convert insulin to picomoles per liter, multiply by 6·945.
* Data are presented as mean (95 % CI). Data analysed only for completers (eTRE n 13; dTRE n 11; CR n 13).
† Variable with missing data due to errors in the collection instruments (eTRE n 13; dTRE n 10; CR n 13). One individual in the dTRE group was excluded from the analysis due to insufficient data in the OGTT after 8 weeks.
‡ Variable with missing data due to errors in the collection instruments (eTRE n 10; dTRE n 9; CR n 11). Seven participants (eTRE: 3; dTRE: 2; CR: 2) were excluded from the analysis due to missing data at point 120 min.
§ Variable with missing data due to errors in the collection instruments (eTRE n 12; dTRE n 9; CR n 10).
|| Variable with missing data due to errors in the collection instruments (eTRE n 12; dTRE n 11; CR n 12).
¶ Variable with missing data due to errors in the collection instruments (eTRE n 13; dTRE n 10; CR n 12).
Dietary compliance
Dietary data are presented in Supplementary Table 2 (online Supplementary Table S2). Overall, the compliance to prescribed dietary goals was below expectations. The 3-d food records showed that the participants consumed significantly fewer energies during the study compared with their usual intake but also as compared with the prescribed diet. In relation to the prescribed diet, the energy intake reported in the eTRE, dTRE and CR groups corresponded to 59 ± 14 %, 64 ± 16 % and 67 ± 14 %, respectively. Additionally, the eTRE group consumed significantly less protein than the other groups in the fourth week of the intervention but not in the eighth week. Regarding the eating window, only two participants from each group did not send > 70 % of the photos of their meals. We verified if those who send ≥ 70 % of the photos also completed the eating window at the correct time, according to the mean difference between the last and the first meal. Only one participant in the dTRE group did not meet the correct time of the eating window (13.42 until 21.27), delaying the start and end of his eating window by more than the allowed one hour. For those who were adherent, the average eating window throughout the trial was 07.55 ± 00.24 h (08.46 until 16.41) for the eTRE group, 07.49 ± 00.21 h (12.37 until 20.27) for the dTRE group and 11.44 ± 00.30 h (8.38 until 20.23) for the CR group. Thus, 85 % of the participants in the eTRE and CR groups (n 11) and 73 % of the participants in the dTRE group (n 8) were considered totally adherent to eating window (i.e. sent ≥ 70 % of the photos, had an 8-h or 12-h eating duration and customised their eating schedules by a maximum of one hour).
Body weight and body composition
There was a significant time main effect (P < 0·001), suggesting a decrease in body weight at week 8, with a mean weight loss of –4·2 kg (95 % CI, –5·6, –2·7) for the eTRE group, –4·8 kg (95 % CI, –5·9, –3·7) for the dTRE group and –4·0 kg (95 % CI, –5·9, –2·1) for the CR group, with no significant difference between diet protocols (no group × time interaction, P = 0·679). Total body weight loss was –5·0 %, –5·6 % and –4·7 % for the eTRE, dTRE and CR groups, respectively. Fat mass decreased significantly in the eTRE (–2·9 kg; 95 % CI, –3·9, –1·9), dTRE (–3·6 kg; 95 % CI, –4·6, –2·5) and CR (–3·1 kg; 95 % CI, –4·3, –1·8) groups (time main effect, P < 0·001), but there was no significant difference between protocols (no group × time interaction, P = 0·641). Fat-free mass decreased significantly in the eTRE group (–1·2 kg; 95 % CI, –1·9, –0·5), dTRE group (–1·2 kg; 95 % CI, –1·8, –0·7) and CR group (–1·0 kg; 95 % CI, –1·7, –0·2) (time main effect, P < 0·001), but there was no significant difference between groups (no group × time interaction, P = 0·828). Similarly, there was a significant decrease in BMI and in bone mineral content for the three groups, without a significant difference between them. A significant loss in fat-free mass and fat mass in all body segments was observed, while a significant reduction in bone mineral content was verified only in the trunk (Table 2; online Supplementary Table S1).
Glucose metabolism
There were significant reductions in fasting glucose and insulin levels at week 8 for the three groups, with no significant difference between them. A decrease in fasting glucose levels of −4 mg/dl (95 % CI, −8, −1), −2 mg/dl (95 % CI, −8, 3) and −3 mg/dl (95 % CI, −8, 2) was verified for the eTRE, dTRE and CR groups (time main effect, P = 0·017), respectively. Likewise, fasting insulin levels decreased − 10 µIU/ml (95 % CI, −14, −5), −4 µIU/ml (95 % CI, −9, 1) and −8 µIU/ml (95 % CI, −16, 0) for the eTRE, dTRE and CR groups (time main effect, P < 0·001), respectively. A significant decrease in insulin resistance, measured by homeostasis model assessment of insulin resistance, as well as in the functional β-cell capacity, measured by homeostasis model assessment of β-cells, was observed, without a significant difference between the groups. Additionally, there was a significant increase in insulin sensitivity (measured by quantitative insulin sensitivity check index) with no difference between groups. No significant difference in mean glucose concentration of the 2-h OGTT or insulin sensitivity, measured by Matsuda Index, was quantified after the intervention or between groups (Table 2; online Supplementary Table S1).
Lipid profile
There was a significant decrease in fasting plasma concentrations of total cholesterol in the eTRE group (–12 mg/dl; 95 % CI, –23, –3), dTRE group (–13 mg/dl; 95 % CI, –32, 7) and CR group (–25 mg/dl; 95 % CI, –45, –5) (time main effect, P = 0·001), with no difference between groups (no group × time interaction, P = 0·540). Likewise, there was a significant decrease in fasting HDL-cholesterol concentrations in the eTRE group (–3 mg/dl; 95 % CI, –6, 0), dTRE group (–5 mg/dl; 95 % CI, –10, –1) and CR group (–7 mg/dl; 95 % CI, –11, –4) (time main effect, P < 0·001), with no difference between protocols (no group × time interaction, P = 0·261). There was a significant reduction after the intervention (time main effect, P = 0·011), but no difference between groups (no group × time interaction, P = 0·723), in fasting LDL-cholesterol concentrations in the eTRE group (–8 mg/dl; 95 % CI, –16, 0), dTRE group (–7 mg/dl; 95 % CI, –22, 8) and CR group (–14 mg/dl; 95 % CI, –30, 1). Also, there was a significant decrease in the fasting plasma concentration of non-HDL-cholesterol and a significant increase in the blood concentration of β-hydroxybutyrate, without significant differences between groups. No significant difference in fasting TAG concentrations was verified after intervention or between groups (Table 2; online Supplementary Table S1).
Energy metabolism and subjective parameters
There was a significant decrease in resting metabolic rate over time (eTRE: –69·9 kcal/d, 95 % CI –149·1, 9·5; dTRE: –103·4 kcal/d, 95 % CI –167·3, –39·4; and CR: –131·9 kcal/d, 95 % CI –236·9, –27·0) (time main effect, P < 0·001), without significant differences between protocols (no group × time interaction, P = 0·633). A significant decrease in respiratory exchange ratio in both TRE and CR groups was observed (time main effect, P = 0·047), without significant differences between protocols (no group × time interaction, P = 0·889) (eTRE: –0·03, 95 % CI –0·07, 0·07; dTRE: –0·02, 95 % CI –0·05, 0·02; and CR: –0·03, 95 % CI –0·07, 0·02). No significant difference in peak oxygen consumption was observed after the intervention or between groups. There was a time main effect for sleep quality (P < 0·001) and for risk of binge eating (P < 0·001) (Table 2; online Supplementary Table S1). Both per protocol and intention-to-treat analyses showed a significant group × time interaction for desire to eat (Table 2; online Supplementary Table S1), with post hoc analysis revealing a significant difference between the eTRE and CR groups (–25, 95 % CI –44, – 7; P = 0·006) and between the dTRE and CR groups (–36, 95 % CI –53, –19; P < 0·001), but not between the dTRE and eTRE groups (–10, 95 % CI –29, 8; P = 0·271) (data from per-protocol analysis). Additionally, intention-to-treat analysis revealed a group × time interaction for subjective feelings of hunger and satiety (online Supplementary Table S1). Pairwise comparison showed a significant difference for hunger between the eTRE and CR groups (–20, 95 % CI –34, –6; P = 0·006) and between the dTRE and CR groups (–28, 95 % CI –44, –11; P = 0·001), but not between the dTRE and eTRE groups (–8, 95 % CI –25, 10; P = 0·383). For satiety, there was a significant difference between the eTRE and CR groups (21, 95 % CI 7, 35; P = 0·003) and between the dTRE and CR groups (20, 95 % CI 2, 38; P = 0·032), but not between the dTRE and eTRE groups (–1, 95 % CI –21, 19; P = 0·921). The other results of the intention-to-treat analysis (online Supplementary Table S1) did not substantively differ from the per protocol analysis. No significant change in the levels of physical activity throughout the study was observed (online Supplementary Table 3).
Discussion
In the present study, no unique metabolic benefits of early or delayed 8-hour TRE were observed, relative to a CR group with a 12-h eating period, when all groups were prescribed an energy deficit and consumed three meals per day. Therefore, our results suggest that, with CR, TRE and traditional diet protocols can promote similar benefits for body weight, body composition and metabolic parameters. Previous studies have demonstrated several positive effects of distinct TRE protocols, especially in populations with overweight and obesity(Reference Cienfuegos, Gabel and Kalam8,Reference Gabel, Hoddy and Haggerty9,Reference Sutton, Beyl and Early13,Reference Wilkinson, Manoogian and Zadourian14,Reference Chow, Manoogian and Alvear41) . TRE is hypothesised to exert cardiometabolic improvements through fasting-mediated mechanisms, and TRE does not always involve intentional energy restriction or changes in diet quality(Reference Di Francesco, Di Germanio and Bernier5). However, TRE may spontaneously decrease energy intake under ad libitum conditions, affecting the ability to make clear conclusions about this type of intermittent fasting(Reference Cienfuegos, Gabel and Kalam8,Reference Gabel, Hoddy and Haggerty9,Reference Gabel and Varady11) . Thus, it remains unclear what proportion of the benefits attributed to TRE occurs due to prolonged daily fasting, involuntary energy restriction and weight loss(Reference Queiroz, Macedo and Tinsley12). We chose to prescribe a similar energetic deficit and number of meals to TRE groups and to the comparator CR group to avoid the confounding influence of other dietary factors on our results. TRE and control CR groups under isoenergetic conditions, but with different eating/fasting periods, would allow us to verify if the effects of TRE are due to increased fasting time or due only to CR that often occurs unintentionally in TRE studies.
Our dietary analysis indicated energy consumption lower than prescribed in all groups, which possibly explains the more pronounced reductions in body weight as compared with previous studies of TRE(Reference Cienfuegos, Gabel and Kalam8–Reference Gill and Panda10,Reference Wilkinson, Manoogian and Zadourian14,Reference Chow, Manoogian and Alvear41) . However, it is also known that people with obesity often underreport energetic intake when completing food records(Reference Wehling and Lusher42), indicating a limitation of investigations using this method in free-living individuals. A recent study verified the long-term impacts of TRE plus CR compared with a control group with the same energy deficit in low-income women with obesity(Reference Pureza, da Silva Junior and Praxedes17). Similar to our findings, there were no significant differences in body weight, body composition and vital signs between groups after intervention(Reference Pureza, da Silva Junior and Praxedes17). This study employed a 12-h eating window in the TRE group, which is the same as used in our non-TRE control group. Previous studies suggest that a daily fasting duration longer than 12 h may provide additional cardiometabolic benefits(Reference Anton, Moehl and Donahoo43). Typically, 12 h after cessation of food consumption corresponds to the onset of the metabolic switch, in which liver glycogen stores are increasingly depleted and lipids/ketones are mobilised and oxidised(Reference Anton, Moehl and Donahoo43). Nevertheless, the present investigation indicates that dietary interventions with CR and 3-meals a day promote similar cardiometabolic results in adults with obesity using an 8-h (early or delayed) or 12-h eating window over an 8-week period. Additionally, a 12-h TRE may offer an easier to adhere and more feasible option for individuals who need to lose weight and improve their cardiometabolic health.
Sutton et al. found several cardiometabolic benefits in eight middle-aged men with pre-diabetes after 5 weeks of eTRE compared with a control condition(Reference Sutton, Beyl and Early13). Similar to previous observations in rodents(Reference Hatori, Vollmers and Zarrinpar6), positive findings occurred regardless of energy restriction or weight loss. However, our findings do not corroborate these unique benefits of eTRE as we did not find superior effects of eTRE as compared with other groups. However, the stricter protocol of eTRE (6-h eating window; 08.00 to 14.00) and clinical condition of the participants in the previous study may explain these divergent results. Additionally, eTRE and dTRE were not compared in the investigation of Sutton et al. To our knowledge, only one study directly compared the effects of eTRE and dTRE in adults with obesity to date(Reference Hutchison, Regmi and Manoogian24). In a 1-week crossover study with fifteen middle-aged men, Hutchinson et al. reported no differences between TRE conditions for most biomarkers(Reference Hutchison, Regmi and Manoogian24). However, eTRE significantly reduced mean overnight fasting glucose concentrations compared with baseline, without differences between TRE protocols. These results are similar to those of the present study since we observed benefits in both TRE groups with a slight but not significant improvement in eTRE compared with dTRE for glucose metabolism. Despite the promising results found in our study and others(Reference Sutton, Beyl and Early13,Reference Hutchison, Regmi and Manoogian24,Reference Ravussin, Beyl and Poggiogalle44,Reference Allison, Hopkins and Ruggieri45) , there is little evidence to date that indicates a definitive superiority of eTRE compared with dTRE for human health. Moreover, in our study, eTRE was the only protocol that led to dropouts due to the intervention itself; thus, an 8-h (delayed) or 12-h eating window may be more realistic dietary interventions for compliance.
In the present study, mean reductions in fat-free mass corresponded to approximately 25 % of weight loss. In contrast, a recent study found significant lean mass reductions, corresponding to ∼65 % of weight loss, in middle-aged adults with obesity after 12 weeks of TRE compared with an unrestricted-time diet(Reference Lowe, Wu and Rohdin-Bibby46). Recent studies have highlighted the importance of adequate protein intake while adhering to a TRE diet to mitigate unwanted losses in lean mass(Reference Lowe, Wu and Rohdin-Bibby46–Reference Stratton, Tinsley and Alesi49). In our study, there was a temporary drop in protein consumption in the eTRE group. Even with a prescribed eating plan, participants may have found it difficult to consume protein-rich foods due to the change in eating patterns (fasting from ∼16.00 daily). Although the eTRE group consumed significantly less protein than the other groups in the fourth week, there was no difference at other timepoints. Therefore, the generally similar protein intakes among groups may have contributed to the similar fat-free mass decreases at the end of the intervention.
Contrary to our findings, Jones et al. showed an improvement in whole-body insulin sensitivity in healthy and physically active men after two weeks of eTRE, regardless of changes in body composition(Reference Jones, Pabla and Mallinson50). Additionally, after our diet interventions, similar to previous work(Reference Sutton, Beyl and Early13), differences in mean glucose concentrations during the 2-h OGTT were not observed. Our participants’ low PAL and, consequently, the lower glucose uptake by skeletal muscle may explain the lack of benefits(Reference DeFronzo and Tripathy51,Reference Bowden Davies, Sprung and Norman52) . Moreover, the participants in the present study had obesity but were also generally healthy, which could have mitigated improvements in health outcomes. Nevertheless, additional improvements in most cardiometabolic risk indicators were observed for all diet protocols, including a greater ability to perform the ‘metabolic switch’, characterised by predominant lipid/ketone use in the fasted state at the expense of glucose use, which is related to metabolic benefits(Reference Anton, Moehl and Donahoo43,Reference Mattson, Moehl and Ghena53) .
Regarding the lipid profile, we found significant reductions in plasma concentrations of total cholesterol, LDL-cholesterol, non-HDL-cholesterol – but also of HDL-cholesterol – while fasting TAG concentrations remained unchanged. Previous studies have reported positive effects of intermittent fasting on the lipid profile(Reference Santos and Macedo54,Reference Meng, Zhu and Kord-Varkaneh55) . However, some studies found null or negative results(Reference Cienfuegos, Gabel and Kalam8,Reference Sutton, Beyl and Early13,Reference Lowe, Wu and Rohdin-Bibby46) , while others found positive changes in most, but not all, markers of the lipid profile(Reference Wilkinson, Manoogian and Zadourian14,Reference Chow, Manoogian and Alvear41,Reference Moro, Tinsley and Bianco48) after the TRE approach. As such, further studies are needed to assess the effects of distinct TRE variants on plasma lipids.
Despite the longer daily fasting duration, TRE (early or delayed) but not CR alone improved the control of appetite, increasing satiety and reducing hunger and desire to eat in the present study. We also found significant reductions in the risk score for binge eating, although scores were already low (i.e. scores < 17) at the beginning of the study. Although few studies have investigated the effects of intermittent fasting on binge eating(Reference Hoddy, Kroeger and Trepanowski56,Reference Bhutani, Klempel and Kroeger57) , to date, there is no robust evidence to suggest that nutritional strategies with energy restriction trigger binge eating in people with obesity(Reference da Luz, Hay and Gibson58). Lastly, we found an improvement in sleep quality after all interventions, which is similar to the findings of one previous study(Reference Gill and Panda10) but not all investigations(Reference Wilkinson, Manoogian and Zadourian14). Similar to observations in elite endurance athletes(Reference Moro, Tinsley and Longo59), the peak oxygen consumption remained unaltered after our intervention. These recent results suggest that the TRE protocol seems not to affect this parameter; however, further studies are needed to investigate the effects of TRE on aerobic performance.
To the authors’ knowledge, the present study is one of the first to directly compare the chronic effects of eTRE v. dTRE, as well as to implement both TRE and a CR eating schedule with the same degree of energy restriction and the same number of daily meals in adults with overweight and obesity. Both TRE protocols induced important and clinically relevant weight loss of ≥ 5 % on average over 8 weeks, without compromising fat-free mass beyond the loss seen in the CR group and expectations for energy-restricted diets. Moreover, positive effects were noted for fasting blood lipids, glucose and insulin levels, insulin resistance and insulin sensitivity indices. Thus, the present study indicates that this type of intermittent fasting, regardless of the time of day, is as effective as a traditional energy-restricted diet to promote weight loss and cardiometabolic benefits. Although our findings are promising, future studies are needed to examine whether the body weight loss and cardiometabolic benefits observed in this trial with early and delayed TRE can be sustained in the long term and whether they occur in distinct populations.
The present study has limitations. First, the duration of trial was short, and the viability of this intervention needs to be investigated in the long term. Second, since the dropout rate in dTRE group was higher than expected and the total sample size was smaller than originally calculated, our power to detect differences between groups decreased. Additionally, the a priori power analysis was performed based on expectations for changes in fasting insulin, the primary outcome in the present study. As such, we may have been underpowered for other outcomes, as indicated by the observed power analysis presented in Supplementary Table 4 (online Supplementary Table S4). A low statistical power affects the ability to make definitive conclusions; therefore, our findings should not be overstated – nor understated – but should be considered exploratory. Third, we did not control the menstrual cycle phase. Additionally, almost all cardiometabolic assessments were in normal ranges at baseline, leaving little room for change and differences between groups. Finally, we did not comprehensively investigate the occurrence of adverse effects. Mild adverse events, such as hunger and headaches, were reported to the research team, especially in the first weeks of the study in both TRE groups, suggesting that mild adverse effects may occur at the onset of TRE, but they tend to disappear over time.
In conclusion, under CR conditions, 8 weeks of eTRE, dTRE and traditional diet protocols promote similar improvements of body weight, body composition and cardiometabolic parameters in individuals with overweight and obesity.
Acknowledgements
We acknowledge the study participants without whom this investigation would not have been possible.
This study was financed by the Coordination for the Improvement of Higher Education Personnel (CAPES), by the Foundation for Research of the State of Rio Grande do Sul (FAPERGS) and by the National Council of Scientific and Technological Development (CNPq). The funders had no role in the design and conduct of the study; collection, management, analysis and interpretation of the data; preparation, review or approval of the manuscript and decision to submit the manuscript for publication.
J. N. Q., R. C. O. M. and A. R. O. conceived and designed the research; J. N. Q. conducted the clinical trial, analysed the data, performed the statistical analysis and wrote the manuscript; G. C. S., S. V. M., C. L. F. M., R. L. M., E. N. M., C. E. J. M. and R. S. P. assisted with the conduction of the clinical trial; J. N. Q., R. C. O. M., C. L. F. M., G. M. T. and A. R. O. drafted the manuscript. All authors helped interpret the data, revised the manuscript for critical content and approved the final version of the manuscript.
G. M. T. previously served as a scientific consultant for a phone application that allows users to monitor their usage of intermittent fasting programmes; this consultancy consisted of providing evidence-based information regarding intermittent fasting. The remaining authors have no conflicts of interest to declare.
Supplementary material
For supplementary material/s referred to in this article, please visit https://doi.org/10.1017/S0007114522001581


