


The latest economic crisis, now referred to as the Great Recession, was initiated by the global financial crisis of 2007–2009 and led to serious economic consequences with negative growth and rising unemployment throughout the world( Reference Rudd 1 ). Despite relatively milder effects of the crisis in Denmark compared with many other countries, economic activity in Denmark did not return to pre-crisis levels until 2015( 2 ). Economic activity fell considerably during the first years of the crisis together with investments and private consumption, and the number of bankruptcies and compulsory sales increased, while the level of unemployment doubled( 2 ). This led, for instance, to governmental reforms of the social welfare system, more restrictive loan policies in the financial sector, falling housing prices and stagnating real wages, implying that households experienced a sustained squeeze on household budgets. This affected not only low-income population groups, but also more well-off groups in the population( 3 , 4 ). In the same period, food prices rose sharply by more than the average price increase of other goods( Reference Piesse and Thirtle 5 , Reference Headey and Fan 6 ).
The consequences of a recession may have diverging effects on health and health behaviour. On the one hand, macro-level changes including increased unemployment, bank failures as well as market volatility cause financial restraint, which may increase individual-level pressure and lead to more unhealthy behaviour( Reference Burgard, Ailshire and Kalousova 7 ). On the other hand, some studies find that the increased time available due to unemployment may lead to more time for healthy food preparation, and more time for exercise and sleep( Reference Burgard, Ailshire and Kalousova 7 ). Focusing on food-related practices, unemployment leads to more households experiencing a decrease in income, which calls for new strategies to cope with restrained household budgets. This may lead to unhealthy diets, but over time households experiencing unemployment may gain new skills in handling restrained food budgets and acquire new coping strategies. This, in turn, may lead to healthier food habits; still, for some, a long period of unemployment may cause psychological pressure to increase over time with a potential negative effect on food intake( Reference Müller, Hussain and Larsen 8 , Reference Dowler 9 ).
Non-communicable diseases are a major cause of premature deaths in high-income countries and constitute a major pressure on government health budgets. As the prevalence of non-communicable diseases is negatively correlated with income( Reference Bloom, Cafiero and Jané-Llopis 10 ), the prevalence is expected to increase with increased rates of unemployment in society. Poor diets are one of the main contributors to non-communicable diseases( Reference Bloom, Cafiero and Jané-Llopis 10 ).
Despite a considerable amount of economic literature focusing on the association between macroeconomic conditions and morbidity and mortality( Reference Ruhm 11 – Reference Ruhm 13 ), only a few studies have examined the effect on dietary behaviour, and even fewer have analysed the effect of individual unemployment on dietary behaviour. The literature on the effect of economic conditions and unemployment on dietary behaviour includes, among others, Ruhm’s (2005)( Reference Ruhm 14 ) analysis of the effect of state unemployment rates in the USA on fruit and vegetable consumption, which was based on data from the Behavioral Risk Factor Surveillance System using telephone survey data. In that study, a countercyclical, but not significant, effect was found. Using the same data, Dave and Kelly (2012)( Reference Dave and Kelly 15 ) found countercyclical, but mostly insignificant, effects for foods defined as unhealthy and procyclical effects on foods defined as healthy. In an Internet-based survey with a stratified random sample of 9807 Icelanders ranging in age from 18 to 79 years, Ásgeirsdóttir et al. (2014, 2016)( Reference Ásgeirsdóttir, Corman and Noonan 16 , Reference Ásgeirsdóttir, Corman and Noonan 17 ) found reductions in consumption of sugar-sweetened soft drinks, sweets, fast foods, and fruits and vegetables during the economic crisis. Using individual-level Home-Scan data from the Kantar Worldpanel containing 15 850 UK households, Griffith et al. (2013)( Reference Griffith, O’Connell and Smith 18 ) found that, during the economic crisis, households purchased fewer and cheaper sources of energy, leading to the consumption of more energy-dense types of foods.
In high-income countries, most studies examining the coping strategies of adult household members when the household is faced with food budget strains focus on low-income groups and households already defined as food insecure( Reference Pfeiffer, Ritter and Oestreicher 19 , Reference Dowler and Lambie-Mumford 20 ). Generally, low-income households are found to economise on the food budget by purchasing more in discounters, favouring private-label products over brands, pursuing volume discounts or settling for less expensive products within a product category( Reference Hausman and Leibtag 21 – Reference Griffith, Leibtag and Leicester 23 ). The latter often implies purchasing food with a higher energy density per kilogram( Reference Drewnowski and Specter 24 ) as there is an inverse relationship between energy cost and energy density( Reference Drewnowski and Specter 24 , Reference Andrieu, Darmon and Drewnowski 25 ).
The number of studies conducted in welfare societies with high levels of economic security and relatively little inequality is limited( Reference Borch and Kjærnes 26 ). As global economic developments make far more households in Western welfare states and across socio-economic segments susceptible to economic pressure, and income differences are increasing in parallel with the long-term trend in other countries( Reference Piketty 27 ), this might be an important shortcoming in the literature. Existing wage and labour market structures are under pressure, and the welfare systems are undergoing significant cuts( Reference Harsløf and Ulmestig 28 ). Even in countries with greater equality and higher income levels, such changes are likely to affect food budgets as food spending is one of the most flexible parts of household expenditure.
The objective of the present study was to quantitatively explore household coping strategies in response to economic crisis, particularly how individual unemployment affects food purchases and diet composition, and to investigate the effect over time. This will enable us to test whether unemployment leads to healthier or poorer diets.
Methods
Data and sample
In the current longitudinal study, we use data from GfK Panel Services Scandinavia (hereafter abbreviated to ‘GfK’) covering the period from January 2008 to December 2012. The data set is a household panel, comprising a total of 3440 distinct households that on a daily basis register prices and quantities, store type and whether the product was on offer for all purchased food products. Each month, some households leave the panel and are replaced by similar types of household, leaving the total number of panel members constant at about 1500 per month. On average, a household stays in the panel for 26 months.Footnote * In econometric terms, such a panel is considered ‘unbalanced’.
Since we cannot observe individual consumption for each individual member of the panel households, we have to construct consumption per standard individual in the households. This is achieved by dividing each household’s consumption data with weights that are constructed from gender- and age-dependent daily energy intake derived from the official national dietary survey of Denmark( Reference Pedersen, Christensen and Matthiessen 29 ).Footnote † Although we use ‘consumption’ and ‘purchases’ interchangeably herein, it is important to note that the panel members register purchases, which could potentially deviate from consumption (e.g. due to food waste, food being prepared for friends, eating at a friend’s house, etc.).
Once per year, panel households fill out a survey on social and demographic characteristics (e.g. family size, age and level of education of each household member, number of children, region and income) and GfK seeks to maintain the representativeness of the panel with respect to the geographical location of the households, age, education and family size. Due to the level of detail of the purchase data, which is often at the brand level, we are able to concatenate the purchase data with nutrition data from the Food Composition Databank of the National Food Institute, Technical University of Denmark (http://www.foodcomp.dk/fcdb_default.asp), which entailed 1032 different food items in 2013 when the data set was established. The matrices in the Food Composition Databank include, among other things, information about the content of energy and macronutrients (e.g. protein, fat, carbohydrates) per 100 g of each food item in the databank. The detail in the nutritional composition of the final data is determined by the level of detail in each food group in the Food Composition Databank (e.g. for drinking milk, the information is available for eighteen different types of drinking milk ranging from skimmed milk to whole milk). The values per 100 g of each food obtained from the databank are then multiplied by the volumes purchased of each type of food to obtain the volumes of each nutrient purchased.
The purchase data are aggregated to monthly purchases to minimise mismatch between purchase and consumption. About 30 % of months have one or two weeks where no purchases are recorded and these ‘missing weeks’ were replaced by the average purchases calculated for all the weeks for which the household had provided purchase information. If more than two weeks were missing in a month, the month was deleted. A comparison of our data with consumption data from the official National Survey of Dietary Habits and Physical Activity shows a reasonable correspondence; see online supplementary material, Supplemental File A. The food groups used in the estimations are shown in Supplemental File B. Total food expenditure is adjusted to per standard individual expenditure in the households using the weighted energy-based household equivalent and is then deflated using the food price index from Statistics Denmark to adjust for inflation. We also include the consumer confidence index (CCI). The CCI is a measure used to portray the consumer climate through questions about the economic situation as perceived by consumers at a given time concerning both the general economic situation in Denmark and the financial situation of the family.Footnote * Indicators such as the CCI have been found to be valid predictors of consumption and the usual aim of the CCI is to account for both economic and psychological aspects of consumer behaviour( Reference Vosen and Schmidt 30 ). The reason for inclusion of the CCI in the current study is twofold. First, the CCI controls for the macroeconomic effects of the economic crisis, i.e. the general increased financial strain, changed prices of foods, potential increased stress and the derived effect on food consumption and purchase behaviour. Second, inclusion of the CCI will pick up a possible disjuncture between the consumers’ perceived and actual purchase power. For instance, and particularly important for the analysis in the present paper, some consumers may ‘lag’ in their reactions to unemployment if they have confidence in their own and the surrounding society’s economic capacity.
The purchase data are matched with individual register data on CPR (central person registration) level from Statistics Denmark, which allows us to identify the date of the occurrence of unemployment in the participating households.Footnote † Only individuals below 67 years of age, the official age of retirement in Denmark, are included in the analysis.
Unemployment is a variable that records whether an individual is on welfare benefit, unemployment benefit or in supported employment, which is a type of job training, the aim of which is to get people into jobs. The final variable used is coded to 1 if someone in the household is unemployed on any days during a month. To account for the fact that adjustment to new economic conditions might be a process that occurs over time, the dummy variable for unemployment in the household is crossed with a trend calculating the length of the unemployment period running from 1 (unemployed for only one month) to 72 (unemployed through the whole data period). Owing to the fact that only fourteen households experienced above 36 months of unemployment, these are not used in the estimation. The effects of this decision on the results are tested through a sensitivity analysis.
Diet composition is assessed by considering food purchases in predefined food groups (see online supplementary material, Supplemental File B), while diet healthiness is assessed by consumption of the nutrients that, according to the Danish nutrient recommendations( 32 ), should be consumed in lesser amounts (total fat, saturated fat, added sugar) or higher amounts (fibre) together with carbohydrates and protein.
Empirical model and statistical analysis
Empirical model
As we are interested in a variety of nutrients, food products as well as purchase modes, equation (1) describes the general model we used to estimate the different models, i.e. y accounts for the dependent variable for each of the nutrients investigated, total energy, different food products as well as different modes of purchasing. The model is a fixed-effects model, i.e. it accounts for unobserved heterogeneity, which implies that equation (1) controls for the individual’s initial level of consumption/behaviour, focusing on how a change in the explanatory variables influences the explained variable:
 $$\eqalignno{ & y_{{ti}} \,{\equals}\,\beta _{0} {\plus}\delta _{1} t{\plus}\delta _{2} t^{2} {\plus}\theta _{j} \mathop{\sum}\limits_{j{\equals}1}^{11} {s_{j} } {\plus}\beta _{1} CCI_{t} {\plus}\beta _{2} unemp_{{ti}} \cr & \quad {\plus}\beta _{3} t_{{unemp,ti}} {\times}unemp_{{ti}} {\plus}\beta _{4} t_{{unemp,ti}}^{2} {\times}unemp_{{ti}} {\plus}\beta _{5} single_{{ti}} \cr & \quad {\plus}\beta _{6} capital_{{ti}} {\plus}\beta _{7} urban_{{ti}} {\plus}\beta _{8} child06_{{ti}} {\plus}\beta _{7} child714_{{ti}} \cr & \quad {\plus}\beta _{7} child1520_{{ti}} {\plus}\beta _{8} energy_{{ti}} {\plus}a_{i} {\plus}u_{{ti}} . $$
Where β, δ and θ are the coefficients to be estimated; t is a monthly time trend in quadratic form; s
j
accounts for monthly dummies with January as the base; CCI
t
is the consumer confidence index; unemp
ti
is a dummy for unemployment status for household i at time t; t
unemp,ti
and $t_{{unemp,ti}}^{2} $
are trends increasing with each month of unemployment; single
ti
is a dummy variable accounting for single household (multiple-adult household is the base); capital
ti
and urban
ti
are dummies accounting for capital or urban residence (rural is the base); child06
ti
, child714
ti
and child1520
ti
are dummies accounting for whether there are children in the age group 0–6 years, 7–14 years and 15–20 years, respectively, present in the household (no children is the base); energy is energy consumption in kJ/person (the energy variable will appear in some of the models estimated, but not all); a
i
is unobserved fixed effects for each individual household; and u
ti
is random noise. As y
it
accounts for (among other things) total energy purchased per person as well as total amount of nutrient purchased, we do not account for prices as the prices of these variables are not directly accessible.Footnote * The general effects of the increasing relative prices of food during the economic crisis are at least partly captured through the general trend as well as the CCI, since the latter is negatively correlated with food prices as can be seen by comparing Figs 1 and 2. However, we acknowledge that accounting for the prices directly is a more precise way of controlling for the prices.
$t_{{unemp,ti}}^{2} $
are trends increasing with each month of unemployment; single
ti
is a dummy variable accounting for single household (multiple-adult household is the base); capital
ti
and urban
ti
are dummies accounting for capital or urban residence (rural is the base); child06
ti
, child714
ti
and child1520
ti
are dummies accounting for whether there are children in the age group 0–6 years, 7–14 years and 15–20 years, respectively, present in the household (no children is the base); energy is energy consumption in kJ/person (the energy variable will appear in some of the models estimated, but not all); a
i
is unobserved fixed effects for each individual household; and u
ti
is random noise. As y
it
accounts for (among other things) total energy purchased per person as well as total amount of nutrient purchased, we do not account for prices as the prices of these variables are not directly accessible.Footnote * The general effects of the increasing relative prices of food during the economic crisis are at least partly captured through the general trend as well as the CCI, since the latter is negatively correlated with food prices as can be seen by comparing Figs 1 and 2. However, we acknowledge that accounting for the prices directly is a more precise way of controlling for the prices.
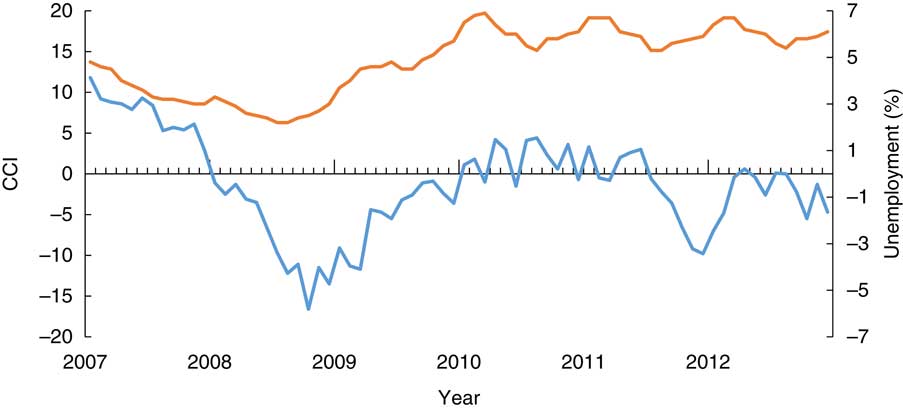
Fig. 1 (colour online) Unemployment (![]() ) and the consumer confidence index (CCI;
) and the consumer confidence index (CCI; ![]() ), Denmark, January 2007–December 2012 (source: figure constructed based on data from Statistics Denmark)
), Denmark, January 2007–December 2012 (source: figure constructed based on data from Statistics Denmark)
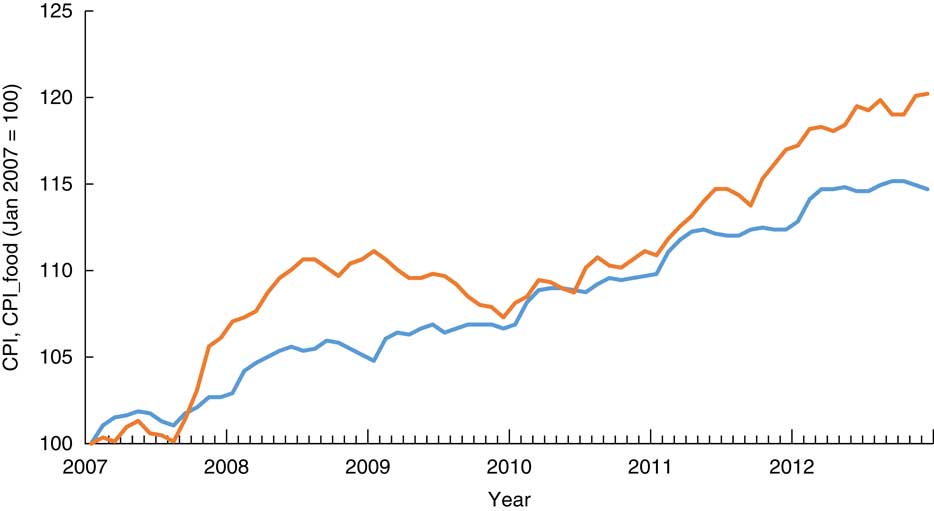
Fig. 2 (colour online) Consumer price index (CPI; ![]() ) and the price index for food (CPI_food;
) and the price index for food (CPI_food; ![]() ), Denmark, January 2007–December 2012 (source: figure constructed based on data from Statistics Denmark)
), Denmark, January 2007–December 2012 (source: figure constructed based on data from Statistics Denmark)
As diet and dietary behaviour may change at an increasing or diminishing rate, we employ a quadratic specificationFootnote † of this trend and, hence, the change in diet or behaviour (y ti ) with unemployment has the following structure:
 $${{\partial y_{{ti}} } \over {\partial unemp_{{ti}} }}\,{\equals}\,\beta _{2} {\plus}\beta _{3} t{\plus}\beta _{4} t^{2} .$$
Where β 2 shows the immediate reactions to unemployment, β 3 shows the change as the duration of unemployment increases with t month, and finally β 4 adjusts for whether the changes diminish (negative) or increase (positive) in duration. Hence, for changes in diets or behaviour that do not follow an adjustment process, β 3 and β 4 are insignificant.
Statistical analysis
First, the model is estimated without the energy variable among the explanatory variables, which gives us the change in the dependent variable resulting from unemployment. To account for change in the amount of, e.g. waste, the model is re-estimated with the energy variable to account for the change in the composition of the diet while holding energy consumption constant. The models were estimated as an unbalanced panel using the statistical software package Stata version 9.4, using a fixed-effects model taking individual heterogeneity into account. We have tried several specifications of the model. We used separate observations for welfare benefits, unemployment benefits and supported employment, which are three different types of unemployment situations. However, as this did not alter the main results, we collapsed the three types into unemployment to increase the number of observations of unemployment. Likewise, the model was estimated to account for the number of unemployed adult members in the household, which made no changes to the results. The lack of any effect might be because there are only a few households where several adult members are unemployed at the same time. Finally, we tried a model that took account of the fact that not all unemployment lasts for a full month. Again, this did not entail changes to the main results, which left us with the proposed specification in equation (1). Sensitivity analyses were performed, testing the results for the effect of estimating the model on only those who stayed in the panel for the full period and testing for the decision to disregard unemployment periods above 36 months. None of these had any effect on the main results. To account for the fact that food purchases and diet composition depend on a number of additional factors, we included a range of sociodemographic variables and fixed effects that account for unobserved heterogeneity and other variables that do not change over time or change by the same amount per time period for everybody in the data set.
Results
Macroeconomic changes
The economic downturn that we measure by the CCI fell from above 10 to below −15 from the first month of 2007 to September 2008 (Fig. 1). Unemployment rose from 4·1 to 6·1 % (in the beginning of the crisis in October 2008, unemployment was 2·5 %). Food prices rose sharply compared with other goods in the same period (Fig. 2). The difference between food prices and other prices is negatively correlated with the CCI, implying that the more the food price increases, the smaller the CCI; which is reasonable as increasing prices will lead to worse absolute as well as perceived economic conditions for households.
Sample characteristics
Table 1 shows a description of the variables used in the model, with mean and sd presented.
Table 1 Description of the variables that enter the model (2007–2012)

For the households in the current study where unemployment is registered for one or more household members, household equivalised income is calculated to be on average 13 % lower than for households that are not unemployed (data not shown). The share of individuals that experience unemployment is somewhat higher in the observed data than the national average shown in Fig. 1, which likely reflects the facts that the panel members are less well educated and live in rural areas to a greater extent than the representative Dane. Unemployment is more prevalent among those who live in rural areas and the less well educated. The share of households that experience unemployment is larger than the share of unemployed individuals, as a household is registered as experiencing unemployment if just one of potentially several adults in a household is unemployed. The average length of an unemployment period is 6·2 months. In Fig. 3 we present a distribution of the length of the unemployment periods (a household can experience more than one period of unemployment). Two hundred and nineteen (22·9 %) of the 957 observed periods of unemployment have a duration of only 1 month, whereas 128 (13·4 %) experience a period of unemployment of more than 12 months. We define short-run unemployment as 1–2 months of unemployment as this consists of 36 % of the unemployment periods and 3–7 months as medium-run unemployment as this likewise is 36 % of the unemployment periods. Above 7 months of unemployment is defined as long-run unemployment.
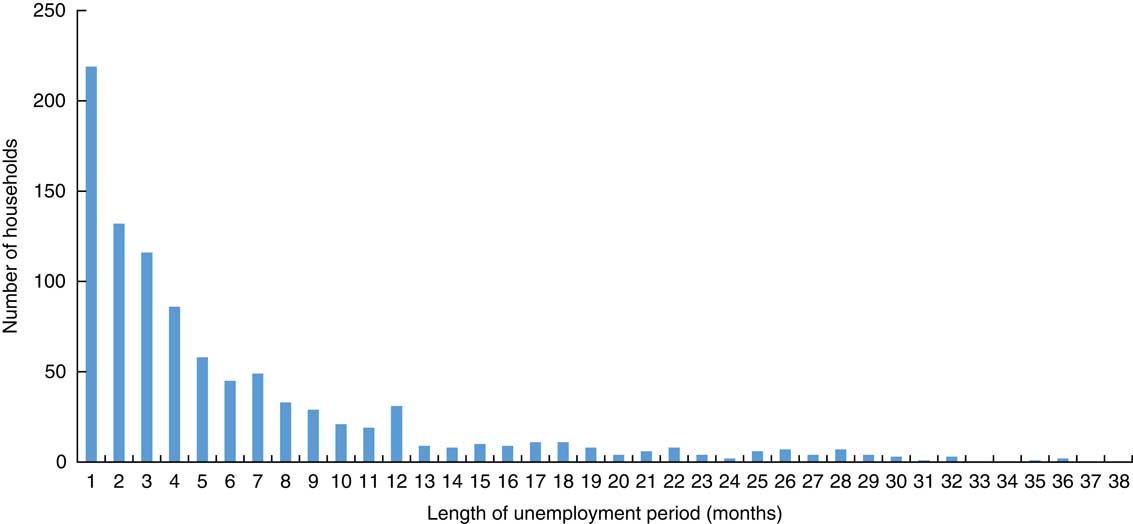
Fig. 3 Length of unemployment periods experienced in the panel, Denmark, January 2007–December 2012 (source: figure constructed based on data from Statistics Denmark)
Effect of the economic crisis and unemployment on diet composition
Relevant parameter estimates on diet composition (expressed as nutrients of relevance; i.e. energy, total fat, saturated fat, added sugar, fibre, carbohydrates and protein) as well as P values are shown in Table 2; and the full parameter estimates, including se and P values, in the online supplementary material, Supplemental File C. An economic downturn (decreasing CCI, β 1) implies the purchase of less total and saturated fat and less protein. When keeping energy purchase constant, i.e. considering the diet quality and disregarding potential changes in waste and away-from-home food purchases, the decreases in total fat, saturated fat and protein are retained. Conversely, when adjusting for energy levels, decreasing CCI entails an increase in added sugar and carbohydrates.
Table 2 Estimation results for the effect of unemployment and economic crisis on nutrient consumption (longitudinal data from a panel of Danish households of working age (n 3440), 2008–2012)
Coeff., coefficient; CCI, consumer confidence index; Unemp, dummy for unemployment; t unemp and t 2 unemp , trend measuring the duration of the unemployment period.
The unemployment status of the household (β 1), measured by a dummy equal to 1 if any adult household member is unemployed otherwise 0, shows the immediate reaction to the changed conditions. The coefficients for this variable, Table 2, show an average increase in monthly purchases of 91 g/person for total fat, 44 g/person for saturated fat and 71 g/person for protein. However, when the amount of energy is held constant to show changes in the composition of the diet, there is also a significant decrease in added sugar. The observed increase in total energy consumed is insignificant, although it amounts to 6956 kJ/person per month, which is equivalent to 3 % of the average monthly intake from Table 1. This reflects a large degree of heterogeneity in the reaction.
The adjustment of diet composition under budget strain due to unemployment may, however, be a gradual non-linear process, which is accounted for by the unemployment trends (β 3 and β 4). As unemployment as well as the two trend variables are highly correlated, a joint significance test is used to determine significance of the parameters. The results of these tests are seen in Table 2. Using equation (2) above, Fig. 4 shows how the purchase of energy (not significant) after 30 months of unemployment has decreased by 14 000 kJ/person per month in the household. Likewise, using equation (2), Fig. 4 shows how the nutrient composition of the diet has adjusted over time keeping energy consumption constant. For example, as an immediate reaction to unemployment, total fat purchase increases by 81 g/person per month; after a little more than 7 months of unemployment, this has fallen to pre-unemployment levels. Finally, after 30 months of unemployment, the consumption has fallen by 100 g/person per month compared with pre-unemployment levels.
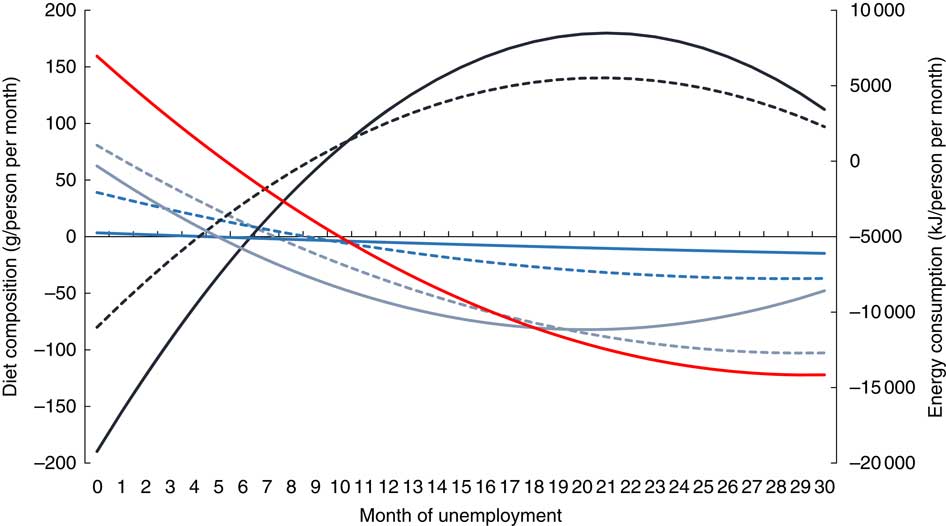
Fig. 4 (colour online) Effect of unemployment over time on energy consumption (![]() ) and diet composition (
) and diet composition (![]() , fat;
, fat; ![]() , saturated fat;
, saturated fat; ![]() , added sugar;
, added sugar; ![]() , fibre;
, fibre; ![]() , carbohydrates;
, carbohydrates; ![]() , protein), keeping energy intake constant (longitudinal data from a panel of Danish households of working age (n 3440), 2008–2012)
, protein), keeping energy intake constant (longitudinal data from a panel of Danish households of working age (n 3440), 2008–2012)
Generally, we find that the consumption of total fat, saturated fat and protein increases in the short run followed by a decrease with the duration of the unemployment status. When interpreting the figures, it is important to keep in mind the fact that the average length of an unemployment period is 6·2 months and that 72 % of the periods are 7 months or less (medium- and short-run unemployment). Hence, for an average length, most households experience a minor increase in saturated fat and total fat consumption. When we control for energy consumption, we also see an immediate decrease in the consumption of carbohydrates and added sugar followed by an increase with the duration of the unemployment period. However, the increased share of sugar in the diet is not experienced before long-run unemployment is experienced. The increase in carbohydrate is experienced in the middle of medium-run unemployment. The consumption of fibre remains constant and all parameters are insignificant.
Effect of the economic crisis and unemployment on coping strategies
To analyse which strategies have been applied by households to cope with the economic strain associated with unemployment, we repeat the estimation of equation (1) with food expenditure deflated with the consumer price index for food, the share of food purchased in discount stores, the share purchased on offer, as well as the various food groups as the dependent variables. Table 3 presents the results of food expenditure, share of food purchased in discount stores as well as the share purchased on offer, while Table 4 shows the results for the various food groups. As above, we perform a joint significance test to test for joint significance of the unemployment variables. Full estimation results for food expenditure and the share variable can be found in the online supplementary material, Supplemental File D, while the parameter estimates for the food groups are available from the authors on request.
Table 3 Changes in food expenditure and share of purchase in discount stores and on special offer as a reaction to changes in consumer confidence, unemployment status and adjustment over time to unemployment status (longitudinal data from a panel of Danish households of working age (n 3440), 2008–2012)
Coeff., coefficient; CCI, consumer confidence index; Unemp, dummy for unemployment; t unemp and t 2 unemp , trend measuring the duration of the unemployment period.
Table 4 Changes in purchase of twenty-one different types of food as a reaction to changes in consumer confidence, unemployment status and adjustment over time to unemployment status, controlled for energy consumption (longitudinal data from a panel of Danish households of working age (n 3440), 2008–2012)
Coeff., coefficient; CCI, consumer confidence index; Unemp, dummy for unemployment; t unemp and t 2 unemp , trend measuring the duration of the unemployment period.
A decrease in the CCI is associated with a decrease in expenditure on food and an increase in the share of food purchased on offer. Unemployment has an immediate effect on food expenditure. However, further analysis, using equation (2), shows that food expenditure decreases with the duration of the unemployment period even when energy consumption is held constant. After 12 months of unemployment, monthly food expenditure per person has decreased by 42 DKK, and by 51 DKK after 19 months. Furthermore, unemployment leads to a 1·6 percentage point increase in the share of food purchased in discount stores. This increases gradually up to 2·2 percentage points, after which a minor increase is observed. These findings are affected only slightly when we control for amount of energy purchased (Fig. 5).
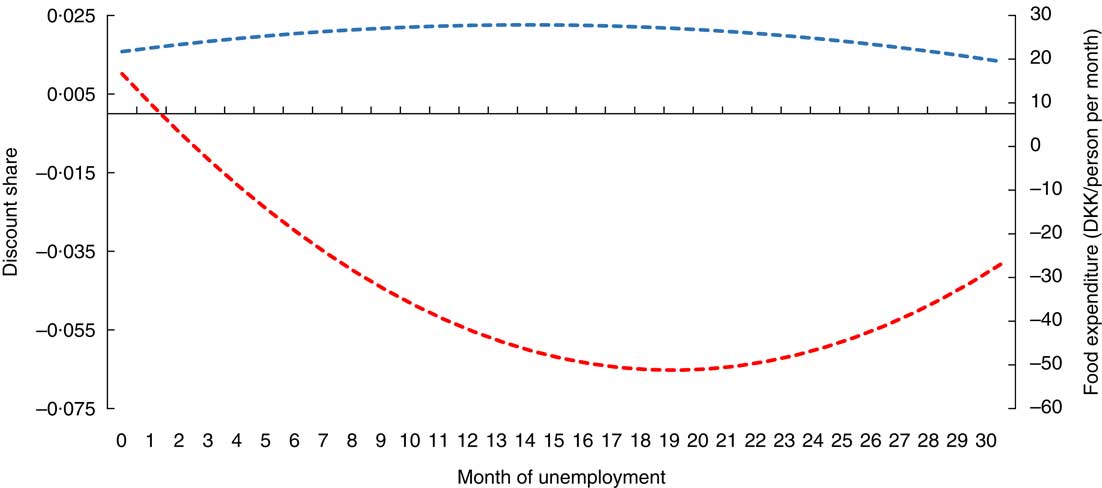
Fig. 5 (colour online) Effect of unemployment over time on food share purchased in discount stores (![]() ) and food expenditure (
) and food expenditure (![]() ), keeping energy consumption constant (longitudinal data from a panel of Danish households of working age (n 3440), 2008–2012)
), keeping energy consumption constant (longitudinal data from a panel of Danish households of working age (n 3440), 2008–2012)
Table 4 presents the results for the changes in purchase of the twenty-one different food groups as a reaction to changes in the CCI, unemployment status and adjustment over time to unemployment status when we control for energy consumption. Due to space restriction, only the parameter and P values are shown here. An economic downturn (decreasing CCI) implies decreased purchases of processed and fresh fish, fruit, poultry, beef, processed and sliced meat, fats, cheese, dairy, eggs and sugar products, but increased consumption of pork and snacks.
Individual unemployment leads to a small immediate change in food groups purchased in the short run (Fig. 6). Significant changes are increases in cheaper animal-based food such as fats, processed fish, cheese and eggs. In the medium run, consumption of these types of foods does, however, decrease; and in the long run, consumption decreases continuously. At 18 months of unemployment consumption of fats has fallen by 26 g/person per month while consumption of cheese and eggs have fallen by 28 and 30 g/person per month, respectively. Consumption of the more expensive types of animal foods, fresh fish, beef and pork undergoes a decrease over the whole unemployment period. The consumption of sugar products increases (significantly at the 10 % level) by 58 g/person per month in the beginning of the unemployment period and remains increased. Consumption of snacks and processed fish increases in the long run.
The general pattern is that consumption of snacks, sugar products and animal-based foods is affected (shown in Fig. 6), whereas the consumption of the remaining product groups is not significantly affected by unemployment; although it is worth noting that the consumption of fresh vegetables is immediately highly negatively, but not significantly, affected by individual unemployment with consumption decreasing as the length of the unemployment period increases.
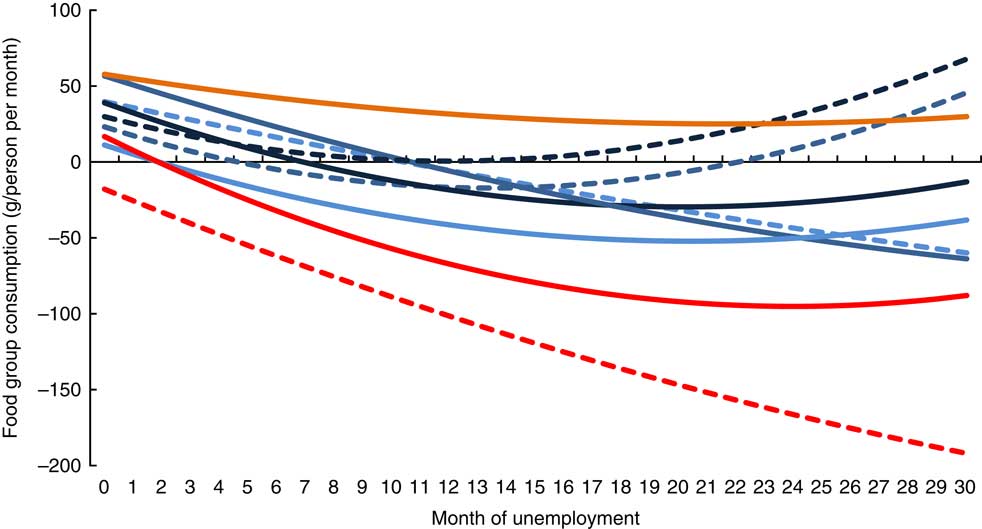
Fig. 6 (colour online) Effect of unemployment over time on food group consumption (![]() , fats;
, fats; ![]() , snacks;
, snacks; ![]() , cheese;
, cheese; ![]() , eggs;
, eggs; ![]() , processed fish;
, processed fish; ![]() , fish;
, fish; ![]() , beef;
, beef; ![]() , pork;
, pork; ![]() , sugar products), keeping energy consumption constant (longitudinal data from a panel of Danish households of working age (n 3440), 2008–2012)
, sugar products), keeping energy consumption constant (longitudinal data from a panel of Danish households of working age (n 3440), 2008–2012)
Discussion
In the current study, we explore and describe quantitatively household coping strategies in response to economic crisis and individual unemployment in relation to food purchases and diet composition. In addition to a dummy variable accounting for unemployment, we have a trend that measures the effect of the duration of the unemployment period. We use observed data for food purchases from a longitudinal panel of Danish consumers as well as nutrition information and individual register data for unemployment.
We adjust for the economic crisis, i.e. the general effect of increasing prices and economic strains, and for possible disjunction between perceived and actual purchase power by using the CCI, which is equivalent for all households. Our study supports the findings of Crossley et al. (2013)( Reference Crossley, Low and O’Dea 38 ) for the UK that the Great Recession, unlike previous recessions, led to a decrease in food expenditure. We also find that more foods are purchased on offer, which according to Leibtag and Kaufmann (2003)( Reference Leibtag and Kaufman 22 ) and Griffith et al. (2009)( Reference Griffith, Leibtag and Leicester 23 ) can lead to considerable savings. The effect of the economic crisis on the share purchased in discount stores is unexpectedly insignificant, which may be related to a general increasing trend for purchases in discounters during the same period. Furthermore, we find that the economic downturn implied a diet with less protein, saturated and total fat as well as more carbohydrates and added sugar. This may be explained by a diet that is less based on animal-source foods, such as processed and fresh fish, poultry, beef, processed and sliced meat, fat, cheese and eggs. Hence, in economically good times, more red meat, fresh fruit and fish is purchased and less pork and snacks (chips, salty and rice-based snacks, dairy snacks, sweets, pastilles and chewing gum, chocolate, marzipan and nougat).
Our main interest in the current paper is to analyse the effect of individual unemployment on coping strategies in relation to food provision and the effects on dietary composition and, thus, dietary healthiness. A considerable strength of the study is that by following the same households over time and accounting for the exact time of unemployment in the household, we are able to control for initial diet composition by including fixed effects and to isolate the effect of the length of the unemployment period. Further, by introducing a general trend and seasonality, we control for overall trends in dietary composition and purchasing behaviour. The results suggest that it is important to account for the duration of the unemployment periods as unemployment leads to different coping strategies depending on its duration. The first reaction to unemployment is to increase the amount spent on food (and likewise the amount of energy, however insignificant), but with increasing duration of the unemployment period, the amount spent on food (and energy consumed) decreases. This might indicate, as suggested by Nielsen et al. (2015)( Reference Nielsen, Lund and Holm 39 ), the better use of leftovers and improved waste management adjustment as the length of the unemployment period increases.
We found that unemployment leads to a substitution towards a diet composed of more protein, fat and saturated fat in the short run. However, with increasing duration of unemployment, this decreases gradually and after 5, 8 and 9 months the consumption of protein, total fat and saturated fat, respectively, becomes negative compared with pre-unemployment levels, while the consumption of added sugar and carbohydrates starts to increase after 4 and 6 months, respectively. When considering the composition of the diet in terms of different food types purchased, there is a short-run increase in mainly animal-based foods, which however decline in the medium and long run.
The significant changes in the nutrient composition suggest that an initial strategy is to purchase cheaper variants of the same types of foods, which leads to a changed nutrient composition, but without large changes in food groups purchased. On a longer-term basis, we see a decrease in the purchase of most food groups. The change in food composition might also be associated with the purchase of cheaper, lower-quality variants of the same foods, but examining this was outside the remit of our research.
The present study strongly suggests that unemployment entails a sequence of behavioural changes over time as to how food is procured: namely, a sudden change in food outlet behaviour (more purchases in discount stores) followed by a gradual decrease in food expenditure. Interestingly, we did not find that unemployment leads to a higher proportion of special offer purchases. A reason for this may be that the present study inquired about self-reported/experienced food budget restraint. Foods on offer are very common in Denmark, and purchasing such foods is a very widespread behaviour in all segments of society, which might explain the lack of a significant effect.
Limitations
One potential limitation with the prevailing data is that they do not account for food consumed away from home and, hence, it is not possible to measure the amount of food purchased in canteens, restaurants and e.g. fast-food outlets. This limitation, however, is considered a minor problem since, unlike many other countries, most food consumption in Denmark takes place at home; according to Statistics Denmark (own calculations), less than one-quarter of the food budget is spent on food away from home. Still, an immediate reaction to unemployment might be to cut back on food intake away from home, and then increase in-house consumption. This might explain the immediate increase in food expenditure, consumption of many food groups and total energy registered in the short run of unemployment. To support this, our data show that total food expenditure increases immediately after an unemployment period starts, despite the increase in the share of food purchased in discounters, which is expected to lead to decreased food expenditure. Therefore, the rather modest decrease in food expenditure in the medium and long run of an unemployment period might be an underestimation, since we expect it to be larger if we could account for the expenditure on food consumed away from home.
Another limitation of the current study is that while we quantify and disentangle the effects from individual unemployment and the general effects of the economic crisis on food consumption patterns and coping strategies, we are not able to distinguish between different causes of the effects of micro and macro effects; for instance, between stress- and economic-related causes, respectively. It should also be noted that, in terms of the length of the average unemployment, the coping strategies applied by the most vulnerable parts of the population, who experience permanent or longer-term unemployment, might not be well covered in the present study. Still the general development in coping mechanisms reported above is in some accordance with observations made among low-income and vulnerable groups as well as in situations of food insecurity. This development has been described as progressing from coping strategies, which first affect the quality of the food eaten among the adults in the household. The next development over time is for households to adopt strategies which impact the quantity of food consumed by adults( Reference Nielsen, Lund and Holm 39 ).
In the short run, unemployment led to substitution in favour of discount stores and increases in food expenditure as well as saturated fat, total fat and protein, due to an increase in consumption of many animal-based products. In the medium run food expenditure declined together with consumption of fresh animal-based products. The consumption of saturated fat, total fat and protein likewise declined; and in the long run these were substituted by carbohydrates and added sugar.
Conclusion
The present study suggests a distinctive difference in food-related coping strategies between individuals experiencing short-run and long-run unemployment. In the short run, the coping strategy identified in this sample of, on average, 1500 households observed monthly over a 5-year period was to substitute to discounters. Furthermore, they substituted towards a diet with more protein, fat and saturated fat due to an immediate increase in consumption of many animal-based products. In the medium run, food expenditure declined together with consumption of fresh animal-based products, hence leading to a gradual decrease in total fat, saturated fat and protein. In the long run, these nutrients were substituted by carbohydrates and added sugar. The results from our study underline the importance of the duration of unemployment for health. Unemployment has a substantial influence on diet composition, but the effects vary considerably with the duration of the unemployment period, which may have potential health implications for those involved. The study also brings evidence that, in a Scandinavian welfare society with a relatively well-developed social security system, periods of unemployment influence health-related behaviour in problematic ways and not only among the most vulnerable population groups. The study thus underlines how aims of public health policy, such as improving dietary health of the population, depend on labour market policy addressing the duration of unemployment periods and on social policies addressing the level of unemployment benefits. Acknowledging such interdependencies may strengthen initiatives in all three policy areas. This knowledge ought to be taken into consideration in evaluations of existing reforms and in future reforms of the welfare systems.
Acknowledgements
Financial support: This research was supported by the Danish Strategic Research Council (grant number 1116175). The Danish Strategic Research Council had no role in the design, analysis or writing of this article. Conflict of interest: None of the authors have financial relationships with any organisation that might have had an interest in the submitted work in the previous 3 years and no other relationships or activities that could appear to have influenced the submitted work. Authorship: S.S. provided the data analysis and the econometric modelling. All authors contributed equally to the design, writing and discussion of the article. Ethics of human subject participation: Not applicable.
Supplementary material
To view supplementary material for this article, please visit https://doi.org/10.1017/S136898001700266X


