


The disaccharide lactose is the most important energy source during the 1st year of human life, providing almost half of the total energy required by infants. However, considering the absence of intestinal transporters for disaccharides, lactose needs to undergo hydrolysis into glucose and galactose by intestinal lactase to be used as a source of energy( Reference Drozdowski and Thomson 1 ). The ability to digest lactose into adulthood in many human populations resulted from genetic mutations enabling the post-weaning production of lactase by the intestine( Reference Curry 2 ). This adaptation was probably driven by a positive evolutionary pressure that provided nutritional benefits, milk being an important source of energy and water in times of drought as well as a source of calcium preventing rickets and osteomalacia in regions with low sunlight( Reference Curry 2 , Reference Silanikove, Leitner and Merin 3 ). A complementary mechanism mediating lactose hydrolysis through adaptation of the colonic microbiota also contributes to the ability of adults to metabolise lactose( Reference Silanikove, Leitner and Merin 3 ). This use of lactose by the intestinal microbiota is similar to the process that occurs during milk fermentation in which the resulting production of lactic acid underlies the physical and chemical transformation of the food. In the context of these biological processes, and in the absence of a dedicated intestinal transporter of lactose, the presence of unhydrolysed lactose in the circulation after ingestion of dairy products, fermented or not, is not expected.
The identification of unhydrolysed lactose in blood (lactosaemia) or urine has nevertheless been associated with specific cases, such as nursing mothers, newborns( Reference Cox, Kent and Casey 4 – Reference Bezerra, Thompson and Morse 6 ), patients with gastrojejunostomy( Reference Gryboski, Thayer and Gryboski 7 ) or subjects with abnormal intestinal permeability caused by gastrointestinal disorders, for example coeliac disease( Reference Weser and Sleisenger 8 ) and rotaviral gastroenteritis( Reference Noone, Menzies and Banatvala 9 ). In this context, Northrop et al.( Reference Northrop, Lunn and Behrens 10 ) have proposed urinary lactose, after oral administration of lactose, as a marker to evaluate intestinal integrity in adults. However, increases in urinary lactose were also observed, although at lower levels, in healthy adults after oral intake of lactose solutions and milk( Reference Bezerra, Thompson and Morse 6 , Reference Weser and Sleisenger 11 – Reference Menzies 13 ), suggesting that part of the ingested lactose can also pass through an intact gastrointestinal barrier to reach systemic circulation and, subsequently, urine. Indeed, this appeared to be confirmed in the work of Pellis et al.( Reference Pellis, van Erk and van Ommen 14 ) who reported, in healthy overweight men, the presence of lactose in plasma after the ingestion of a challenge meal based on a milkshake. However, it is noteworthy in light of the relevance of blood lactose to the diagnosis of the clinical situations mentioned above, that the ability of lactose to cross the intestinal barrier to reach blood has not been actively investigated. In particular, information on: (i) the concentrations of lactose that reach the circulation, (ii) the impact, on these concentrations, of the lactose content of the ingested dairy products and (iii) the inter-individual variability in blood lactose, have not been reported. Moreover, lactose uptake might also be influenced by the presence of bacteria expressing β-galactosidase, the enzyme responsible for the hydrolysis of lactose. In the present report, we address these questions by measuring (in blood) the absorption and clearance of intact lactose from a food matrix. Samples were obtained from a recently published cross-over study with fourteen healthy men in which the metabolic impact of the ingestion of milk and yogurt, two dairy products that differ in lactose concentration, was evaluated by following changes in markers of inflammation, the faecal microbiota( Reference Burton, Rosikiewicz and Pimentel 15 ), as well as the serum metabolome( Reference Pimentel, Burton and Pralong 16 ).
Methods
Details on the experimental design have been published elsewhere( Reference Burton, Rosikiewicz and Pimentel 15 ).
Subjects
Subjects were healthy men (n 14) recruited by advertisement in the Lausanne region, with a mean age of 25 years (sem 1·3, recruitment range of 18–40 years) and a mean BMI of 22 kg/m2 (sem 0·5, recruitment range of 18·5–25·0 kg/m2). The ethnicity of thirteen subjects was Caucasian while one subject was Black African. A detailed, tabulated description of these subjects has been published elsewhere( Reference Burton, Rosikiewicz and Pimentel 15 ). No subject reported evidence of intolerance or adverse reactions to dairy products during the recruitment process. Exclusion criteria also included dietary restrictions, dietary supplement intake, chronic or acute illnesses, regular medication or antibiotic treatment in the 6 months preceding the study. Subjects’ recruitment was confirmed by an inclusion visit consisting in dietary and physical activity assessments, a physical medical examination, anthropometrics and bioimpedance analysis (ImpDF50; ImpediMed) and standard clinical biochemistry (fasting glycaemia, insulinaemia, lipid profile, full blood count and Fe profile) to ensure that all aspects of the inclusion criteria were met. Before entering the study, all subjects provided written informed consent. The study received ethical approval from the Commission Cantonale d’Ethique de la Recherche sur l’etre humain (CER-VD, approval no.: 392/13, Vaud, Switzerland); the trial was registered at clinicaltrial.gov (registration no.: NCT02230345).
Test products
The yogurt investigated in this report was produced by fermentation of milk with classical yogurt starter cultures and the probiotic strain Lactobacillus rhamnosus GG (LGG). Starter cultures were a mix of Lactobacillus delbrueckii ssp. bulgaricus and Streptococcus thermophilus strains (Thermophilic Yoflex®; CHR Hansen A/S). The probiotic LGG was obtained from the Culture Collection of the University of Göteborg, Sweden (CCUG 34291/ATCC 53103). Starter cultures and LGG were added simultaneously to the milk and fermentation was performed at 39°C for 4 h. The non-fermented milk product was a chemically acidified full fat milk (3·5 %) prepared by the addition of 2 % D-(+)-glucono-δ-lactone (GDL≥99·0 %; Jungbunzlauer AG). The addition of 2 % GDL to milk mimics the slow pH reduction created during fermentation, the final product having a texture and pH similar to that of a mild semi-liquid yogurt. This ensured that the subjects were digesting both products at comparable rates and allowed the comparison of postprandial kinetics without the influence of texture on gastric emptying. The milk used in both products was provided by Emmi (Mittelland Molkerei AG) that was derived from a single production batch, homogenised, ultra-high temperature processed, and stored at 3°C. The products were prepared at the pilot plant of Agroscope to industrial standards in accordance with Swiss food legislation. The ‘Manuel suisse des denrées alimentaires’ was adhered to at all times. Ingredients and supplements to the products were used in accordance with Swiss food law. Lactose was quantified in the products after β-galactosidase hydrolysis followed by oxidation of the glucose moiety and redox reaction using 2,2'-azino-bis(3-ethylbenzothiazoline-6-sulphonic acid) (ABTS). Galactose was quantified after β-galactose dehydrogenase oxidation and assessment of produced NADH. Both measurements were conducted using the Thermo ScientificTM Gallery Automated Photometric Analyzer (Thermo Fisher Scientific AG), at 420 nm for ABTS and 340 nm for NADH.
Dietary intervention
The dietary intervention described in the present article was a randomised, double-blind, cross-over study performed at the Centre of Clinical Research of the Centre Hospitalier Universitaire Vaudois in Lausanne. The study was designed to characterise the effects of acute and semi-chronic intake of fermented dairy foods, including effects on clinical chemistry parameters, inflammatory markers, serum metabolome and the faecal microbiome( Reference Burton, Rosikiewicz and Pimentel 15 ). The data presented here relates specifically to the acute intake of the dairy products. In brief, on each acute test day, each of the fourteen participants ingested a single 800 g dose of milk or yogurt within 15 min, serum was taken at ten time points (fasting then 15, 30, 60, 90, 120, 180, 240, 300 and 360 min postprandially) and stored at −80°C. During the 3 weeks preceding each test day, participants consumed 400 g of normal milk/d (200 g morning and evening) and followed a semi-controlled diet that excluded all dairy products not provided by the study organisers and included specific guidance on portions of fermented foods, alcohol intake and caffeine intake to replicate normal baseline eating patterns. For the 3 d before each test day, participants followed a controlled diet, in free-living conditions( Reference Burton, Rosikiewicz and Pimentel 15 ).
Genetic test for lactase persistence
Although participants confirmed that they regularly consumed milk with no signs of adverse reaction, lactase persistence was evaluated after the completion of the study. To this end, a genetic test to assess one of the major single nucleotide variants that is associated with lactase persistence (−13910 C>T polymorphism, rs4988235) was carried out for Caucasian subjects following completion of the clinical protocol. DNA was prepared from buffy coats using the Maxwell protocol for DNA extraction (Promega). Samples were prepared according to the protocol defined by the EliGene® Lactose Intolerance C-13910T LC Kit (Elisabeth® Pharmacon). RT-PCR was carried out using the Lightcycler 96 (Roche) with internal standards for positive and negative controls. Results were expressed using end-point genotyping.
Serum lactose and galactose GC-MS analysis
Serum samples were prepared to perform untargeted GC-MS metabolomics; however, the present article focuses on the analysis of lactose and galactose. Samples were prepared according to the Human Serum Metabolome Consortium procedure with small modifications of the protocol (HUSERMET)( Reference Begley, Francis-McIntyre and Dunn 17 ). U13C6-labeled D-fructose (0·17 g/l solution in water) was used as internal standard (Cambridge Isotope Laboratories, Inc.). A quantity of 50 μl of the internal standard was added to 100 µl of the serum samples. The mixture was precipitated with 300 μl of acetonitrile (Sigma-Aldrich GmbH) and centrifugated at 13 000 rpm for 15 min. The supernatant (370 µl) was then lyophilised at room temperature, at 10 mbar. A two-step derivatisation was applied to the dry extract. A quantity of 50 μl of a 20 g/l O-methoxylamine solution in pyridine (Acros Organics and Merck Chemicals) were added to the extract before heating at 80°C for 15 min. This was followed by the addition of 50 μl N-methyl-N-(trimethylsilyl) trifluoroacetamide (Sigma-Aldrich) and a second heating at 80°C for 15 min. Finally, 20 μl of a retention index solution was added before centrifugation (15 min, 13000 rpm) and 100 μl of the supernatant was used for GC-MS measurement. The retention index solution consisted in a mix of five n-alkanes at 0·3 g/l in pyridine (C10, C12, C15, C19 and C22; Merck Chemicals).
GC-MS measurement was performed on an Agilent 7890B/5977 A GC-MS system, 70 kV, equipped with a DB-5MS column 60 m×0·250 mm×0·25 μm (Agilent Technologies). The temperature programme was 70°C for 2 min, 5°C/min to 160°C (hold time 0 min), 10°C/min to 300°C (hold time 16 min). Peak integration was performed using Agilent MassHunter Quantitative Analysis Software (V.B.7.00; Agilent Technologies). A total of 1812 metabolites were detected in postprandial serum using this method, lactose and galactose identities were specifically confirmed by the injection of pure standard solutions. Concentrations were calculated from calibration curves using solutions in water ranging from 7·0×10−3 to 7·0×10−1 mmol/l for galactose and 3·5×10−3 to 3·5×10−1 mmol/l for lactose. Linear evaluation of the incremental AUC (iAUC) over 6 h was completed to assess the postprandial lactose and galactose responses of the organism to the ingestion of the milk and yogurt products.
Microbiota analysis
The faecal microbiota was assessed at baseline immediately before the acute intake of each dairy product. Faecal samples were collected by the participants and stored as described previously( Reference Burton, Rosikiewicz and Pimentel 15 ). In brief, the samples were processed under sterile conditions within 4 h of sample collection in glycerol–brain heart infusion solution and stored at −80°C following homogenisation by agitation. DNA was extracted using the QIAamp DNA Mini kit according to the manufacturer recommendations (QIAGEN). The faecal microbiota was examined by Illumina Miseq sequencing of PCR amplified V3–V4 variable region of 16S rRNA. The raw reads were processed with the use of USEARCH( Reference Edgar 18 ) pipeline and Silva database (version 123) as previously described( Reference Burton, Rosikiewicz and Pimentel 15 ). In addition, the presence of genes encoding homologs of Escherichia coli β-galactosidase (lacZ) was evaluated for the dominant bacterial genera (≥5 % of all reads) by assessment of the genome of representative species with the tblastn algorithm( Reference Altschul, Gish and Miller 19 ).
Statistical analyses
Serum samples used in the present report were obtained from a published intervention study in healthy men who ingested milk or yogurt( Reference Burton, Rosikiewicz and Pimentel 15 ). The primary outcome measure of the study was the untargeted postprandial serum metabolome as described in clinicaltrial.gov (registration no. NCT02230345). Given the untargeted nature of the metabolomics analysis, the desired sample size for the study could not be calculated a priori and is therefore based on similar published cross-over nutritional studies that used untargeted metabolomics analyses on postprandial samples. In particular, a sample size in the range of fifteen subjects has been shown to give sufficient statistical power to detect significantly regulated metabolites( Reference Krug, Kastenmuller and Stuckler 20 – Reference Munger, Trimigno and Picone 24 ). Using our untargeted GC-MS method, a total of 1812 metabolites were detected in postprandial serum. Lactose and galactose were identified among the metabolites presenting a significant change in postprandial serum after the ingestion of milk or yogurt (after correction for multiple testing). In light of the unexpected presence of lactose in serum, lactose and galactose were specifically investigated with the confirmation of their identities and quantification using calibration curves.
All statistical analysis were performed using R (3.1.2), with 0·05 as the P value significance cut-off. A paired Wilcoxon’s signed-rank test was used to compare lactose and galactose intensities after milk or yogurt intake at each time point and between subjects with or without lactase persistence. A non-parametric longitudinal data analysis was performed to test the hypothesis that a time effect exists during the postprandial phase (package nparLD version 2.1)( Reference Noguchi, Gel and Brunner 25 ). The MESS package (version 0.3.2) was used for calculation of iAUC and the ppcor package (version 1.1) for the Spearman’s partial correlation test between serum galactose and serum lactose levels. Microbiota analysis was completed on taxa present at a minimum mean abundance of 0·01 % per volunteer in at least three volunteers as described previously( Reference Burton, Rosikiewicz and Pimentel 15 ). The relationship between baseline microbiota composition (species and genera level analysis) and the postprandial response to acute dairy intake for galactose and lactose was explored by Pearson’s correlation test. Multiple testing was corrected using the false discovery rate (FDR)( Reference Benjamini and Hochberg 26 ) and significant associations were considered at FDR <0·10.
Results
Saccharide composition differences between products and in serum after products intake
The use of lactose by lactic acid bacteria during fermentation of the milk led to large changes in lactose and galactose composition of yogurt with a 2-fold decrease in lactose content (48·5 g/l in milk, 25·2 g/l in yogurt) and a 36-fold increase in galactose content (0·05 g/l in milk, 1·79 g/l in yogurt). In serum, a dynamic response of lactose was detected after both intake of milk and yogurt, with levels remaining higher at 6 h compared with baseline (Fig. 1(a)). In accordance with the lactose content in the test products, postprandial lactosaemia was significantly higher after milk intake compared with yogurt intake, from 30 to 360 min. Galactose presented markedly different postprandial kinetics (Fig. 1(b)). While there was little, although significant increase of galactose after milk intake (significant time effect, P=8·5×10−4, online Supplementary Fig. S1), clear absorption and clearance of galactose were observed after yogurt intake with maximum levels reached after 60 min and a return to baseline by 240 min (significant time effect, P=1·2×10−33). Median serum concentrations of approximately 0·02 mmol/l lactose and approximately 0·2 mmol/l galactose were observed after the ingestion of milk and yogurt, respectively. Fig. 2 reveals a significant negative correlation between postprandial lactose and galactose (partial correlation test: Spearman ρ=−0·44, P=2×10⁻²), suggesting that if less lactose has been cleaved in the participant’s intestine, more of it is found intact in blood.
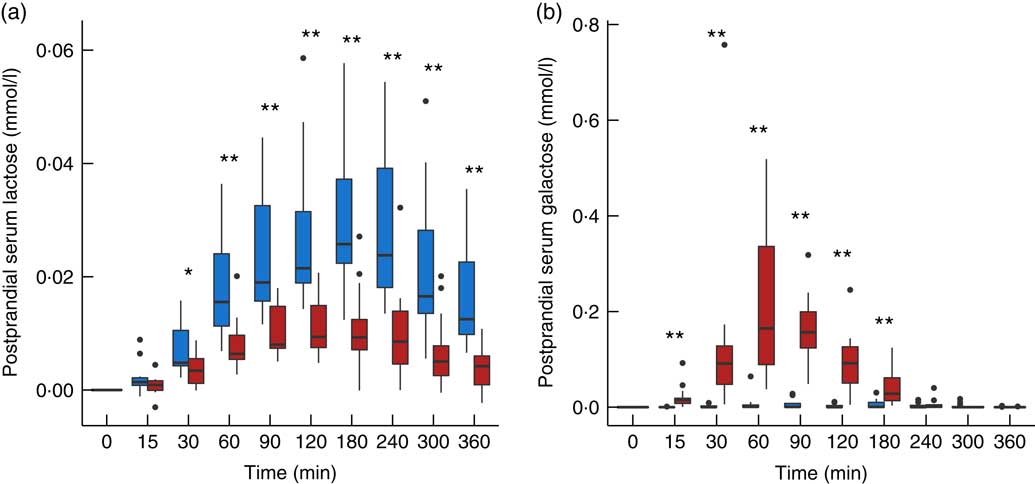
Fig. 1 Serum lactose (a) and galactose (b) after milk (![]() ) and yogurt (
) and yogurt (![]() ) intake in fourteen healthy men. Interquartile range plotted.
) intake in fourteen healthy men. Interquartile range plotted. ![]() , Median;
, Median; ![]() , outliers. Significant difference between milk and yogurt intake, * P<0·05, ** P<0·005, paired Wilcoxon’s signed-rank test for each time point.
, outliers. Significant difference between milk and yogurt intake, * P<0·05, ** P<0·005, paired Wilcoxon’s signed-rank test for each time point.
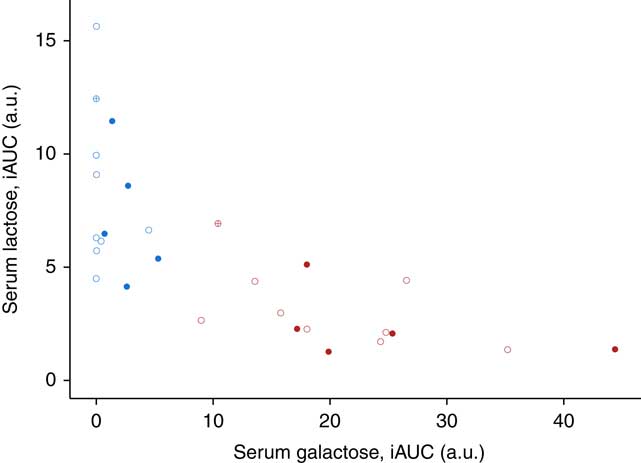
Fig. 2 Correlation between the postprandial response for serum lactose and galactose after 800 g dairy intake in fourteen healthy men. Data plotted per subject for milk (blue) and yogurt (red) intake. Participants with lactase persistence (![]() and
and ![]() ) and non-persistence (
) and non-persistence (![]() and
and ![]() ) according to genetic testing. Genetic testing not applicable for one participant of Black African origin (
) according to genetic testing. Genetic testing not applicable for one participant of Black African origin (![]() and
and ![]() ). Postprandial incremental AUC (iAUC) in arbitrary units (a.u.). Partial correlation test among all serum samples after milk or yogurt intake using Spearman’s method, ρ=−0·44, P=2·1×10−2.
). Postprandial incremental AUC (iAUC) in arbitrary units (a.u.). Partial correlation test among all serum samples after milk or yogurt intake using Spearman’s method, ρ=−0·44, P=2·1×10−2.
Determinants of the postprandial responses to dairy intake
Fig. 2 also indicates inter-individual variability in the postprandial responses to galactose and lactose. Indeed, the iAUC after yogurt intake varied across the subjects by a factor of 3·8 for galactose (x-axis of Fig. 2) and 5·2 for lactose (y-axis of Fig. 2). This variability is also illustrated for each subject in the online Supplementary Fig. S2 and S3. Interestingly, genetic testing revealed that eight participants out of fourteen did not have the single nucleotide variant (T allele, rs4988235) associated with lactase persistence. However, as illustrated in Fig. 2, there was no clear differentiation between these two populations. The Wilcoxon’s signed-rank test comparing serum iAUC after milk intake between subjects with or without lactose persistence was not significant (P=1 for serum lactose and P=8·9×10−2 for serum galactose).
The analysis of baseline microbiota before each acute intake revealed a marked inter-individual variability for the most dominant genera (Fig. 3(a)) and their ability to express β-galactosidase (Fig. 3(b)). Nevertheless, the presence of the genes encoding for the homologs of E. coli β-galactosidase (identity>31 %, similarity>47 %, coverage>97 %) could be demonstrated in the vast majority of the dominant bacteria (in ten out of twelve examined genomes).
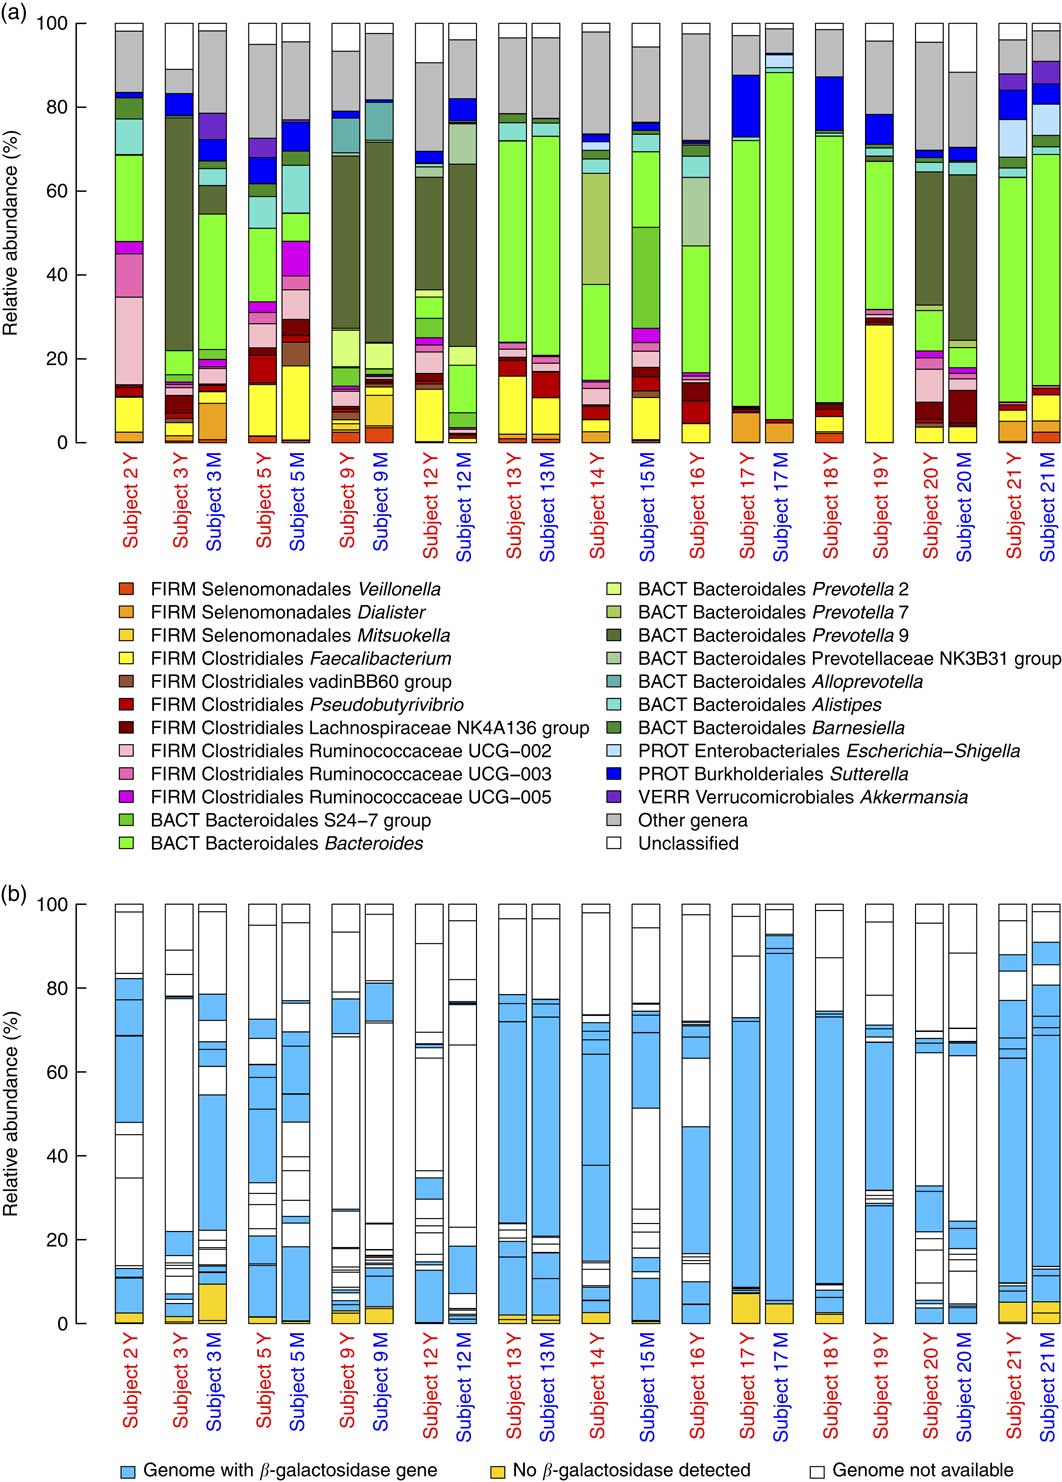
Fig. 3 (a) Baseline microbiota of subjects immediately before yogurt (Y) and milk (M) intake. The graph shows the relative abundance of the major genera (present>5 % in at least one subject) together with families without genus classification (S24-7 group and vadinBB60 group) and Veillonella genus. The phylum abbreviations (FIRM, Firmicutes; BACT, Bacteroidetes; PROT, Proteobacteria, VERR, Verrucomicrobia) are followed by class and genus name. (b) Relative abundance of major genera are coloured on the basis of presence or absence of the β-galactosidase gene.
Baseline faecal microbiota analysis revealed that the postprandial levels of lactose after milk intake were positively correlated with the abundance of Veillonella genus (Spearman’s ρ=0·90, P=8·8×10−4, FDR corrected P=6·4×10−2) (Fig. 4) with corresponding positive correlations also being observed for two species of the same genus, Veillonella dispar (Spearman’s ρ=0·89, P=1·2×10−3, FDR corrected P=7·3×10−2) and Veillonella atypica (Spearman’s ρ=0·87, P=2·5×10−3, FDR corrected P=7·3×10−2).
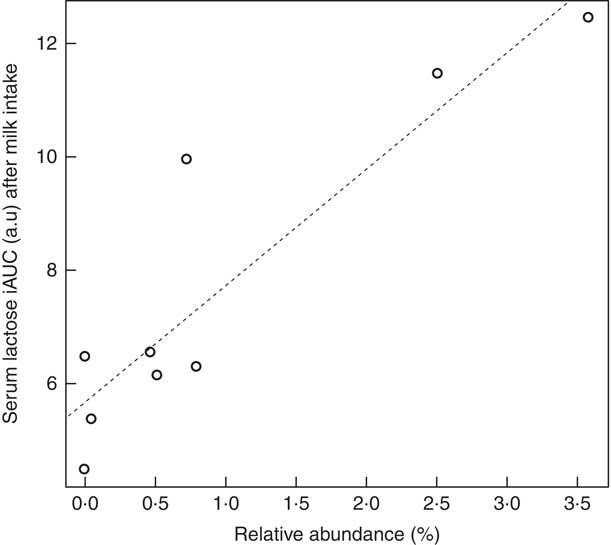
Fig. 4 Correlation between postprandial serum lactose after milk intake and Veillonella genus abundance in baseline microbiota. Test for correlation using Pearson’s method, ρ=0·90, P=8·8×10−4, false discovery rate corrected P=6·4×10−2. iAUC, incremental AUC; a.u., arbitrary units.
Discussion
The presence of lactose in postprandial serum, shown by the present study, concurs with the existing human clinical data that report lactose detection in urine after oral intake of lactose. In healthy men, increases in urinary lactose were reported in 5 h urine samples after 25 g oral intake of lactose( Reference Bezerra, Thompson and Morse 6 , Reference Weser and Sleisenger 11 ), and in 3 h urine samples after 50 g intake( Reference Bezerra, Thompson and Morse 6 ). Stuhlfauth et al. ( Reference Stuhlfauth, Hofmann and Heinz 12 ) estimated that after intake of either 50 g of lactose or 1 l of milk, 1 ‰ of the lactose ingested was excreted intact in urine within 24 h. Menzies( Reference Menzies 13 ) obtained similar results, with lactose excretion in urine ranging from 0·9‰ in lactose tolerant individuals to 2‰ in hypolactasic subjects. The high amounts of lactose used in previous studies (20–50 g intake) as well as in our study (20 g and 40 g in yogurt and milk, respectively) could explain its detection in blood and urine as total lactase activity would be insufficient to hydrolyse such quantities. A passive diffusion through the intestinal intercellular tight junctions is likely to occur at high lactose concentrations, as previously described for glucose and lactulose( Reference Drozdowski and Thomson 1 , Reference Woodfin and Arora 27 ). There is little data reporting on the blood concentrations of lactose observed in adults. However, the concentration of 0·058 mmol/l observed in pregnant women( Reference Hubbard and Brock 5 ) is close to the values observed in the present study (maximum of 0·06 mmol/l).
The postprandial behaviour of galactose illustrates the efficiency with which it is absorbed and metabolised or excreted. In contrast to lactose, intestinal transport of galactose is mediated by hexose transporters, which explains the rapid postprandial increase that we observe in serum. Moreover, absorbed galactose is rapidly metabolised in the liver into glucose-1-phosphate in the Leloir pathway. Therefore, a postprandial increase in systemic galactose can only be observed if its catabolism in the liver is inhibited (as exemplified in the Lactose-Ethanol Load Test)( Reference Woodfin and Arora 27 ) or if the flux of galactose exceeds the capacity for its metabolism. This latter case is observed after large amounts of milk intake as shown by Kaempf et al. ( Reference Kaempf, Li and Groothuis 28 ) in lambs, Siegel et al. ( Reference Siegel, Sparks and Battaglia 29 ) in newborn infants and, in the present study, in adults after yogurt intake and, to a lesser extent, after milk intake (Fig. 1(b)). Compared with galactose, the slower decrease in serum lactose that was observed after three hours reflects the inability of lactose to be catabolised. As lactase is exclusively produced by enterocytes, the clearance of lactose from the blood would rely solely on its urinary excretion. Indeed, it has been observed that after intravenous injection of lactose, 86–94 % was excreted intact in urine within 24 h( Reference Stuhlfauth, Hofmann and Heinz 12 , Reference Siegel, Sparks and Battaglia 29 ).
Our study suggested a variability in the postprandial response to galactose and lactose between the subjects. Genetic testing of lactase persistence (T allele at rs4988235) was performed in order to explain this variability but did not clearly differentiate the responses of lactose and galactose, although there was a trend towards higher levels of serum galactose after milk intake in those individuals who did carry the variant allele. Similarly, the presence of bacterial species in the baseline microbiota was explored as a contributing factor to the differences in the postprandial responses of the saccharides. A positive association between the relative abundance of several species of the Veillonella genus and the postprandial response for lactose after the intake of milk were observed. The Veillonella genus is known to be part of the small intestine microbiota( Reference Zoetendal, Raes and van den Bogert 30 ), it lacks the capacity to metabolise lactose but its ability to use lactate as a substrate has been well described( Reference Seeliger, Janssen and Schink 31 , Reference Janssen 32 ). Its abundance in the microbiota could then be related to the lactose fermentation activity occurring in the small intestine after dairy intake and the release of lactate. Bacteria of this genus have been found at relatively higher abundance in certain cases of inflammatory disease like Crohn’s disease( Reference Shaw, Bertha and Hofmekler 33 ), gum disease( Reference Camelo-Castillo, Novoa and Balsa-Castro 34 ) and obesity-related inflammation( Reference Moreno-Indias, Sanchez-Alcoholado and Garcia-Fuentes 35 ), although the increases in the same species accompanied beneficial modulation in the microbiota after Roux-en-Y gastric surgery( Reference Palleja, Kashani and Allin 36 ). One could hypothesise that this bacteria could affect the integrity of the intestinal gut barrier and thus lead to higher passive transfer of lactose but further study would be required to confirm this.
Strengths, weaknesses and implications of the study
In the context of the widespread consumption of dairy products together with the frequent occurrence of lactose maldigestion even in the absence of the clinical presentation of lactose intolerance, there is a public health interest to understand the metabolic fate of lactose and galactose derived from dairy products in both metabolic phenotypes. Indeed, this could have important implications for understanding the potential consequences of lactose maldigestion and may even support clinical diagnosis. In our study, the use of dairy products reflects the most common dietary exposure to lactose. Fermented dairy products are frequently used as a way to reduce lactose intake while consuming dairy foods and thus provide an interesting low lactose test product. Dairy products such as milk or yogurt have specific digestion kinetics due to the formation of different phases in the stomach (liquid, lipids and precipitated proteins) that influence gastric emptying( Reference Sanggaard, Holst and Rehfeld 37 ). This characteristic is likely to influence the lactose flux across the intestinal barrier and, subsequently, its appearance in systemic circulation. The use of a pure lactose solution in place of the dairy products would also be a useful model to characterise the mechanisms behind lactose intestinal absorption by excluding features of the dairy matrix that influence these dynamics and could be the subject of further research.
The application of an untargeted metabolomics strategy in this study to evaluate the impact of dairy ingestion on the metabolome of human subjects has revealed unexpected presence of intact lactose in the blood and opens new avenues of lactose processing by the organism. Indeed, text book biochemistry dictates that lactose should not enter the circulation, transporters for disaccharides being absent, thus discouraging studies specifically designed to target the measurement of lactose in blood or urine. Another strength of the study is the combined use of genetic information for the subjects as well as for the gut microbial composition enabling a discussion on the mechanistic associations between lactose and galactose in serum and the gut environment. The trends observed in our study suggest that genetic factors and microbiota phenotypes contribute to the variation of the postprandial responses for lactose and galactose following dairy intake.
These associations are not strong and should be considered in the context of the limitations of our study. First, the ethnicity of the subjects participating in the study was not balanced, thirteen subjects being Caucasian and one Black African. The genetics of lactase persistence in Africans is more complex and characterised by several variants( Reference Gomez, Hirbo and Tishkoff 38 ) whose identification was beyond the scope of this report. Although this imbalance has to be taken into account when evaluating the influence of lactase deficiency, the Black African subject was not an outlier regarding his postprandial kinetics. To some extent, our study was limited by the relatively small sample size. Untargeted metabolomics is a recent development in nutritional science and the method for estimating sample size has not yet been firmly established, especially as each measured metabolite would deserve an individual power analysis. Our sample size of fourteen participants was nevertheless sufficient to detect differentially regulated metabolites in serum, including lactose and galactose. A larger study would be necessary to further investigate the factors that contribute to the inter-individual variability and in particular to confirm the trends observed here for lactase deficiency and microbiota composition. Finally, absolute quantification with our GC-MS method could be improved, notably by conducting targeted analytical measurements of these metabolites or by the use of matrix-match calibration curves with the lactose and galactose standards. Further research is warranted to identify the key determinants of lactose metabolism, which could include microbiota composition and function, intestinal endothelial integrity and lactase production.
Conclusions
In summary, we have shown that, despite the absence of an active transport mechanism for lactose, a fraction of intact lactose can still reach systemic circulation. Furthermore, the postprandial behaviour of lactose and galactose suggests a notable inter-individual variability. This variability could be contributed to by the lactase production by enterocytes, the small bowel and enteric microbiota as well as the intestinal wall integrity( Reference Siegel, Sparks and Battaglia 29 , Reference Deng, Misselwitz and Dai 39 ). Measuring systemic lactose could thus contribute to a better understanding of such processes under normal or pathological conditions.
Acknowledgements
The authors gratefully acknowledge Marie-Jeanne Voirol for her help in the clinical study and Charlotte Egger for the biochemical analyses of the dairy products.
This research did not receive any specific grant from funding agencies in the public, commercial, or not-for-profit sectors.
The authors contributed as follows to the manuscript: study concept and design: G. P., K. J. B., N. V., F. P. P., G. V.; preparation of dairy products: G. P. and U. V. A.; acquisition of blood samples and lactase persistence data: K. J. B. and N. V.; acquisition of GC-MS data: C. F.; acquisition of microbiota data: K. J. B.; data analysis: R. B., G. P., K. J. B., L. H. M., G. G. and M. R.; drafting of the manuscript: G. P. and G. V.; critical revision of the manuscript: all authors.
The authors declare that there are no conflicts of interest.
Supplementary Material
For supplementary material/s referred to in this article, please visit https://doi.org/10.1017/S0007114517003245


 Open access