


Childhood undernutrition including stunting, underweight and wasting is highly prevalent in developing countries and is the underlying cause of 35 % of all deaths among children under 5 years of age (under-5s)( 1 ). More than a quarter of all children in developing countries are either underweight or stunted. Countries in South Asia including Bangladesh have the highest prevalence and largest number of malnourished children worldwide( Reference Shekar, Heaver and Lee 2 ). Although the prevalence of undernutrition among under-5s has declined considerably over the past three decades, recent data in Bangladesh show that 16 % of under-5s suffer from wasting, 41 % suffer from stunting and 36 % are underweight( 3 ). Moreover, a recent report ranked Bangladesh as number sixth in terms of the total number of stunted children and number fifth in terms of the total number of wasted children( 4 ). Despite considerable efforts made by the Government of Bangladesh and other local and international nutrition agencies working there to improve child nutrition, undernutrition remains a major public health problem.
Undernutrition in children is a multifactorial condition in that sociodemographic, cultural and environmental factors can greatly influence children’s nutritional status. A number of studies have documented parental education, maternal nutritional status, maternal employment status, exposure to mass media, household socio-economic status, community environment, the number of under-5s in the family, size of the baby at birth, birth order and area of residence as important determinants of child undernutrition in Bangladesh( Reference Mohsena, Mascie-Taylor and Goto 5 – Reference Siddiqi, Haque and Goni 9 ). Studies have consistently reported that children residing in rural areas, belonging to poorer household and whose parents have less formal education are at higher risk of undernutrition( 3 , Reference Siddiqi, Haque and Goni 9 , Reference Das, Hossain and Islam 10 ).
While previous studies have documented well the determinants of undernutrition, only a few have looked at the temporal pattern of undernutrition prevalence in a country. A trend analysis, using data collected for the time period 1990–2005 through the Nutritional Surveillance Project based in rural areas and urban slums in large cities of Bangladesh, found considerable differences in rates of decline of undernutrition prevalence across regions and across socio-economic groups( 11 ). Das et al.( Reference Das, Hossain and Nesa 12 ) reported considerable differences in the rates of decline of undernutrition prevalence across residence, region, age of child and mother’s education using nationally representative data from six surveys conducted during the period 1985 to 2004. Both studies provided evidence that the prevalence of undernutrition is decreasing in particular areas and populations of Bangladesh. However, neither study forecasted the nationwide trend of decrease to ascertain whether Bangladesh is on track to achieve the Millennium Development Goal 1C (MDG1C) target of halving the prevalence of underweight among under-5s by 2015( 13 ).
Recent studies conducted in Bangladesh have reported contradictory statements about whether the country will be able to achieve the MDG1C target. While Ahmed et al. ( Reference Ahmed, Mahfuz and Ireen 14 ) argued that if the current rate of reduction continues the country is unlikely to achieve the target, the most recent Bangladesh Demographic and Health Survey 2011 (BDHS 2011) report( 3 ) states that at the current rate of reduction the target can be achieved. Both studies draw their conclusions based on observed prevalences found in previous BDHS. Moreover, neither study estimated the average annual rate of reduction (AARR) commonly used to track the progress of countries towards achieving the MDG1C of halving the prevalence of underweight in under-5s by 2015( 15 ). For a country like Bangladesh, where more than one-third of children are still underweight( 3 , 15 ), estimates of the AARR are needed to track MDG1C progress and to set up future goals for reducing the prevalence of underweight. It is also important to examine the AARR for the other two undernutrition indicators, stunting and wasting, since they represent different dimensions of undernutrition; namely chronic undernutrition and acute undernutrition, respectively( Reference Chen, Chowdhury and Huffman 16 ).
Bangladesh has a wealth of nationally representative cross-sectional data that are underutilized. In the present study, we aimed to examine whether the reduction of prevalence of undernutrition occurred at a similar rate across socio-economic groups and rural/urban households using the five most recent, nationwide, cross-sectional BDHS data sets from 1996 to 2011. The objective was to estimate the AARR for the three common indicators of undernutrition (stunting, underweight and wasting) and to forecast the prevalence of stunting, underweight and wasting for the year 2015 by selected background characteristics of children, such as gender, area of residence, wealth quintile, maternal education and maternal nutritional status.
Methods
Demographic and Health Surveys
We used nationally representative BDHS data sets to examine trends in undernutrition among under-5s from 1996–1997 to 2011. To date, six Demographic and Health Surveys (DHS) have been conducted in Bangladesh: in 1993–1994, 1996–1997, 1999–2000, 2004, 2007 and 2011. Anthropometric data of children are available for all BDHS except that conducted in 1993–1994. Our study population included 29 930 surviving children whose height and weight were measured in the five surveys conducted between 1996 and 2011. There were 264 (0·88 %) children whose height or age was out of plausible limits and 725 children (2·42 %) had either height or weight out of plausible limits. The final sample included 28 941 children for whom complete anthropometric data were available.
The DHS are cross-sectional and use a two-stage stratified sampling design with stratification done by urban and rural areas within each division of the country( 3 ). At the first stage, primary sampling units defined as census enumeration areas are selected and at the second stage households are randomly selected from these primary sampling units. Within selected households, ever-married women aged 15–49 years are interviewed. Women are asked questions about a range of topics, such as background characteristics (e.g. height, age, education, media exposure, employment, etc.), reproductive history, use and source of family planning method, antenatal and postnatal history, breast-feeding and infant feeding practices, child immunization and child illness, marriage, fertility preferences, husband’s background, awareness of AIDS and other sexually transmitted diseases, knowledge of tuberculosis and domestic violence. The DHS questionnaires and sampling scheme are almost identical at each time point, enabling comparison of indicators over time.
Statistical analysis
We defined undernutrition using three indices: height/length-for-age, weight-for-height/length and weight-for-age. A child was categorized as stunted if his/her height/length-for-age was more than −2 sd below the median height/length-for-age of the WHO reference population (height/length-for-age Z-score (HAZ) <–2). A child was categorized as underweight or wasted if his/her weight-for-age or weight-for-height/length was more than −2 sd below the median weight-for-age or weight-for-height/length of the WHO reference population, respectively (weight-for-age Z-score (WAZ) <–2 or weight-for-height/length Z-score (WHZ) <–2, respectively)( 17 ). The prevalence of stunting, underweight and wasting was estimated using the WHO 2006 child growth standards( 18 ). This allowed us to compare estimates across survey years. We used line charts to summarize overall trends in prevalence of undernutrition. To examine differences in rates of decline by background characteristics of children, we utilized six variables. These were: sex of the child, maternal education, maternal nutritional status, area of residence, division and household wealth quintile. Maternal education was divided into three categories: no formal education, primary education and secondary education or higher. Maternal nutritional status was measured using BMI categorized into three groups: underweight (BMI<18·5 kg/m2), normal weight (18·5≤BMI<25·0 kg/m2) and overweight (BMI≥25·0 kg/m2)( 19 ). We excluded information of 1763 mothers who were pregnant at the time of the surveys or whose height or weight was out of plausible limits or missing. Finally, household wealth index was classed into quintiles: poorest, poor, middle, rich and richest. All prevalence estimates are calculated based on the DHS design.
We calculated and compared AARR of prevalence of undernutrition assuming the change of prevalence as an exponential function. This approach has been used by UNICEF to monitor global trends in prevalence of underweight( 15 ). The methodological details of calculating AARR have been described in a technical note by UNICEF( 20 ). If the prevalence Y t is known for any given year t and the annual rate of reduction is b %, then the prevalence Y t+n for any later year t+n can be calculated as:
 $$Y_{{t{\plus}n}} =Y_{t} (1{\minus}b{\rm }\,\%\,)^{n} .$$
We used the median date of fieldwork as the standard time point to calculate the time between surveys. For example, 15 January 1997 was the median date of fieldwork for the first DHS round (BDHS 1996–1997) and 31 January 2000 was the median date for the second DHS round (BDHS 1999–2000). The duration between the two surveys was therefore calculated as 3·04 years. Gaps were calculated for all surveys and used to estimate AARR of prevalence of undernutrition for different time periods. To obtain the overall AARR for the period 1996 and 2011 we first estimated ln(1−b%) for different time periods; then we took the arithmetic mean of these ln(1−b%) values and finally back-transformed the mean to b %. This overall ARRR was later used to project the prevalence of undernutrition for the year 2015. For the projection, Y t in equation (1) was considered the baseline prevalence in 2011 and Y t+n the projected prevalence in 2015. The overall AARR was assumed to be constant for the period 2011 to 2015.
Results
General trends in prevalence of undernutrition
Table 1 shows the descriptive statistics for age, height, weight, HAZ, WAZ and WHZ of the 28 941 children used in the analysis. The mean height and weight of children were 81·6 cm and 10·1 kg, respectively. The trends suggest that mean height and weight of children have increased consistently since 1996. The mean HAZ increased from −2·3 in 1996–1997 to −1·7 in 2011, whereas the mean WAZ increased from −2·0 in 1996–1997 to −1·6 in 2011.
Table 1 Age, weight, height and anthropometric indicators (means and standard deviations) of children under 5 years of age (n 28 941): Bangladesh Demographic and Health Surveys (BDHS) 1996–1997, 1999–2000, 2004, 2007 and 2011
HAZ, height/length-for-age Z-score; WAZ, weight-for-age Z-score; WHZ, weight-for-height/length Z-score.
Figure 1 shows the general trends in prevalence of stunting, underweight and wasting among under-5s. It is clear that the prevalence of stunting has been decreasing steadily in the past 15 years. However, the prevalence of underweight and wasting did not follow a particular pattern. Overall, the prevalence of stunting declined from 60·0 % in 1996–1997 to 41·2 % in 2011, and was stable in the 1999–2000 and 2004 surveys. On the other hand, the prevalence of underweight declined from 52·2 % in 1996–1997 to 36·2 % in 2011 but was stable between 1999–2000 and 2007. Overall, the highest decrease in prevalence of undernutrition occurred during the period from 1996–1997 to 1999–2000.
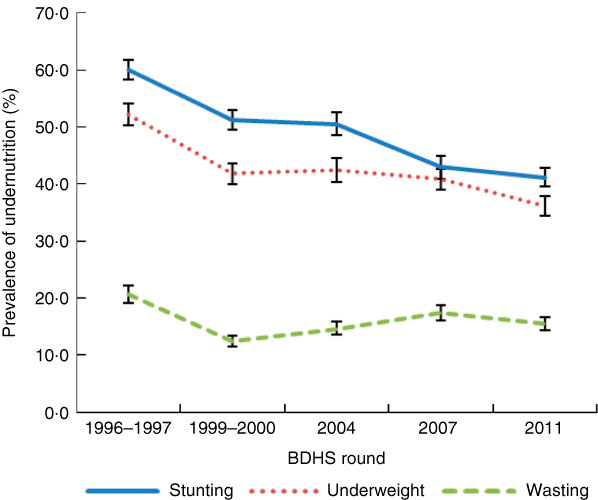
Fig. 1 (colour online) Trends in weighted prevalence of undernutrition (stunting, underweight and wasting) among children under 5 years of age (n 28941) at national level: Bangladesh Demographic and Health Surveys (BDHS) 1996–1997, 1999–2000, 2004, 2007 and 2011. Values are means with their 95% confidence interval represented by vertical bars
Trends in prevalence of undernutrition by selected background characteristics of children
Table 2 shows the trends in prevalence of stunting, underweight and wasting according to selected background characteristics of the children. The prevalence was higher among children living in rural areas and among children belonging to poor households in all surveys. The prevalence of stunting was higher among male children compared with female children, but the prevalence of underweight was higher among female children than male children, in four of the five surveys. In all surveys, the prevalence of stunting was higher among children belonging to poor households. Children of underweight mothers (BMI<18·5 kg/m2) were more likely to be stunted, underweight and wasted in all the surveys compared with their counterparts.
Table 2 Trends in weighted prevalence of stunting, underweight and wasting by selected background characteristics of children under 5 years of age (n 28 941): Bangladesh Demographic and Health Surveys (BDHS) 1996–1997, 1999–2000, 2004, 2007 and 2011
Average annual rates of reduction of undernutrition prevalence by selected background characteristics of children
Table 3 shows the estimated AARR of prevalence of undernutrition for the past 15 years. It shows that the overall national AARR for the period 1996 to 2011 were 2·84 %, 2·69 % and 2·47 %, respectively, for stunting, underweight and wasting. The overall AARR for stunting, underweight and wasting were higher for male children, for children living in rural areas and children belonging to richer households. The overall ARRR of stunting was higher for Rajshahi division and the overall AARR of underweight was higher for Khulna division.
Table 3 Average annual rate of reduction (AAAR) of prevalence of stunting, underweight and wasting by selected background characteristics of children under 5 years of age (n 28 941), Bangladesh, 1996 to 2011
* AARR for the period 1996–1997 to 1999–2000.
† AARR for the period 1999–2000 to 2004.
‡ AARR for the period 2004 to 2007.
§ AARR for the period 2007 to 2011.
|| Overall AARR for the period 1996–1997 to 2011.
Projected prevalence of undernutrition for 2015
Table 4 shows the projected prevalence of stunting, underweight and wasting for 2015 by selected background characteristics of the children. It shows that if the overall AARR continue, a further minor improvement in reduction of malnutrition is likely. The prevalence of underweight is predicted to be 32·5 %, while the prevalences of stunting and wasting are predicted to be 36·7 % and 14·0 %, respectively, in 2015 at the national level. Future prevalence rates are expected to vary across geographic regions and socio-economic groups. The prevalences of stunting, underweight and wasting are forecasted to remain high in rural areas, in Sylhet division and in the poorest wealth quintile.
Table 4 Projected prevalence of stunting, underweight and wasting for 2015 by selected background characteristics of children under 5 years of age (n 28 941), Bangladesh
Discussion
The results of the present study indicate that undernutrition in under-5s has improved from 1996 to 2011 in Bangladesh. However, the mean HAZ and WAZ (−1·7 and −1·6, respectively, in 2011 and −2·3 and −2·0, respectively, in 1996) remain low compared with other developing countries. A recent systematic analysis of population-based studies in 141 developing countries reported mean HAZ and WAZ as −1·16 and −0·84, respectively, among under-5s( Reference Stevens, Finucane and Paciorek 21 ).
Our estimates suggest that the prevalence of stunting decreased by 18·8 % (from 60·0 % to 41·2 %), underweight by 16·0 % (from 52·2 % to 36·2 %) and wasting by 5·1 % (from 20·6 % to 15·5 %) during the period 1996 to 2011. The reduction in prevalence of stunting was somewhat higher compared with that for prevalence of underweight. However, we noted that the prevalence of stunting is still very high, 41·2 % at the national level in 2011. Recent studies have indicated that stunting is a better indicator of nutritional deficiencies than underweight( 15 , Reference Fanzo and Pronyk 22 , Reference Black, Allen and Bhutta 23 ) and Bangladesh has a very high prevalence of stunting( 4 ). This indicates the need for urgent action to address this issue.
The overall AARR results suggest that the prevalence of stunting and underweight decreased faster (2·84 % per year and 2·69 % per year, respectively) than the prevalence of wasting (2·47 % per year) during the period 1996 to 2011. The AARR of all three indicators of undernutrition (stunting, underweight and wasting) was much greater during the period 1996 to 2000 compared with other periods. For example, the AARR for stunting was 5·08 % per year during 1996 to 2000 compared with 0·33 % per year during the period 2000 to 2004. While we were not able to ascertain the determinants of this difference, studies have indicated that the sharp decline in the prevalence of undernutrition in the late 1990s may have been associated with improvement in maternal education and wealth, reduction in fertility, measles immunization and rural electrification( Reference Ahmed, Mahfuz and Ireen 14 , Reference White 24 ).
Our estimate of the AARR for the prevalence of underweight (2·69 % per year) differs from that put forward by UNICEF, which reported an AARR of 2·3 % per year for Bangladesh( 15 ). A possible reason could be the use of different data sets and time periods. In the UNICEF study the main data sources were DHS, Multiple Indicator Cluster Surveys and other national household surveys for around the period 1990–2008, whereas our data sets were five DHS rounds conducted during the period 1996–2011. The study by UNICEF also reported the AARR for prevalence of underweight in South Asia. The AARR reported for Bangladesh was greater than that for India, Nepal and Pakistan and lower than that for Afghanistan, Bhutan, Maldives and Sri Lanka.
Our results also show that despite the reduction of undernutrition observed in rural areas the prevalence remains higher in rural areas compared with urban areas, in line with previous studies( Reference Siddiqi, Haque and Goni 9 , Reference Das, Hossain and Nesa 12 ). This finding reinforces the need to prioritize nutrition intervention programmes to rural areas especially among the rural poor households. Regarding reduction of undernutrition by geographical area, our findings suggest that the situation in Khulna division and Rajshahi division is improving but that in Sylhet division is doing worse. A possible reason for the relatively poor performance of Sylhet division might be because it is an area with poor measles vaccine coverage compared with others in the country( 3 , 25 , 26 ). Studies have reported that children who receive measles vaccine are less likely to be malnourished( Reference Rahman and Chowdhury 7 , Reference Ahmed, Ahmed and Roy 27 ). In addition, appropriate child feeding practices according to the Infant and Young Child Feeding standard is low in Sylhet division compared with other divisions in the country( 3 ). Moreover, the proportion of children consuming foods high in vitamin A is lowest in Sylhet division compared with other divisions( 3 , 26 ).
Our findings also indicate that the decline in the prevalence of undernutrition varies according to wealth status of the household. In the past 15 years, the proportion of underweight and wasted children has reduced greatly in the wealthiest quintile. Previous studies have shown that, on average, the prevalence of severe stunting was three times higher among children of the poorest households compared with children of wealthier households( Reference Gwatkin, Rutstein and Johnson 28 ). Research findings from Bangladesh also suggest that the likelihood of a child being malnourished decreases with the improvement of household wealth status( Reference Siddiqi, Haque and Goni 9 , Reference Das, Hossain and Islam 10 ). More importantly, we forecast that in 2015 more than half of the children from the poorest quintile will be stunted. This finding indicates that poverty remains a major determinant for reduction of undernutrition at the household level. Undernutrition interventions, such as the Vulnerable Group Feeding and Food-for-Work programmes, have had significant impacts on reducing child malnutrition among the poorest quintile but our results show that further improvements are needed( Reference Deolalikar 29 ).
Finally, our estimates of projected prevalence of underweight show that, if the present overall AARR continues to be observed in the future, Bangladesh is likely to achieve the MDG1C target of reducing the prevalence of underweight to 33 % at the national level by 2015. The projected estimate for stunting, however, is 36·7 % for 2015, which is still very high. Consequently, efforts should focus not only on reducing underweight but also on reducing stunting, which can lead to poor growth and other adverse health outcomes( Reference Dewey and Begum 30 ).
Acknowledgements
Acknowledgments: The authors wish to thank MEASURE DHS for granting permission to use the BDHS data. Financial support: This research received no specific grant from any funding agency in the public, commercial or not-for-profit sectors. M.T.H is supported by an International Postgraduate Research Scholarship from the University of Queensland (#43054112). Conflict of interest: None. Authorship: M.T.H. and A.A.M. conceived the study. M.T.H. performed data analysis and wrote the first draft. A.A.M. and R.J.S.M. contributed to data interpretation and preparation of the manuscript. G.M.W. edited and provided important intellectual feedback. Ethics of human subject participation: This study used publicly available secondary data sets from the BDHS conducted in 1996–1997, 1999–2000, 2004, 2007 and 2011. Ethical approval was not required.


