


Beverage consumption is a significant contributor to daily energy intake, but is often overlooked as a component of dietary intake by individuals( 1 ). Hydration and fluid intake are fundamental to daily living and health, and contribute to physiological homeostasis( 2 ). The United Nations has estimated that every person drinks 2–4 litres of water per day( 3 ). A global systematic review of fluid intake from beverages across age groups reported that total beverage intake was in the range of 0·6–1·8, 0·8–2·0 and 0·8–3·4 litres per day for children, teenagers and adults, and water consumption accounted for 58, 75 and 80 % of total fluid intake, respectively( Reference Ozen, Bibiloni and Pons 4 ). Singh et al. reported that average global daily intakes of sugar-sweetened beverages (SSB), fruit juice and milk in adults were 132, 36 and 130 ml, respectively, in 2010( Reference Singh, Micha and Khatibzadeh 5 ).
Dietary intake and nutrition are strong determinants of health and chronic non-communicable diseases throughout life( 6 ). It has been estimated that by 2030, 69 % of all deaths worldwide will be attributable to non-communicable diseases( Reference Mathers and Loncar 7 ). An increase in the prevalence of adult diseases such as obesity, type 2 diabetes, CVD, metabolic syndrome and fatty liver disease has been reported among adolescents( Reference Goran, Ball and Cruz 8 – Reference Perrin, Bloom and Gortmaker 11 ), hence this age group is under scrutiny in terms of dietary intake.
Sugar intake, including intake from SSB, has come under the spotlight in recent years with revised intake recommendations from expert bodies such as the WHO and the UK Scientific Advisory Committee on Nutrition( 12 , 13 ). A number of studies and meta-analyses have found a positive association between SSB consumption and weight, as is concluded by the Committee in its Carbohydrates and Health report( 13 – Reference Ebbeling, Feldman and Chomitz 19 ). Substantial evidence indicates that SSB have a low satiating effect, leading to greater energy intake than required( Reference Te Morenga, Howatson and Jones 15 , Reference DiMeglio and Mattes 20 , Reference van Dam and Seidell 21 ). The Scientific Advisory Committee on Nutrition report further acknowledged an increased risk of tooth decay and type 2 diabetes with increased SSB consumption, and recommended that consumption of SSB is minimised in both children and adults( 13 ). Singh et al. estimated that 184 000 adult deaths worldwide in 2010 were attributable to SSB alone( Reference Singh, Micha and Khatibzadeh 22 ). However, a recent review has reported an overall decrease or stabilisation in sugar intake in developed countries( Reference Wittekind and Walton 23 ).
Food and beverage choices result from a variety of determinants( 24 ). Influences include biological factors, socio-economic factors, psychological factors and external factors such as marketing. Beverage consumption and beverage choice are also strongly related to age and sex( Reference Forshee and Storey 25 ). Knowledge about sugars in beverages is an important factor influencing beverage consumption in adults( Reference Rampersaud, Kim and Gao 26 ). However, parental influence and home environments have been shown to play more of a central role in beverage choice in adolescents and children( Reference Grimm, Harnack and Story 27 , Reference Sutherland, Beavers and Kupper 28 ).
The National Teens’ Food Survey (NTFS), conducted in 2005–2006, was the last study to collect information on adolescent beverage consumption in the Republic of Ireland( 29 ). It was a comprehensive study to collect information primarily on dietary intake in order to develop nutrition policies and health promotion campaigns. The NTFS reported water, milk and carbonated beverages as the three most highly consumed beverages. The present pilot study in 2014–2015 aimed to obtain up-to-date cross-sectional information on habitual non-alcoholic beverage consumption among a sample of 12–18-year-olds.
The Department of Education and Skills in Ireland addresses educational disadvantage in disadvantaged communities through implementing an action plan called ‘DEIS’ (Delivering Equality of Opportunity in Schools). This programme is designed to provide a number of supports such as a School Meals Programme or School Books Grant Scheme. The current study included adolescents from two DEIS schools and two fee-paying schools in urban and rural Ireland in order to reveal any differences by school type. This is important in the context of research that has reported widening health inequalities among adolescents in Ireland( Reference Elgar, Pfortner and Moor 30 , Reference Heinen, Murrin and Daly 31 ). A further aim of the present research was to gain insight into some of the influences on adolescent beverage consumption.
Methods
Sampling
Between November 2014 and May 2015, teenagers aged 12–18 years from four post-primary schools in the Republic of Ireland were invited to take part in the study. Schools were selected from a database of post-primary schools available from the Department of Education and Skills in Ireland. A convenience sample of four mixed-sex schools was selected to represent the following categories: urban fee-paying, urban DEIS, rural fee-paying and rural DEIS. The four schools invited participated in the study. A power calculation was not performed due to the pilot nature of the study. The study was approved by the Human Research Ethics Committee of University College Dublin and written informed consent was obtained from participating adolescents and their parents.
Respondent recruitment
An introductory letter and information about the questionnaire were sent to the principal of each of the four schools that agreed to participate in the questionnaire. Researchers met with an assigned teacher from each school to help coordinate the study. An information pack, which included an information letter and parental/guardian consent form, was distributed to students within each school. Students aged 12–18 years who returned signed parental/guardian consent forms were eligible for the study.
Questionnaire design
An anonymous and self-administered questionnaire was designed for the present study. The questionnaire was divided into three sections. The first section was designed to obtain information on the age and sex of the student. The second section was designed to determine frequency of beverage consumption and usual serving sizes. Beverage categories included were modelled on those used in previous studies such as Food4Me( Reference Celis-Morales, Livingstone and Marsaux 32 ), the European Prospective Investigation into Cancer and Nutrition( Reference Riboli, Hunt and Slimani 33 ) and the Irish Universities Nutrition Alliance studies( 29 , 34 – 36 ). In addition, for the current study beverage categories were expanded to reflect the current Irish market. Table 1 lists all beverage categories used within the study. Ten frequency options for beverage consumption were given, ranging from ‘never’ to ‘>6 times per day’. Serving sizes were based on household measures and supermarket products. Photographs of serving sizes were provided within the questionnaire for students to aid estimation of intake. The third section of the questionnaire concerned the existence of parental rules surrounding non-alcoholic beverages (yes/no), frequency of purchasing beverages during school breaks (‘every day’, ‘3–4 times per week’, ‘1–2 times per week’, ‘less than once per week’, ‘never’), home availability of beverage categories (‘never’, ‘sometimes’, ‘usually’, ‘always’) and perception of the best way to learn about healthy drinks (advertisements on television/radio, posters in school, parents/guardians, teachers, friends, Facebook and other social media, a health professional: ‘strongly disagree’, ‘disagree’, ‘neither disagree or agree’, ‘agree’, ‘strongly agree’). Participating schools were requested to provide information about their policies or rules surrounding the sale and consumption of beverages on school premises, and lunchtime policies.
Table 1 Beverage consumption categories and sub-categories within the present questionnaireFootnote †

† Categories were based on those use in previous national and European research projects and expanded to reflect the current Irish market: Food4Me( Reference Celis-Morales, Livingstone and Marsaux 32 ), the European Prospective Investigation into Cancer and Nutrition( Reference Riboli, Hunt and Slimani 33 ) and the Irish Universities Nutrition Alliance studies( 29 , 34 – 36 ).
‡ Refers to both diet and non-diet versions of energy drinks.
Data collection and data management
The questionnaire was piloted on a sample of adolescents aged 12–18 years old, independent of the schools included in the study sample, to identify any issues or misinterpretations of the questions. The questionnaires were completed under supervision of school teachers in a classroom setting. To ensure anonymity and encourage honesty the students had no contact with the researchers. Questionnaire sections that had been fully completed (91 %) were included in the final analysis to ensure data quality and consistency in reporting.
A standard operating procedure was adhered to for data entry for all responses, including ambiguous responses (e.g. if two answers were provided where only one was required). Questionnaire data were hand entered into a database using a data dictionary. For quality control purposes, half of the paper questionnaires were checked by an additional nutrition researcher.
Statistical analyses
Consumption was calculated from indicated frequency per day and corresponding serving size (millilitres) for each beverage. The middle value for the indicated frequency category was taken; for example, where a student indicated s/he consumed a beverage 2–4 times per month, this was taken as 3 times per month. The categories ‘<1 time per month’ was taken as ‘0·5 times per month’ and the category ‘>6 times per day’ was taken as ‘7 times per day’.
Data were not normally distributed, thus a non-parametric Kruskal–Wallis test was used to compare the consumption distribution for each beverage across the four schools. Where the overall test was significant, pairwise comparisons were used to identify which schools differed. P values were adjusted to control the family-wise type 1 error. For four tests, this resulted in a multiplier of (4×3)/2=6. Adjusted P values are significant at P adj<0·05 (at the α=0·05/6=0·00833 level). The distribution of the home availability of the different categories was compared across schools using a χ 2 test for each beverage. The χ 2 test was also used to compare the distributions of categories concerning the best way to learn about healthy drinks and parental rules regarding beverages. A Kruskal–Wallis test was used to assess beverage consumption across groups organised by beverage purchasing frequency. Statistical analyses were performed using the statistical software package IBM SPSS Statistics for Windows Version 20.0.
Results
Beverage consumption
Sample characteristics and response rates are presented in Table 2. The overall response rate was 82·5 %. The following beverage categories were included in the analyses: diet, zero- or low-calorie versions of carbonated beverages (hereafter referred to as ‘diet carbonated beverages’); carbonated beverages; energy drinks; water; flavoured water; fruit juice; smoothies; fruit squash; tea; milk; hot chocolate; and milkshakes. Coconut water, vitamin water, slushies, vegetable juice, coffee, decaffeinated coffee, iced tea or coffee, herbal tea, flavoured milk, Horlicks/Ovaltine and yoghurt drinks were reported with a median frequency of consumption of ‘never’ by the total population, and thus were excluded from the main analyses.
Table 2 Characteristics of adolescents (n 761) aged 12–18 years from four post-primary schools in the Republic of Ireland, 2014–2015.
† DEIS (Delivering Equality of Opportunity in Schools) designates a school within a disadvantaged community.
Table 3 presents the median, lower quartile and upper quartile of beverage consumption (ml/d) for the total sample population. Water (1425 ml/d), tea (129 ml/d) and fruit juice (86 ml/d) were the top three most consumed drinks. These were followed by milk (42 ml/d) and carbonated beverages (39 ml/d), while all other categories were reported at <15 ml/d. A number of weak associations of beverage consumption with age were reported (Table 3). Diet carbonated beverage, flavoured water, hot chocolate and milkshake consumption all decreased with increasing age (P<0·05), while water was the only beverage to increase with age (P<0·01). Significant differences in beverage consumption were also reported by sex (Table 3). Carbonated beverages and energy drinks were consumed significantly more by males than females (P<0·001), while smoothies were consumed significantly more by females than males (P<0·01). Milk was consumed more by males (P<0·001); however, females reported higher consumption of hot chocolate (P<0·05).
Table 3 Reported median, lower quartile (LQ) and upper quartile (UQ) consumption (ml/d) of beverage categories by adolescents (n 761) aged 12–18 years from four post-primary schools in the Republic of Ireland, 2014–2015, presented as total and by sex. Age correlation coefficients and significant differences in consumption between sexes are also presented.
*Correlation is significant at the 0·05 level (two-tailed).
**Correlation is significant at the 0·01 level (two-tailed).
† Spearman’s correlations.
‡ P value presented is for the Mann–Whitney test for a difference in distribution in beverage consumption across sex.
§ Diet, zero- or low-calorie versions of carbonated beverages.
|| Refers to both diet and non-diet versions of energy drinks.
Table 4 presents the median, lower quartile and upper quartile of beverage consumption (ml/d) across the four schools, and the significant differences between them. In all four schools the highest consumption was reported for water. Urban fee-paying school students reported the highest median consumption of water (1875 ml/d), significantly more than urban DEIS and rural fee-paying school students (P<0·01). Flavoured water consumption significantly differed between the four schools with the highest median consumption (35 ml/d) reported by urban DEIS school students (P<0·001). Urban DEIS school students reported a significantly higher consumption of diet carbonated beverages, carbonated beverages and energy drinks (median 46·2, 163·4 and 70 ml/d, respectively; P<0·001) compared with all other schools. Rural DEIS school students reported a significantly lower consumption of fruit juice (39·9 ml/d) compared with the other schools (P<0·001), but reported the highest consumption of fruit squash. Rural DEIS school students were the biggest consumers of tea and milk (median 237 and 86 ml/d, respectively), with a significantly higher amount (P≤0·001) than urban fee-paying school students who consumed the least amount of tea and milk overall (median 21 and 14 ml/d, respectively).
Table 4 Reported median, lower quartile (LQ) and upper quartile (UQ) consumption (ml/d) of beverage categories by adolescents (n 761) aged 12–18 years from four post-primary schools in the Republic of Ireland, 2014–2015, and significant differences in consumption between the schools.
a,b,cMedian values within a row with unlike superscript letters were significantly different at P adj<0·05 (at the α=0·05/6=0·00833 level).
† DEIS (Delivering Equality of Opportunity in Schools) designates a school within a disadvantaged community.
‡ P value presented is for the Kruskal–Wallis test for a difference in beverage consumption distribution among the four schools.
§ Diet, zero- or low-calorie versions of carbonated beverages.
|| Refers to both diet and non-diet versions of energy drinks.
Influences
Overall, 26·5 % of students reported that their parents had rules regarding non-alcoholic beverage consumption. Those who reported their parents/guardians as having rules consumed significantly less carbonated beverages and energy drinks than those who did not have rules (P<0·001; Table 5).
Table 5 Median consumption (ml/d) of carbonated, diet carbonated and energy drinks by adolescents (n 761) aged 12–18 years from four post-primary schools in the Republic of Ireland, 2014–2015, according to report of their parents/guardians having rules surrounding non-alcoholic beverages.
† P value presented is for the Kruskal–Wallis test for a difference in beverage consumption according to the presence/absence of rules. The responses to whether parents/guardians had rules surrounding beverages (yes/no) were also compared across schools using a χ 2 test. Fee-paying school students reported a significantly higher proportion of ‘yes’ responses than DEISFootnote || school students (P<0·008).
‡ Diet, zero- or low-calorie versions of carbonated beverages.
§ Refers to both diet and non-diet versions of energy drinks.
|| DEIS (Delivering Equality of Opportunity in Schools) designates a school within a disadvantaged community.
Only students from the urban DEIS school were allowed outside the school premises during school breaks. Almost 55 % of these students reported that they go to a shop at break times and purchase beverages at least once per week, while 33·7 % never purchased beverages or do not have permission. As expected, consumption of carbonated beverages and energy drinks differed significantly across purchasing frequency groups (P<0·001). For example, an almost threefold increase in carbonated beverage consumption was reported between those who reported never purchasing beverages and those who reported purchasing beverages every day.
Water, tea/coffee and milk were reported as the three most commonly available beverages at home. Across the schools, significant differences were reported for carbonated beverage home availability (P<0·001; Fig. 1). Carbonated beverages were reported as sometimes or always available at home by 75·8 % of urban DEIS school students, 29·3 % of urban fee-paying school students, 50·0 % of rural DEIS students and 35·0 % of rural fee-paying students. A similar trend was reported with diet carbonated beverages (P<0·01). Yoghurt or probiotic drink availability was significantly different across the schools (P<0·001), reported as always available by 32·3 % of urban DEIS students, 13·8 % of urban fee-paying students, 20·2 % of rural DEIS students and 19·0 % of rural fee-paying students.
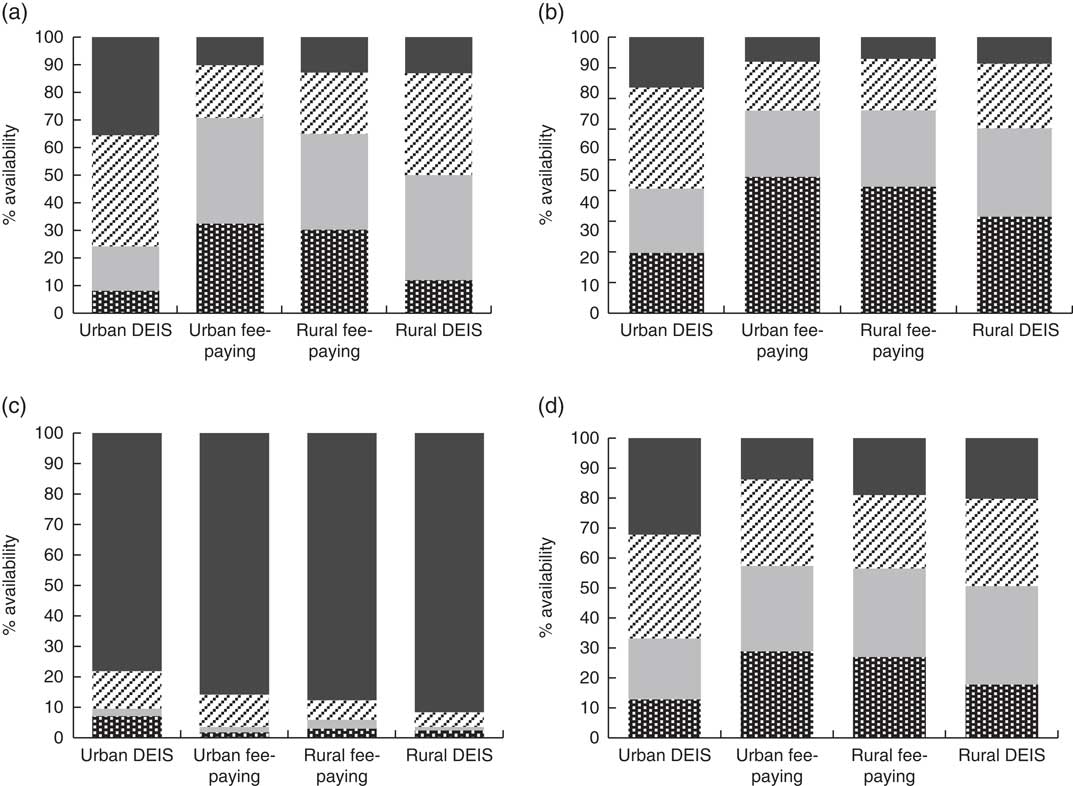
Fig. 1 The reported percentage availability (![]() , always available;
, always available; ![]() , sometimes available;
, sometimes available; ![]() , not usually available;
, not usually available; ![]() , never available) of (a) carbonated beverages, (b) diet, zero- or low-calorie versions of carbonated beverages, (c) tea and coffee, and (d) yoghurt and probiotic drinks within the home setting by adolescents (n 761) aged 12–18 years from four post-primary school types in the Republic of Ireland, 2014–2015. The distribution of the home availability categories was compared across schools using a χ
2 test for each beverage; all beverages were significantly different at P
adj<0·05 (at the α=0·05/6=0·00833 level; DEIS (Delivering Equality of Opportunity in Schools) designates a school within a disadvantaged community)
, never available) of (a) carbonated beverages, (b) diet, zero- or low-calorie versions of carbonated beverages, (c) tea and coffee, and (d) yoghurt and probiotic drinks within the home setting by adolescents (n 761) aged 12–18 years from four post-primary school types in the Republic of Ireland, 2014–2015. The distribution of the home availability categories was compared across schools using a χ
2 test for each beverage; all beverages were significantly different at P
adj<0·05 (at the α=0·05/6=0·00833 level; DEIS (Delivering Equality of Opportunity in Schools) designates a school within a disadvantaged community)
‘Health professionals’ was the most popular option selected by students when asked about the best way to learn about healthy drinks (66 % agreed or strongly agreed), while advertisements on television/radio and posters in school were the least popular options chosen by students (Fig. 2). Overall, 39·0 % of students agreed or strongly agreed that the best way to learn about healthy drinks was through friends. However, significantly fewer students (33·4 %) from the urban DEIS school agreed with this option (P<0·05) compared with the other schools (44·0, 46·0 and 40·6 % for urban fee-paying, rural fee-paying and rural DEIS schools, respectively).
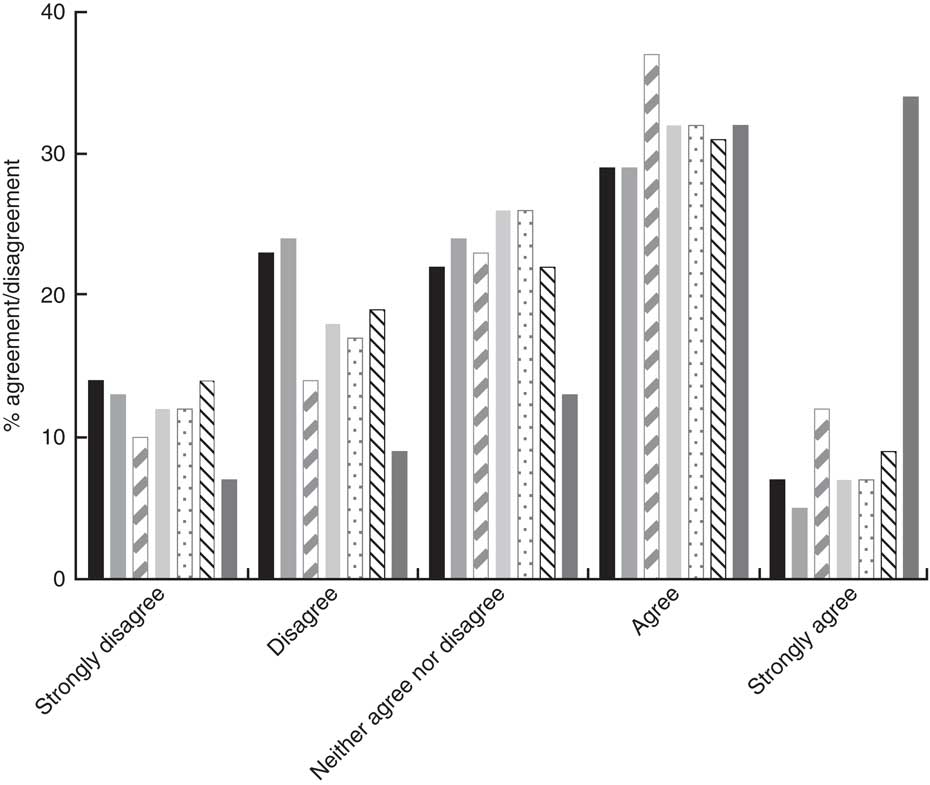
Fig. 2 The percentage of agreement and disagreement by adolescents (n 761) aged 12–18 years from four post-primary schools in the Republic of Ireland, 2014–2015, with the following options as being the best source to learn about healthy beverages: advertisements on television/radio (![]() ), posters in school (
), posters in school (![]() ), parents/guardians (
), parents/guardians (![]() ), teachers (
), teachers (![]() ), friends (
), friends (![]() ), social media (
), social media (![]() ) and health professionals (
) and health professionals (![]() )
)
Discussion
In the current study, adolescents from four post-primary schools in the Republic of Ireland reported water (1425 ml/d), tea (129 ml/d) and fruit juice (86 ml/d) as the top three most consumed beverages. This is in contrast to the data reported in the NTFS 2005–2006, where water (317 ml/d), tea (31 ml/d) and fruit juice (43 ml/d) were reported as the first, fifth and fourth most consumed beverages, respectively( 29 ). Carbonated beverages were reported as the third most highly consumed beverage in the NTFS (129 ml/d)( 29 ). Consumption of carbonated beverages was relatively low in the current study (fifth most highly consumed, median consumption 39 ml/d) compared with the NTFS( 29 ). The present study’s questionnaire was conducted between November and May; therefore seasonality may have had an effect on beverage consumption estimates. A trend of increased milk consumption in winter and increased juice consumption in summer has been observed( Reference Kim and Lee 37 ).
Carbonated beverage, energy drink and milk consumption was reported higher in males than females. These findings are similar to those from the NTFS in which carbonated beverage and milk consumption was reported as higher in males than in females( 29 ). Carbonated beverage consumption is also widely reported in other literature as higher in males than females( Reference Currie, Zanotti and Morgan 38 – Reference Forshee and Storey 40 ). Diet carbonated beverage, flavoured water, hot chocolate and milkshake consumption decreased significantly with increasing age, whereas water consumption increased. Nutritionists and other health-care and policy workers may need to consider age and sex influences in order to elicit an effective campaign on promoting healthy beverage consumption.
It was recently demonstrated that the health inequalities are widening among adolescents in a number of countries, including Ireland( Reference Elgar, Pfortner and Moor 30 ). Heinen et al. demonstrated a stabilisation or reduction in the prevalence of overweight and obesity among children in Ireland from 2008 to 2012( Reference Heinen, Murrin and Daly 31 ). However, this trend was not seen among children attending DEIS schools( Reference Heinen, Murrin and Daly 31 ). In the present study, students in the DEIS schools (rural and urban) consumed higher amounts of carbonated beverages, diet carbonated beverages and energy drinks than students from fee-paying schools (rural and urban). Water consumption was highest among fee-paying school students (rural and urban). While these findings align with literature reports that adolescents of parents with low occupation status have a higher intake of carbonated beverages than those with parents of a higher occupation status( Reference Vereecken, Inchley and Subramanian 41 ), milk consumption was lowest among urban fee-paying school students and highest among rural DEIS school students. This finding conflicts with a meta-analysis of eighty-eight studies which reported decreased milk intake with increased SSB consumption( Reference Vartanian, Schwartz and Brownell 16 ). Perhaps the different outcome reported here might be due to varying perceptions about the health properties of milk or a trend change since the meta-analysis was published in 2007( Reference Bus and Worsley 42 ).
School policies can help to prevent childhood obesity and can influence students’ attitudes towards nutrition( Reference Carter 43 ). The four schools in the current study stated that they discouraged students from bringing in carbonated beverages and restricted sales on the school premises. Neither rural schools nor the urban fee-paying school permitted students to leave the premises at lunchtime. However, at the particular urban DEIS school, students were required to leave the school premises during lunch break, leaving ample opportunity to visit local shops where they could obtain carbonated beverages. This policy may account for the relatively higher consumption of carbonated beverages by urban DEIS school students than fee-paying students, as 54·6 % of urban DEIS students purchased beverages outside the school premises at least once weekly at break times.
Family habits and parenting style have been linked previously with carbonated beverage consumption in adolescents( Reference Vågstrand, Linné and Karlsson 44 , Reference van der Horst, Kremers and Ferreira 45 ). Findings from the present study also indicate that parental rules may be an important factor contributing to beverage consumption. Students who reported presence of parental rules about non-alcoholic beverages also reported lower consumption of carbonated beverages and energy drinks compared with those who reported no parental rules. Home availability has also previously been associated with carbonated beverage consumption in adolescents( Reference Grimm, Harnack and Story 27 , Reference Verzeletti, Maes and Santinello 46 , Reference Rey-López, Vicente-Rodríguez and Répásy 47 ). The current study confirms these findings because when home availability was higher, so was reported consumption. The home environment has been suggested as a suitable setting for interventions that aim to reduce socio-economic inequalities in SSB consumption( Reference van Ansem, van Lenthe and Schrijvers 48 ).
An important preliminary finding from the present study in terms of campaign tactics is that students chose health professionals and parents/guardians as the best way to learn about healthy drinks. This is similar to findings from other research undertaken in Ireland which showed that schools, doctors and dentists were key informants regarding nutrition information( 1 ). The findings from the current analysis indicate that future approaches should incorporate health professionals and families in campaigns in order to relate best to adolescents.
There is a lack of validated beverage consumption assessment methods available for administration to 12–18-year-olds from different ethnic/cultural origins( Reference Rockett, Berkey and Colditz 49 , Reference Lambert, Agostoni and Elmadfa 50 ). Our questionnaire was therefore designed to incorporate many beverage types to accurately reflect the current Irish market. One of the limitations of the present study is the use of self-reported data from adolescents. Misreporting is a major problem in dietary assessment among adolescents, mostly through under-reporting, and data should be interpreted with caution( Reference Livingstone, Robson and Wallace 51 ). In order to minimise misreporting, students were provided with a wide range of frequency categories from which to choose and photographs to aid in the selection of portion sizes. In addition, the analysis was run using the middle beverage consumption frequency value as well as the higher frequency value (data not presented). For example, if the frequency option ‘2–4 times per week’ was selected this was taken as ‘3 times per week’ and a second analysis was conducted taking ‘4 times per week’ as the value. The results produced from the second analysis were very similar to those from the first. Carbonated beverage consumption increased when the higher value was used, and it then replaced milk as the fourth most commonly consumed beverage instead of the fifth. However, its median consumption (46·2 ml/d) was still much lower than that reported in the NTFS (129 ml/d). No data were collected on non-participants and therefore differences between responders and non-responders were not identified; however, the overall response rate was 82·5 %.
Conclusion
The present pilot study provides a snapshot of current habitual non-alcoholic beverage consumption among a sample of 12–18-year-olds in Ireland. Significant differences in beverage consumption were reported between adolescents from four distinct schools. While the results of the pilot study are not representative of the general population, they nevertheless indicate changing patterns of beverage consumption in Irish adolescents and suggest the need for action to promote healthy beverage consumption in disadvantaged areas. Further investigation in a larger nationally representative sample is needed to more fully understand the changing pattern of beverage consumption in this population.
Acknowledgements
Financial support: This research received partial funding from the School of Agriculture and Food Science, University College Dublin, Ireland. Conflict of interest: None. Authorship: A.M. formulated the research question and designed the study with S.M., who designed the survey format. S.M. and M.O. coordinated the survey completion in respective schools. L.K. and B.M. ran the statistical analyses and all authors contributed to analysing and interpreting the data. S.M. wrote the article with contributions from all authors. Ethics of human subject participation: This study was conducted according to the guidelines laid down in the Declaration of Helsinki and all procedures involving human subjects were approved by the Human Research Ethics Committee at University College Dublin. Written informed parental consent was obtained for all participants.


