


The health and economic burden of managing preventable diseases caused by excess adiposity is not sustainable over the long term(Reference Scarborough, Bhatnagar and Wickramasinghe1). Of concern is that approaches to prevent gains in body fat through moderating energy intake have often not been effective for a multitude of complex inter-linked reasons that may include motivation, food cravings and willpower(Reference Lean, Astrup and Roberts2). Appetite contributes to the control of energy intake and is regulated by numerous physiological, psychological, social and environmental factors(Reference Hopkins and Blundell3). One environmental factor that may be relatively practical to manipulate (e.g. through heated rooms, clothing, sauna, hot baths or outdoor exposure to hot climates) is temperature. Yet, few studies have determined the appetite responses to different ambient temperatures, particularly under resting conditions. During 48–60 h exposures to different ambient temperatures within a relatively narrow range (16 v. 22, and 27 v. 22°C) at rest in metabolic chambers, findings of two similar studies suggest that ad libitum energy intake increases at lower temperatures(Reference Westerterp-Plantenga, van Marken Lichtenbelt and Strobbe4,Reference Westerterp-Plantenga, van Marken Lichtenbelt and Cilissen5) . Further, the reported differences in energy intake were related to changes in core body temperature(Reference Westerterp-Plantenga, van Marken Lichtenbelt and Strobbe4,Reference Westerterp-Plantenga, van Marken Lichtenbelt and Cilissen5) . There is also pilot data demonstrating that a 2 h exposure to a warm (26–27°C) v. thermoneutral (19–20°C) ambient temperature resulted in a trend for reduced ad libitum energy intake; yet, the difference was not significant, possibly because the sample size was not sufficient(Reference Bernhard, Li and Allison6). Energy intake, however, was not affected in response to a 2·5 h exposure to a mild cold (18°C) v. thermoneutral (24°C) ambient temperature, despite a trend towards higher perceived hunger(Reference Langeveld, Tan and Soeters7). Similarly, the amount of food consumed at breakfast, lunch and dinner was unaffected when comparing exposure to 28, 32, 36 and 38°C, even though subjective appetite at lunch was lower in the higher temperatures, perhaps due to the narrow range of temperatures and because the meals were not served ad libitum (Reference Zheng, Li and Wang8). To complement these findings, the majority of studies that have manipulated ambient temperature during exercise show that exercise performed in the heat decreases and exercise performed in the cold increases subsequent energy intake and perceived appetite when compared with thermoneutral temperatures(Reference Crabtree and Blannin9–Reference Mandic, Ahmed and Rhind15), whilst others have shown no effect(Reference Mandic, Ahmed and Rhind15,Reference Faure, Charlot and Henri16) . Thus, findings from the existing literature are not consistent.
It has been proposed that appetite responses to different ambient temperatures may be regulated in part by gut hormones, including the orexigenic hormone acylated ghrelin and the anorexigenic hormones peptide tyrosine-tyrosine (PYY) and glucagon-like peptide (GLP-1)(Reference Crabtree and Blannin9,Reference Wasse, King and Stensel10,Reference Shorten, Wallman and Guelfi13–Reference Tomasik, Sztefko and Pizon17) . Yet, studies investigating gut hormone responses to different ambient temperatures during rest are sparse. The limited evidence to date has shown that 30 min resting at 2 and 30°C increased and decreased plasma total ghrelin concentrations, respectively, when compared with 20°C, although whether this contributed to differences in energy intake was not assessed(Reference Tomasik, Sztefko and Pizon17). In support, a study examining the independent and combined effects of 40 min heat exposure and exercise reported that a hot (31°C) v. thermoneutral (22°C) ambient temperature decreased plasma total ghrelin with a trend for a reduction in subjective appetite; however, ambient temperature did not affect energy intake(Reference Faure, Charlot and Henri16). Importantly, these studies conducted at rest did not measure the acylated fraction of ghrelin, which is responsible for ghrelin’s effects on appetite(Reference Broglio, Gottero and Prodam18). Studies that have manipulated ambient temperature during exercise rather than rest have reported mixed findings for total ghrelin(Reference Kojima, Sasaki and Tsuchiya14–Reference Faure, Charlot and Henri16,Reference Laursen, Zak and Shute19) , acylated ghrelin(Reference Crabtree and Blannin9,Reference Wasse, King and Stensel10,Reference Shorten, Wallman and Guelfi13,Reference Mandic, Ahmed and Rhind15,Reference Laursen, Zak and Shute19) and PYY(Reference Shorten, Wallman and Guelfi13–Reference Mandic, Ahmed and Rhind15). Further, only one study appears to have measured GLP-1, which did not change in response to exercise performed in hot or cold ambient temperatures(Reference Mandic, Ahmed and Rhind15). These variable responses may be due to inter-study differences in participant characteristics, the temperatures used to elicit ‘hot’ (30–36°C), ‘thermoneutral’ (20–25°C) and ‘cold’ (2–12°C), whether ambient temperature was manipulated for the entire trial duration or at a certain time point (e.g. during exercise only, or before ad libitum meal consumption), exercise characteristics and test meal characteristics. Moreover, exercise exerts an independent effect on appetite that may interact with ambient temperature in studies that have included an exercise component(Reference Hazell, Islam and Townsend20).
Due to the inconsistent findings and lack of existing data conducted under resting conditions, the independent effect of ambient temperature on energy intake, appetite and gut hormones remains unknown. Among the resting studies to date, none have compared a continuum of temperatures from cold to hot to establish the possible dose–response relationship with appetite-related variables. The primary aim of this study was to compare the acute effects of cold, thermoneutral and hot ambient temperatures during rest on lunchtime ad libitum energy intake in men. The secondary aims were to examine the effects of ambient temperature on gut hormone (acylated ghrelin, PYY and GLP-1), perceived appetite and thermoregulatory responses.
Experimental methods
Participants
This study was conducted according to the guidelines laid down in the Declaration of Helsinki, and all procedures involving human participants were approved by the Institute of Sport and Physical Activity Research Ethics Committee at the University of Bedfordshire (approval number: 2016ISPAR003). Data collection took place between January 2016 and January 2017. Healthy men aged 18–30 years were recruited. Written informed consent was obtained from all participants. A questionnaire was completed to screen participants for potential health conditions that may affect their eligibility to participate or the study outcomes, including dietary allergies and intolerances, blood borne diseases, CHD, diabetes, high blood pressure, epilepsy, respiratory conditions and musculoskeletal injury that affected normal movement within the last month and disturbance of vision. All of the participants had a healthy body fat %, with a range of 8·0–18·2 %(Reference Gallagher, Heymsfield and Heo21,Reference Bray22) . Participants confirmed verbally that they had not been exposed to either hot or cold environments that would be atypical of the local area and may have resulted in a degree of acclimatisation within 3 months prior to their inclusion in the study; for example, a holiday. Those who were exposed did not partake in the study. Participants also confirmed that they consumed breakfast habitually (i.e. at least 4 d/week). Prior to the experimental conditions, height was measured to the nearest 0·01 m using a stadiometer (Harpenden, Holtain Ltd.), body mass was measured to the nearest 0·1 kg using a digital balance scale (Tanita BC 418 MA analyser, Tanita Corporation), and body fat was measured to the nearest 0·1 % via air displacement plethymogrophy (Bod Pod, Cosmed, Middlesex). The participants were also familiarised with study procedures and equipment.
Experimental design
Each participant completed three, 5·5 h experimental conditions at a different ambient temperature in an environmental chamber (custom built from TIS Services, Medstead): 10°C (cold), 20°C (thermoneutral) and 30°C (hot). The environmental chamber was 4·8 (length) × 4·2 (width) × 2·7 (height) m with a temperature range of +1 to 50°C and an accuracy of ±1°C for temperature and ±2 % for relative humidity. The order of the three conditions was pre-determined using a computer-based random number generator according to an incomplete Latin square design. There was a 7–14 d washout period between the experimental conditions, which took place at the same time of day to control for circadian variation and to reflect typical breakfast (about 09.00 hours) and lunch (about 13.00 hours) times.
Participants were instructed to refrain from alcohol and caffeine consumption and to not take part in any strenuous physical activity for the 24 h preceding each experimental condition. Participants were also asked to complete a 24 h weighed food diary prior to their first experimental condition and not to consume any energy-providing nutrients from 21.00 hours onwards; dietary intakes (quantity and timings) were replicated in the 24 h before the subsequent experimental conditions. Each participant consumed 500 ml of water (this equated to about 5–7 ml/kg body mass) 2 h before arriving to the laboratory to promote a euhydrated state and thus limit the need for additional water consumption during the experimental conditions(Reference Sawka, Burke and Eichner23). To reflect real-life situations and for health and safety reasons, the participants were given prior knowledge of the ambient temperature of each condition they would be completing so that clothes could then be chosen accordingly, with the exception that clothes tailored for extreme environments were not permitted (e.g. thermal jackets, coats and gloves). This approach is in line with previous research(Reference Wasse, King and Stensel10).
Experimental protocol
Participants arrived at the laboratory at 08.30 hours after a 12 h overnight fast. On arrival, participants were fitted with skin temperature thermistors (Grant, EUS-UVS5-0, Wessex Power) located on the upper arm, chest, thigh and calf using adhesive tape, a rectal thermometer (YSI, 401) inserted 10 cm past the anal sphincter to monitor core temperature and a heart rate monitor (Polar FS1, Polar). A urine sample was collected and osmolality was measured (Atago Vitech Scientific, Pocket PAL-OSMO) to confirm participants were euhydrated, that is, urine osmolality <700 mOsm/kg water(Reference Sawka, Burke and Eichner23). Subsequently, an intravenous cannula was inserted into an antecubital vein and two fasting baseline blood samples were collected 5 min later within a thermoneutral ambient temperature. Participants then entered the environmental chamber, which was set at 10, 20 or 30°C. Participants remained seated throughout each condition and were permitted to complete work on a laptop that did not contain any appetite-related cues. After 5 min of entering the chamber, each participant consumed a standardised breakfast meal. Blood samples were then collected at 0·5, 1, 1·5, 2, 3, 4, 5 and 5·5 h during the postprandial period (i.e. 0·5 h intervals after eating and 1 h intervals for all remaining time points). An ad libitum pasta meal was provided at 4–4·5 h. Perceptions of hunger, satisfaction, fullness and prospective food consumption were assessed using 100 mm visual analogue scales at baseline (fasted) and then every 30 min after consuming breakfast. Overall appetite score was calculated as the mean value of the four appetite perceptions after inverting the values for satisfaction and fullness(Reference Stubbs, Hughes and Johnstone24). In line with previous research, water was available ad libitum and the amount consumed was recorded(Reference Westerterp-Plantenga, van Marken Lichtenbelt and Strobbe4–Reference Bernhard, Li and Allison6,Reference Crabtree and Blannin9–Reference White, Dressendorfer and Holland11,Reference Mandic, Ahmed and Rhind15) . The only exception was that water was not permitted in the hour prior to or during the ad libitum lunch due to the possible influence on energy intake(Reference Corney, Sunderland and James25). Body mass was recorded at baseline and on cessation of each experimental condition once all equipment, such as skin thermistors and rectal probes, had been removed. Relative humidity was controlled at 50 % for all conditions(Reference Wasse, King and Stensel10). Ambient temperature, relative humidity and heart rate were recorded every 30 min; core temperature and skin temperature were recorded every 10 min.
Blood sampling and chemistry
Blood samples were collected into pre-chilled EDTA vacuettes (Vacuette, Greiner Bio-One). From each sample, 50 μl blood samples were collected into two heparinised microhaematocrit tubes for determination of haematocrit and a 20 μl sample into a microcuvette for determination of Hb concentrations to assess changes in plasma volume(Reference Dill and Costill26). One vacuette was immediately centrifued at 1500 g for 10 min at 4°C (Heraeus Multifuge X3R, Thermo Scientific). The plasma supernatant was placed into separate cryovials and stored at –80°C until later analysis of total PYY and total GLP-1. To prevent the degradation of acylated ghrelin, a solution of potassium phosphate buffer, P-hydroxymercuribenzoic acid and sodium hydroxide (NaOH) (this was 10 μl per ml of blood) was added to one EDTA vacuette. This vacuette was then spun in a refrigerated centrifuge at 1500 g for 10 min at 4°C. The plasma supernatant was then placed into a storage tube and 100 μl of hydrochloric acid (HCl) per 1 ml of plasma was added to preserve acylated ghrelin(Reference Hosoda, Doi and Nagaya27). Thereafter, the sample was spun at 1500 g for 5 min at 4°C prior to storage at –80°C pending acylated ghrelin analysis. Commercially available enzyme immunoassays were used according to manufacturer’s instructions to determine plasma concentrations of acylated ghrelin (SPI BIO, Montigny le Bretonneux), total GLP-1 (Millipore) and total PYY (Millipore). To eliminate inter-assay variation, samples from each participant were analysed in the same run. The intra-assay CV was 3·0 % for acylated ghrelin and total PYY and 8·2 % for total GLP-1.
Meals
The standardised breakfast consisted of bread, cheese, jam, orange juice and milk. The meal provided 25 kJ/kg of body mass (6 kcal/kg of body mass), and the macronutrient content was 17 % protein, 33 % fat and 46 % carbohydrate. Participants were instructed to consume the meal within 10 min. The consumption time of the breakfast was recorded, and participants were instructed to replicate this in subsequent conditions. Ad libitum meals have been shown to be sensitive to differences in energy intake in response to resting(Reference Westerterp-Plantenga, van Marken Lichtenbelt and Strobbe4–Reference Langeveld, Tan and Soeters7) and performing exercise(Reference Crabtree and Blannin9–Reference Shorten, Wallman and Guelfi13) in different temperatures. The ad libitum pasta meal consisted of penne pasta (Everyday Value, Tesco) and chunky vegetable tomato sauce (Everyday Value, Tesco) cooked and prepared according to the manufacturer’s instructions. The total energy content of the meal was 8326 kJ (1990 kcal) with 81·4 % of energy from carbohydrate, 5·2 % from fat and 13·4 % from protein. None of the participants consumed the entire amount provided. The pasta meal was served warm, 10 min after preparation. Participants were instructed to serve their food into a separate bowl and were told: ‘we ask that you continue eating until you have satisfied your hunger’. The participants had 30 min to consume the ad libitum pasta meal in an isolated area within the environmental chamber to remove any social influences. To determine the quantity eaten, the ad libitum meal was weighed pre- and post-consumption.
Calculations
Mean skin temperature was calculated using the following equation(Reference Ramanathan28): Tsk = 0·3 × (Tarm + Tchest) + 0·2 × (Tcalf + Tthigh), where Tsk = mean skin temperature, Tarm = arm skin temperature, Tchest = chest skin temperature, Tcalf = calf skin temperature and Tthigh = thigh skin temperature. Mean body temperature was calculated as follows(Reference Colin, Timbal and Houdas29): 0·8(Trec) + 0·2(Tsk), where Trec = core temperature and Tsk = mean skin temperature.
In addition to absolute concentrations, plasma hormone concentrations are presented relative to baseline concentrations (i.e. delta) to minimise the potential influence of day-to-day biological variation(Reference Wasse, King and Stensel10). Total AUC values for gut hormone, perceived appetite and thermoregulatory data were calculated using the trapezoid rule. Correcting for plasma volume change did not produce different results for significant gut hormone analyses; thus, the uncorrected data are provided.
Statistical analyses
Statistical analyses were completed using SAS (University Edition, SAS Institute, Inc.). Normality of the data was checked using Quantile–Quantile plots. Linear mixed models were used to examine differences in all outcome variables with either condition (for fasting data, AUC data and ad libitum energy intake) or condition and time (for perceived appetite, gut hormone and thermoregulatory responses) included as fixed factors. All linear mixed models included a random effect for each participant and were adjusted for period (order) effects(Reference Senn30). Baseline concentrations were included as a covariate for gut hormone and perceived appetite analyses, as recommended to minimise artifactual effects due to random differences at baseline(Reference Blundell, de Graaf and Hulshof31). Where significant condition and/or condition by time interactions were found, post hoc analysis was performed using the Holm–Bonferroni correction for multiple comparisons; data from each individual time point were compared between the conditions for significant condition by time interactions(Reference Atkinson32). Sensitivity analyses were completed for the pre-lunch period (i.e. 0–4 h) for gut hormone and perceived appetite data to remove the possible confounding effect of the ad libitum lunch. Statistical significance was accepted as P ≤ 0·05. Absolute standardised effect sizes are provided to supplement important findings (i.e. significant effects between the individual conditions), with 0·2 considered the minimum important difference, 0·5 moderate and 0·8 large(Reference Cohen33). Results are presented as mean values and standard deviations in the text and table or mean values with their standard errors in the figures for clarity.
Justification of sample size
Sample size estimations were based on our primary outcome variable, energy intake. For primary obesity prevention, an energy deficit of 418 kJ/d (100 kcal/d) is recommended to prevent excess weight gain in 90 % of the US population; thus, we deemed this a clinically meaningful difference in ad libitum energy intake between the conditions(Reference Hill, Peters and Wyatt34). The expected sd for energy intake at an ad libitum pasta meal in healthy men is about 460 kJ (about 110 kcal) based on our previous work using an identical meal(Reference Hough, Esh and Mackie35) and research using similar meals(Reference Chowdhury, Richardson and Tsintzas36,Reference Gregersen, Flint and Bitz37) . Based on these values, it was estimated that thirteen participants would be needed to detect a meaningful between-condition difference in ad libitum energy intake (Cohen’s d = 0·90) at 80 % power and an α level of 0·017 to account for multiple comparisons using the Bonferroni correction. To account for a potential 20 % drop-out rate, sixteen participants were recruited.
Results
Participant characteristics
The final sample included thirteen participants. Three participants withdrew for the following reasons: time constraints (n 2) and feeling nauseous during cannulation insertion and blood draws (n 1). The physical characteristics of the final sample are shown in Table 1.
Table 1. Participant characteristics (n 13)
(Mean values and standard deviations)

Thermoregulatory responses
Thermoregulatory responses for each experimental condition with the main effects of condition and time, the condition by time interaction and individual time point differences are shown in Fig. 1. Baseline thermoregulatory data did not differ between the conditions (P ≥ 0·132). The significantly lower core temperature, mean skin temperature and mean body temperature in 10 v. 20 and 30°C and in 20 v. 30°C (P < 0·0001 for all) were complemented by large effect sizes (d = 1·12–6·19). Between-condition analyses of the AUC data for thermoregulatory variables produced similar results.

Fig. 1. Thermoregulatory responses in the 10, 20 and 30°C experimental conditions using a Latin square design (n 13). A standardised breakfast meal was consumed at 0 h, and an ad libitum lunch meal was consumed at 4–4·5 h. Values are means with error bars to represent the standard errors of the mean. * Significant main effect of experimental condition and significant condition by time interaction using linear mixed models (P < 0·0001). † Significant main effect of time using linear mixed models (P ≤ 0·0002). Significant difference using linear mixed models with the Holm–Bonferroni correction for multiple comparisons between: ‡ 10 and 30°C; § 20 and 30°C; ‖ 10 and 20°C (P ≤ 0·050 for all). ![]() , 10°C;
, 10°C; ![]() , 20°C;
, 20°C; ![]() , 30°C.
, 30°C.
Indicators of hydration
Change in body mass from baseline to the cessation of each condition did not differ significantly between the conditions (P = 0·915). Plasma volume change from baseline differed significantly between the conditions (P = 0·049), and there was a significant condition by time interaction (P = 0·006), but no significant differences between the individual conditions or at any time points were found after adjusting for multiple comparisons (P ≥ 0·055). The total volume of water consumed throughout each condition differed significantly between the conditions (P = 0·003). More water was consumed in 30 v. 10 and 20°C (estimated marginal means: 1070 (sem 164) ml for 30°C, 485 (sem 167) ml for 20°C and 543 (sem 171) ml for 10°C; P ≤ 0·014; d = 0·86–0·96).
Ad libitum energy intake
The mean and individual ad libitum energy intake responses for each experimental condition are shown in Fig. 2. Ad libitum energy intake was 1243 kJ (297 kcal) higher in 10°C (P = 0·002; d = 0·82) and 1188 kJ (284 kcal) higher in 20°C (P = 0·002; d = 0·79) when compared with 30°C with no significant difference between 10 and 20°C (P = 1·000). All individual responses followed this pattern, with the exception that two participants had a higher energy intake in 30 v. 10°C (see Fig. 2).
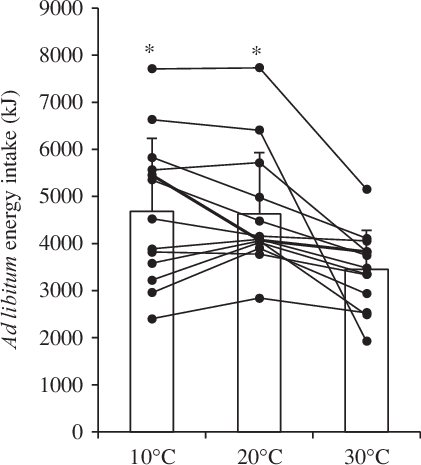
Fig. 2. Ad libitum energy intake in the 10, 20 and 30°C experimental conditions using a Latin square design (n 13). Bars represent means with standard errors of the mean represented by error bars. Lines represent individual responses. * Significant main effect of condition (P = 0·001) with higher ad libitum energy intake in 10 and 20°C compared with 30°C using linear mixed models with the Holm–Bonferroni correction for multiple comparisons (P = 0·002).
Perceived appetite
Baseline perceived appetite variables did not differ between the conditions (P ≥ 0·459). All perceived appetite variables changed significantly over time (P < 0·0001), but there were no main effects of condition and no condition by time interactions (P ≥ 0·090 for all). Perceived appetite AUC values did not differ between the conditions (P ≥ 0·415 for all). Following sensitivity analyses for the pre-lunch period, the main effect of condition became significant for hunger, fullness, satisfaction, prospective food consumption and overall appetite (P ≤ 0·012 for all). Pre-lunch hunger was lower in 10 v. 20°C (P = 0·011; d = 0·35), pre-lunch fullness was lower in 20 v. 30°C (P = 0·010; d = 0·34), pre-lunch satisfaction was lower in 20 v. 30°C (P = 0·007; d = 0·45), pre-lunch prospective food consumption was lower in 10 v. 20°C (P = 0·002; d = 0·34) and in 30 v. 20°C (P = 0·012; d = 0·35) and pre-lunch overall appetite was lower in 10 v. 20°C (P = 0·019; d = 0·30) and in 30 v. 20°C (P = 0·003; d = 0·37). The perceived overall appetite responses to each experimental condition are shown in Fig. 3.
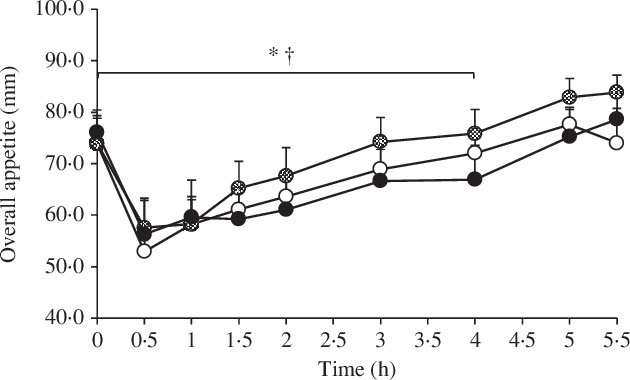
Fig. 3. Perceived overall appetite in the 10, 20 and 30°C experimental conditions using a Latin square design (n 13). A standardised breakfast meal was consumed at 0 h, and an ad libitum lunch meal was consumed at 4–4·5 h. Values are means with error bars to represent the standard errors of the mean. Sensitivity analyses using linear mixed models for the pre-lunch period showed a significant difference between: * 20 and 30°C; † 10 and 20°C (P ≤ 0·019). ![]() , 10°C;
, 10°C; ![]() , 20°C;
, 20°C; ![]() , 30°C.
, 30°C.
Plasma acylated ghrelin, total peptide tyrosine-tyrosine and total glucagon-like peptide 1 concentrations
Fig. 4 shows the delta gut hormone responses to the three experimental conditions with the main effects of condition and time and the condition by time interaction. Plasma total GLP-1 data were available for nine out of the thirteen participants due to funding reasons. Baseline gut hormone concentrations did not differ between the conditions (P ≥ 0·081). There were no between-condition differences in AUC data for the gut hormones (P ≥ 0·099). Sensitivity analyses for the pre-lunch period produced similar results.

Fig. 4. Plasma concentrations of delta (i.e. change from baseline) acylated ghrelin (a), total peptide tyrosine-tyrosine (PYY) (b) and total glucagon-like peptide 1 (GLP-1) (c) for the 10, 20 and 30°C experimental conditions using a Latin square design. A standardised breakfast meal was consumed at 0 h, and an ad libitum lunch meal was consumed at 4–4·5 h. Values are means with error bars to represent the standard errors of the mean. * Significant main effect of time (P ≤ 0·032), non-significant main effect for condition and non-significant condition by time by interaction (P ≥ 0·303) regardless of whether expressed as delta or absolute concentrations. ![]() , 10°C;
, 10°C; ![]() , 20°C;
, 20°C; ![]() , 30°C.
, 30°C.
Discussion
This was the first study to directly compare the acute appetite responses to cold, thermoneutral and hot ambient temperatures under resting conditions. The main findings were that energy intake was reduced during an ad libitum lunch in response to acute exposure to a hot compared with a cold and thermoneutral ambient temperature in healthy men. The reduced lunchtime energy intake in the heat compared with thermoneutral ambient temperature coincided with lower perceived appetite between breakfast and lunch, indicating that this may be an important mediating factor. Conversely, acylated ghrelin, total PYY and total GLP-1 did not appear to contribute to the reduced energy intake in the heat.
The lower energy intake in the hot compared with thermoneutral and cold ambient temperature in our study was found even after an acute exposure, that is, the 4 h preceding and during lunch. This extends previous research showing 48–60 h exposures to higher ambient temperatures within a relatively narrow range (16 v. 22°C, and 27 v. 22°C) at rest in metabolic chambers reduce ad libitum energy intake(Reference Westerterp-Plantenga, van Marken Lichtenbelt and Strobbe4,Reference Westerterp-Plantenga, van Marken Lichtenbelt and Cilissen5) , indicating that much shorter exposures can exert similar effects. Further, a 2 h exposure to a warm (26–27°C) v. thermoneutral (19–20°C) environment resulted in a trend for a 418 kJ (100 kcal) reduced energy intake(Reference Bernhard, Li and Allison6). It is possible that this difference was not significant because a sample size estimation was not completed (sample size was based on feasibility) and a parallel-group design (rather than a crossover design) was used, while the longer exposure duration and ‘hot’ rather than ‘warm’ temperature in our study could explain why we found a reduction in energy intake of almost three times the magnitude. Our findings also complement research showing reduced energy intake in the hours after exercise performed in hot compared with thermoneutral ambient temperatures(Reference Wasse, King and Stensel10), suggesting that such effects can be seen without the exercise component. Interestingly, studies showing no effect of exercise in hot ambient temperatures on energy intake have included Afro-Caribbean men who were acclimated to the heat and thus potentially not sensitive to it is appetite-suppressing effects(Reference Faure, Charlot and Henri16), which may have also been the case in the Canadian Armed Forces members(Reference Mandic, Ahmed and Rhind15). The lack of difference in energy intake between the cold and thermoneutral temperatures in our study is in accordance with research comparing a 2·5 h ‘mild cold’ (18°C) with a thermoneutral (24°C) resting exposure(Reference Langeveld, Tan and Soeters7). Thus, there may not be a ‘dose–response’ relationship between ambient temperature during rest and energy intake, with effects seen in hot temperatures only. This lack of effect of resting in the cold also indicates that the increased energy intake in response to exercise performed in the cold(Reference Crabtree and Blannin9–Reference Dressendorfer12) may have been due to an interaction with exercise, although some have found no effect when manipulating temperature during exercise(Reference Mandic, Ahmed and Rhind15). The reason for the disparities between studies is likely related to inter-study differences in participant characteristics, study designs and methods. Given the limited data conducted during rest, future research is required to confirm our findings.
In addition to being statistically significant, the 1243 and 1188 kJ (297 and 284 kcal) reductions in energy intake were associated with large and moderate effect sizes in the hot compared with cold and thermoneutral ambient temperatures, respectively, and exceed the 418 kJ/d (100 kcal/d) energy deficit that has been recommended to prevent excess weight gain in 90 % of the US population(Reference Hill, Peters and Wyatt34). Thus, if repeated on a daily basis, our findings may have clinical relevance for primary obesity prevention. Further, it was possible to almost triple this recommended daily energy deficit in just one meal during the day, suggesting that manipulating ambient temperature in the hours before and during lunch may only be required for one meal every 3 d. In terms of real-life application, temperature appears to be relatively practical to manipulate when compared with other environmental factors that influence appetite (e.g. altitude), for example, through heated rooms, clothing, sauna, hot baths or outdoor exposure to hot climates. Further, the temperatures selected in our study simulated real-life temperatures and are thus ecologically valid. That said, research with shorter exposure times or potentially serving the meal in a thermoneutral ambient temperature may improve the practical application of our findings. Given that most of the evidence has manipulated ambient temperature during exercise rather than rest, our findings may be particularly important for individuals who would benefit from reductions energy intake, but have barriers to performing exercise at the moderate to vigorous intensities required to elicit suppressions in appetite(Reference Hazell, Islam and Townsend20). As there are reported acute cardiometabolic health benefits from acute energy restriction(Reference Antoni, Johnston and Collins38,Reference Maraki, Magkos and Christodoulou39) , our findings may also have clinical relevance for cardiometabolic disease prevention. That said, longer-term trials are required to directly determine the impact on obesity and cardiometabolic disease risk.
Among the complex mechanisms that regulate energy intake, perceptions in appetite may have contributed to the reduction in energy intake in the hot ambient temperature in our study. When examining the 4 h period from baseline to lunch, perceived appetite differed between the conditions, but not in a dose–response manner. As may be expected, perceived appetite was suppressed in the hot compared with thermoneutral ambient temperature, which may have contributed to the reported difference in ad libitum energy intake between these ambient temperatures. This finding aligns with research conducted under resting conditions, where perceived appetite was reduced at higher temperatures when comparing 28, 32, 36 and 38 °C(Reference Zheng, Li and Wang8). Somewhat in contrast to these findings, perceived appetite was also lower in the cold when compared with the thermoneutral ambient temperature, although there was no difference in ad libitum energy intake between these ambient temperatures. Previous work has not compared perceived appetite responses to cold and thermoneutral temperatures under resting conditions, but has shown an increase in hunger in response to the ‘mild cold’, that is, 18 v. 24°C(Reference Langeveld, Tan and Soeters7) or no difference when comparing 16 with 22°C(Reference Westerterp-Plantenga, van Marken Lichtenbelt and Strobbe4). Taken together, our findings suggest that the relationship between ambient temperature and appetite may not occur in a dose–response manner, and it is possible that both hot and cold temperatures can suppress perceptions in appetite when compared with thermoneutral temperatures. In contrast, there is evidence that exercise performed in the cold stimulates perceived appetite(Reference Wasse, King and Stensel10,Reference Kojima, Sasaki and Tsuchiya14,Reference Mandic, Ahmed and Rhind15) and exercise performed in the heat suppresses perceived appetite(Reference Wasse, King and Stensel10,Reference Mandic, Ahmed and Rhind15) . Thus, exercise and rest in the cold may exert different effects on appetite perceptions, a question that remains to be examined. It is also possible that the temperature of the ad libitum meal may partly explain the apparent discourse of the effects of the cold on perceived appetite and energy intake. Indeed, the ad libitum meal was served warm; as such, the increased energy intake in the cold may have occurred in an attempt to control core temperature regardless of appetite perceptions during the previous 4 h. Likewise, the warm meal may have discouraged food intake during the hot condition. Thus, it would be interesting to determine whether similar findings would be seen with meals served cold or at room temperature. It should also be noted that appetite perceptions did not differ between the conditions when the post-lunch period was included. Thus, it appears that differences in lunchtime energy intake attenuated the effect of ambient temperature on perceived appetite, which would be worth investigating with longer duration post-ad libitum lunch periods.
In hot ambient temperatures, the reduced splanchnic blood flow and blood flow redistribution to the skin for heat dissipation have been proposed to alter the stimulation and secretion of gut-derived appetite hormones, which could, in turn, affect energy intake(Reference Wasse, King and Stensel10). Yet, concentrations of acylated ghrelin, total PYY and total GLP-1 did not differ significantly between the different ambient temperatures in our study. For comparison, studies investigating gut hormones during rest in different ambient temperatures are sparse. Nevertheless, resting for 30 min at 2 and 30°C increased and decreased plasma total ghrelin concentrations, respectively, compared with 20°C in healthy men. Thus, perhaps our ‘cold’ condition was not extreme enough, or perhaps the disparity with our findings was because we measured acylated rather than total ghrelin(Reference Tomasik, Sztefko and Pizon17). Indeed, total ghrelin also decreased in response to 40 min of heat exposure during rest or exercise when compared with a thermoneutral ambient temperature in Afro-Caribbean men(Reference Faure, Charlot and Henri16). Somewhat in agreement with our findings, previous reports show that acute exposures to different ambient temperatures during exercise do not affect acylated ghrelin(Reference Wasse, King and Stensel10,Reference Shorten, Wallman and Guelfi13,Reference Laursen, Zak and Shute19) , although others show that exercise performed in the cold increases acylated ghrelin when compared with thermoneutral ambient temperatures(Reference Crabtree and Blannin9,Reference Mandic, Ahmed and Rhind15) . Regarding PYY, our findings complement research showing no effect of ambient temperature during exercise on total PYY concentrations(Reference Kojima, Sasaki and Tsuchiya14,Reference Mandic, Ahmed and Rhind15) ; yet, others report that exercise performed in hot ambient temperatures increases total PYY concentrations(Reference Shorten, Wallman and Guelfi13). These inconclusive findings and the limited current research conducted at rest warrant future research on gut hormone responses to different ambient temperatures.
It is possible that variable nature of gut hormone responses limited our ability to detect significant differences between the different ambient temperatures in our study, particularly because our study was conducted at rest rather than exercise, where differences may be more pronounced due to the additional impact of the exercise bout(Reference Hazell, Islam and Townsend20). As recommended, we controlled for baseline (fasting) differences within our analyses(Reference Blundell, de Graaf and Hulshof31). Nevertheless, it is important to note that there was a trend for lower baseline concentration of acylated ghrelin in the hot experimental condition (P = 0·081). Further, total plasma PYY did not follow what may be considered the ‘usual’ pattern over time in the thermoneutral ambient temperature due to the reduction to below fasting concentrations within 4 h of consuming breakfast. As there were no outliers, it is difficult to explain this response. That said, a possible contributing factor may have been the slightly higher fasting concentration in the thermoneutral condition (the difference between the thermoneutral and hot and cold conditions was 3·8–4·8 times that of the difference between the cold and hot conditions). This could indicate that our attempts to minimise day-to-day variation in gut hormones (e.g. by replicating diet and minimising physical activity in the days prior to the experimental trials) may have not been sufficient. Indeed, inter- and intra-individual variability in appetite-related variables is a current topic of considerable interest and should be a serious consideration in future research(Reference Hopkins and Blundell3,Reference Langeveld, Tan and Soeters7,Reference Goltz, Thackray and Atkinson40) .
It is unlikely that differences in hydration or water intake between the conditions were major contributing factors to the reported differences in energy intake in our study. Indeed, hydration status does not appear to affect subjective appetite or energy intake, regardless of subjective thirst and fluid intake(Reference Corney, Horina and Sunderland41,Reference Corney, Sunderland and James42) . Further, any differences in sweat loss and hydration status in our study were expected to be minimal as the participants remained sedentary throughout; this was supported by our finding that body mass and plasma volume change were not reduced in the hot ambient temperature when compared with the cold and thermoneutral temperature. Although some previous research on ambient temperature and appetite has controlled water consumption(Reference Kojima, Sasaki and Tsuchiya14,Reference Faure, Charlot and Henri16) , the majority has permitted ad libitum water consumption, which attempts to replace potential water loss from sweating in the heat and improves ecological validity(Reference Westerterp-Plantenga, van Marken Lichtenbelt and Strobbe4–Reference Bernhard, Li and Allison6,Reference Crabtree and Blannin9–Reference White, Dressendorfer and Holland11,Reference Shorten, Wallman and Guelfi13,Reference Mandic, Ahmed and Rhind15) . Thus, water was available ad libitum in our study, but, importantly, participants were not permitted water in the hour prior to or during the ad libitum lunch. Indeed, immediate pre-meal water consumption reduces ad libitum energy intake in young men(Reference Corney, Sunderland and James25), whereas consuming water 30 min prior to meal consumption does not(Reference Van Walleghen, Orr and Gentile43). As such, the reduced energy intake in the heat was most likely a direct effect of the ambient temperature with the higher water consumption playing, if any, a very minimal contribution.
Limitations of our study include the acute exposure; thus, chronic interventions are required to examine whether the reduced energy intake in a hot ambient temperature is sustained over longer periods. Indeed, individuals may begin to compensate in terms of, not only energy intake but also other components of energy balance, including energy expenditure. On this note, the current study did not measure energy expenditure, which increases acutely in lower ambient temperatures through both resting and physical activity energy expenditure(Reference Westerterp-Plantenga, van Marken Lichtenbelt and Strobbe4,Reference Westerterp-Plantenga, van Marken Lichtenbelt and Cilissen5) . Additional factors not measured in this study may mediate the relationship between ambient temperature and energy intake include other appetite-regulating hormones (e.g. leptin), ad libitum meal temperature, thermal sensation and tolerance, gastric emptying(Reference Stengel, Goebel and Luckey44), perceptions of hydration and thirst, pro-opiomelanocortin neurons in the hypothalamus via animal studies(Reference Vicent, Mook and Carter45)and such factors require examination to provide a more comprehensive understanding of appetite-related responses to ambient temperature. Further, our study and previous research(Reference Shorten, Wallman and Guelfi13–Reference Mandic, Ahmed and Rhind15) has measured total PYY rather than PYY3–36, which is more potent in stimulating satiety(Reference Chelikani, Haver and Reidelberger46). The lack of standardised clothing in our study increased the ecological validity of our finding and is line with previous research(Reference Wasse, King and Stensel10). However, this approach could have limited the effect of ambient temperature between the conditions even though each exposure exerted the expected thermoregulatory responses. To allow comparisons with much of the related literature(Reference Westerterp-Plantenga, van Marken Lichtenbelt and Strobbe4,Reference Wasse, King and Stensel10–Reference Kojima, Sasaki and Tsuchiya14,Reference Faure, Charlot and Henri16,Reference Tomasik, Sztefko and Pizon17,Reference Laursen, Zak and Shute19) , our findings are based on young healthy men. Individual characteristics, such as sex and weight status, may affect appetite responses(Reference Hopkins and Blundell3,Reference Hazell, Islam and Townsend20) , and there is limited data in overweight/obese populations(Reference Crabtree and Blannin9) and women(Reference Westerterp-Plantenga, van Marken Lichtenbelt and Cilissen5); thus, future research with such populations is needed.
In conclusion, findings from the present study show meaningful reductions in lunchtime ad libitum energy intake in response to acutely resting in a hot compared with thermoneutral and cold ambient temperature. Possible mediating factors for the reduction in energy in the hot compared with thermoneutral ambient temperature were reduced perceptions of appetite, whereas we found no evidence for a role of acylated ghrelin, total PYY or total GLP-1. Due to the distinct lack of data conducted under resting conditions, further research with different populations and exposure durations would be valuable.
Acknowledgements
The authors would like to acknowledge the students and laboratory technicians who supported data collection for this study.
The authors would like to thank the Society for Endocrinology for providing financial support for this research through the Summer Studentships Projects scheme.
J. K. Z.-F. and J. H. designed the study (project conception, development of overall research plan and study oversight). R. N. H. and D. C. completed data collection (hands-on conduct of the experiments). J. K. Z.-F. and R. N. H. completed data analyses. J. K. Z.-F. performed the statistical analyses and drafted the manuscript. J. H. and R. N. H. commented on the manuscript and J. K. Z.-F. had primary responsibility for final content. All authors read and approved the final manuscript.
The authors declare that there are no conflicts of interest.


