


Introduction
Iron deficiency (ID) is a common micronutrient deficiency, affecting approximately 18% of children under 5 years.(Reference Gedfie, Getawa and Melku1) Iron deficiency anaemia (IDA) occurs when iron metabolism is disrupted and, therefore, cannot fulfil necessary physiological needs or participate in essential biological processes.(Reference Zimmermann and Hurrell2) Hepcidin — a peptide hormone produced in the liver — regulates iron homeostasis(Reference Nemeth and Ganz3,Reference Ganz4) and is modulated mainly by body iron stores, erythropoiesis, and inflammation.(Reference Hentze, Muckenthaler and Galy5,Reference Camaschella and Pagani6) Elevated hepcidin levels are linked to reduced intestinal absorption and iron release from the tissues and macrophages, resulting in low circulating serum iron.(Reference Nemeth, Tuttle and Powelson7) Patients with true IDA without underlying conditions will exhibit reduced hepcidin concentrations to facilitate iron release into the blood for haemoglobin synthesis. Inflammation and infection can induce hepcidin expression leading to increased body iron storage and reduced plasma iron pool.(Reference Aguree and Reddy8–Reference Cepeda-Lopez, Aeberli and Zimmermann13) Non-pharmacological approaches that reduce inflammation could improve iron status by downregulating hepcidin expression.
Many dietary components have been shown to reduce inflammation, including foods rich in lycopene and polyphenols.(Reference Ghavipour, Saedisomeolia and Djalali14) Green tea, abundant in polyphenols, is a popular and widely accessible beverage consumed by much of the general population. Polyphenols are bioactive secondary plant metabolites in fruits and vegetables that contribute to their colour, flavour, and pharmacological activities.(Reference Recio, Andujar and Rios15) Those in green tea are called catechins, including epicatechin, epicatechin-3-gallate, epigallocatechin, and epigallocatechin-3-gallate (EGCG). EGCG is the major catechin in tea, accounting for 50–70 % of catechins in green tea, and it is well-researched for its health benefits.(Reference Khan and Mukhtar16) It is best known for its antioxidant and anti-inflammatory properties.(Reference Chu, Deng and Man17) As an antioxidant, EGCG has also been shown to increase cell viability by decreasing reactive oxygen species.(Reference Zhang, Wu and Lu18–Reference Frei and Higdon20) Importantly, Kim et al. (Reference Kim, Kim and Lee21) found that EGCG was effective in preventing IL-8 production, which in turn, reduced the degree of inflammatory response. However, no studies to date have reported improved iron status by reducing inflammation. Given its anti-inflammatory properties, we hypothesised that EGCG would reduce inflammation and thus improve iron status. In the present study, we used lipopolysaccharide (LPS) to induce inflammation in an animal model(Reference Ranneh, Akim and Hamid22) to study the relationship between obesity-induced inflammation and iron status. The Sprague–Dawley rat is commonly used as an animal model in medical and nutrition research.(Reference Piñero, Li and Hu23–Reference Benson, McMahon and Lowe25) It was chosen for this study because it has been extensively used to study iron metabolism and inflammation.(Reference Uritski, Bilkis and Reifen26–Reference Sword, Pope and Hoekstra28)
Although the relationship between inflammation and iron status has been widely reported, only a few studies have examined these conditions together with a non-pharmacological dietary supplement as an intervention. Understanding the relationship between chronic inflammation and iron status is essential when managing global health issues such as IDA and obesity. Thus, the objectives of this study were to (1) determine whether LPS-induced inflammation will affect iron status and (2) whether EGCG supplementation will suppress LPS-induced inflammation to maintain iron status.
Materials and methods
Animal diets and study design
Our animal study was approved by the Institutional Animal Care and Use Committee at Iowa State University and was performed according to the Iowa State University Laboratory Animal Resources Guidelines. Male Sprague–Dawley rats (n 32) were obtained at 21 days of age from Charles River Laboratories (Chicago, IL, USA). After 3 days of acclimation on a standard rat chow, rats were randomly assigned to one of four groups (n 8): negative control, positive control, treatment group 1 (LPS only), and treatment group 2 (LPS + EGCG). Previous studies have demonstrated significant changes in iron biomarkers and cellular function in rats who were supplemented with iron for 21 days.(Reference Ross and Eisenstein29–Reference Walter, Knutson and Paler-Martinez31) The use of 6–12 rats is a common practice in iron research to determine the impact of iron on important biomarkers.(Reference Ross and Eisenstein29,Reference Unger, Wiesinger and Hao32) All rats were placed on a powdered iron-deficient diet for 2 weeks (sufficient time to develop iron deficiency(Reference Zhang, Anderson and Meyers33)) at the start of the study: AIN-76A-modified diet containing 2–6 ppm Fe, 20 % casein; 0⋅3 % DL-Methionine; 55 % sucrose; 15 % maize starch; 5 % maize oil, 3⋅5 % mineral mix (iron deficient); 1 % vitamin mix; 0⋅2 % choline bitartrate. After 2 weeks, the positive control and treatment groups were placed on a powdered iron repletion diet, while the negative control remained on the iron-deficient diet. The iron repletion diet contained 35 ppm/kg Fe added as FeSO4, 20 % casein; 0⋅3 % dl-Methionine; 55 % sucrose; 15 % maize starch; 5 % maize oil, 3⋅5 % mineral mix; 0⋅02 % ferrous sulphate; 1 % vitamin mix; 0⋅2 % choline bitartrate. Both diets were purchased from Envigo-Teklnad (Indianapolis, IN, USA) and stored at 4 °C until needed. The green tea extract powder contained 50 % of total polyphenols as EGCG and was kindly provided by Givaudan (South Hackensack, NJ, USA). It was mixed thoroughly (600 mg EGCG/kg diet) with the iron-sufficient diet just before use based on dosages reported in other rats studies.(Reference Devika and Stanely Mainzen Prince34) The rats were kept in cages that had proper ventilation, and they were housed in a room that was kept at a temperature of 21 ± 1 °C. The room had a consistent pattern of 12 h of light and 12 h of darkness. Food and water were provided ad lib. The detailed study design is shown in Fig. 1.

Fig. 1. Study design. LPS, lipopolysaccharide; EGCG, epigallocatechin-3-gallate; LPS injections given three times a week for 3 weeks intraperitoneally = 0⋅5 mg/kg body weight.
The negative and positive control groups were given intraperitoneal saline (Sigma Aldrich, St. Louis, MO, USA) injections (0⋅5 ml/kg BW) three times per week. The treatment groups were given intraperitoneal injections of LPS at a dose of 0⋅5 mg/kg BW. We used an intermittent bolus of LPS injection based on a previous study that showed 0⋅5 mg of LPS per kg of body weight produced systemic inflammation with a low risk of fatality.(Reference Ranneh, Akim and Hamid22) The LPS was derived from Escherichia coli O55:B5 and was obtained from Sigma Aldrich (St. Louis, MO, USA). It was dissolved in phosphate-buffered saline and stored at 4 °C until use.
Institutional review board statement
The animal study protocol was approved by the Institutional Animal Care and Use Committee of Iowa State University (Approval number: IACUC-21–039; approved on 12 April 2021). The Iowa State University's Laboratory Animal Resources (LAR) operation adheres to the U.S. Public Health Service Policy and USDA Animal Welfare Act Regulations in the management and operation of laboratory animals, ensuring humane care and treatment. The animals were given standard rodent chow and access to water at all times.
Growth assessment and tissue collection
Body weight and food intake were measured daily. After 3 weeks, all the rats were anaesthetised by injecting ketamine (90 mg/kg) /xylazine (10 mg/kg) intraperitoneally). After collecting blood, tissues (liver and spleen) were harvested, rinsed in normal saline solution (0⋅9 %, w/v, NaCl), immediately weighed, and quickly wrapped in labelled foil and snap-frozen and stored at −80 °C until further analysis. The collected blood was allowed to clot, and centrifuged, and the serum was aliquoted and frozen (−80 °C) until subsequent biochemistry was performed. Serum samples were used to measure iron status (haemoglobin, haematocrit, ferritin, and serum iron) and inflammation markers (CRP, IL6, and SAA). The tissue samples were used to measure total iron concentrations.
Iron status indicators
Whole blood was used immediately to measure haemoglobin (haemocue Hb 201+) concentrations and haematocrit. Serum iron was determined using a commercial kit based on the total iron-binding capacity and serum iron assay kit (Abcam, Waltham, MA, USA). Tissue iron content was measured to assess iron stores using a standard ferrozine assay used in a previous study.(Reference Swain, Tabatabai and Reddy35) Briefly, livers were homogenised in water and subjected to trichloroacetic acid (TCA) protein precipitation at 65 °C for 20 h. Non-haeme iron assay was determined calorimetrically using ferrozine in thioglycolic acid by measuring the absorbance using a microplate reader (BioTek Instruments, Winooski, VT, USA) to assess soluble iron and calculating tissue iron content based on the weight of the tissue used. The same process was used to measure spleen iron content.
Inflammatory markers
CRP was determined using a commercial kit based on the Rat CRP SimpleStep ELISA kit (Abcam, Waltham, MA, USA). This assay employs an affinity tag-labelled capture antibody and a reporter-conjugated detector antibody, which immunocaptures the sample analyte in solution. This entire complex (capture antibody/analyte/detector antibody) is, in turn, immobilised via immunoaffinity of an anti-tag antibody coating the well. 3,3′5,5′-Tetramethylbenzidine (TMB) solution was added to the sample wells and catalysed by horseradish peroxidase (HRP), and the blue colour intensity was read at 450 nm using a microplate reader. IL-6 concentrations were measured using a commercial kit based on the Rat IL-6 ELISA kit (Millipore, St. Louis, MO, USA) in which the detection antibody was a biotinylated rat IL-6 antibody incubated with HRP + Streptavidin to determine results. SAA (an acute-phase protein and biomarker of inflammation) was measured using a commercial kit using sandwich ELISA (MyBioSource, San Diego, CA, USA). This kit used the pre-coated anti-rat SAA monoclonal antibody, and the detection antibody was a biotinylated polyclonal antibody.
Statistical analysis
Data were analysed using GraphPad Prism version 9 (La Jolla, CA, USA). Data are expressed as mean ± sem. Statistical differences among the groups were determined using one-way ANOVA with Tukey multiple comparisons test. Differences were considered significant at P ≤ 0⋅05.
Results
The average weight at the beginning of the study was 61 g, then increased to 269 g at the end (Table 1). There were no statistical differences among the groups when weight was compared each week (data not shown). The average daily food intake was 10⋅0 ± 0⋅6 g, with no statistical differences among groups. 600 mg of green tea powder was mixed thoroughly per 1 kg of diet. The average amount of total diet consumed per day for the LPS + EGCG group was approximately 9⋅61 g (Table 1). Thus, we can assume that approximately 5⋅8 mg of green tea powder was consumed per day.

As expected, haemoglobin concentration in the negative control group was lower (P < 0⋅0001) than in the positive control. In both LPS treatment groups (LPS, 10⋅9 ± 0⋅6 g/dl; LPS + EGCG, 9⋅8 ± 0⋅7 g/dl), haemoglobin concentrations were significantly higher than the negative control group (3⋅7 ± 0⋅3 g/dl) but no statistical differences compared to positive control (10⋅7+ ± 0⋅4). We observed the same trend with haematocrit values. The negative control (13⋅9 ± 2⋅9 %) was significantly (P < 0⋅005) lower than the positive control (31⋅4 ± 3⋅3 %). The values in LPS (24⋅3 ± 5⋅2 %) and LPS + EGCG (27⋅2 ± 3⋅4 %) were not significantly different from each other or with the positive or negative control groups. Overall, EGCG treatment had no effect on haemoglobin and haematocrit—as noted by comparable estimates between LPS and LPS + EGCG groups (Fig. 2(a), (b)).
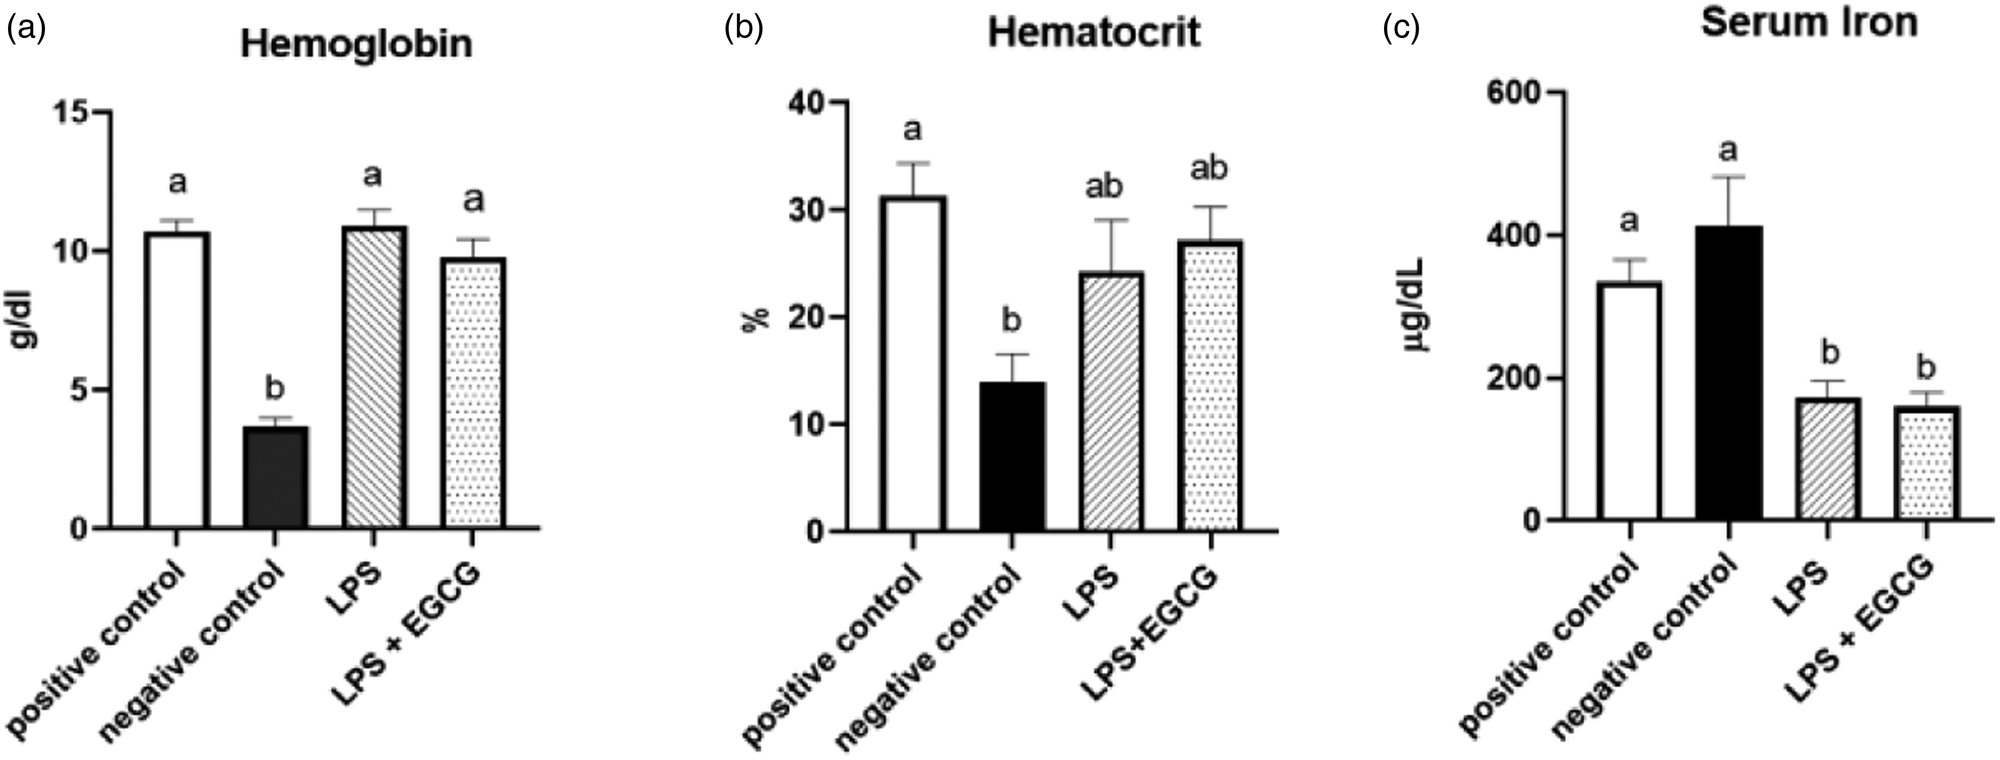
Fig. 2. Effect of EGCG on haemoglobin concentrations (a), haematocrit (b), and serum iron (c). Data are presented as mean ± sem, eight per treatment group, and means with different letters are significantly different (P < 0⋅05) based on ANOVA with Tukey's multiple comparison test for each measure. n 7 in the positive control group for haematocrit due to insufficient blood, and n 7 in both experimental groups due to unexpected rodent deaths early in the study.
Interestingly, feeding an iron-deficient diet did not significantly reduce serum iron concentrations in the negative control. However, inducing inflammation with LPS significantly reduced serum iron compared to positive control. Compared to the positive control (335⋅8 ± 32⋅1 μg/dL), serum iron concentrations (mean ± sem) were 50 % lower in the LPS only (172⋅5 ± 25⋅1 μg/dL) (P = 0⋅02) and the LPS + EGCG (159⋅80 ± 22⋅34 μg/dL) (P = 0⋅01) groups. There was no significant difference in serum iron concentration between the LPS only group and the LPS + EGCG group, indicating that EGCG consumptionhad no effect on serum iron concentrations (Fig. 2(c)). Two rodents, one from each treatment group, died after receiving one and two LPS injections, respectively. We believe these fatalities could be attributed to the LPS dosage utilised in the research.
Though there were no significant differences in liver iron concentrations (Fig. 3(a)) among the groups, spleen iron concentrations were significantly lower in the negative control (18⋅6 ± 2⋅8 μg/g) (P < 0⋅001) compared to the positive control group (89⋅6 ± 5⋅7 μg/g). Both LPS treatment groups had significantly higher iron content than the negative control, but no significant differences were observed between LPS (118⋅4 ± 8⋅3 μg/g) and LPS + EGCG (108⋅1 ± 12⋅8 μg/g) (Fig. 3(b)). As expected, hepcidin concentrations in the negative control (P < 0⋅05) and LPS-only groups (P = 0⋅01) were significantly lower than in the positive control. It appears that feeding rats with EGCG had no effect on hepcidin concentrations, as there was no difference between the two treatment groups (Fig. 3(c)).
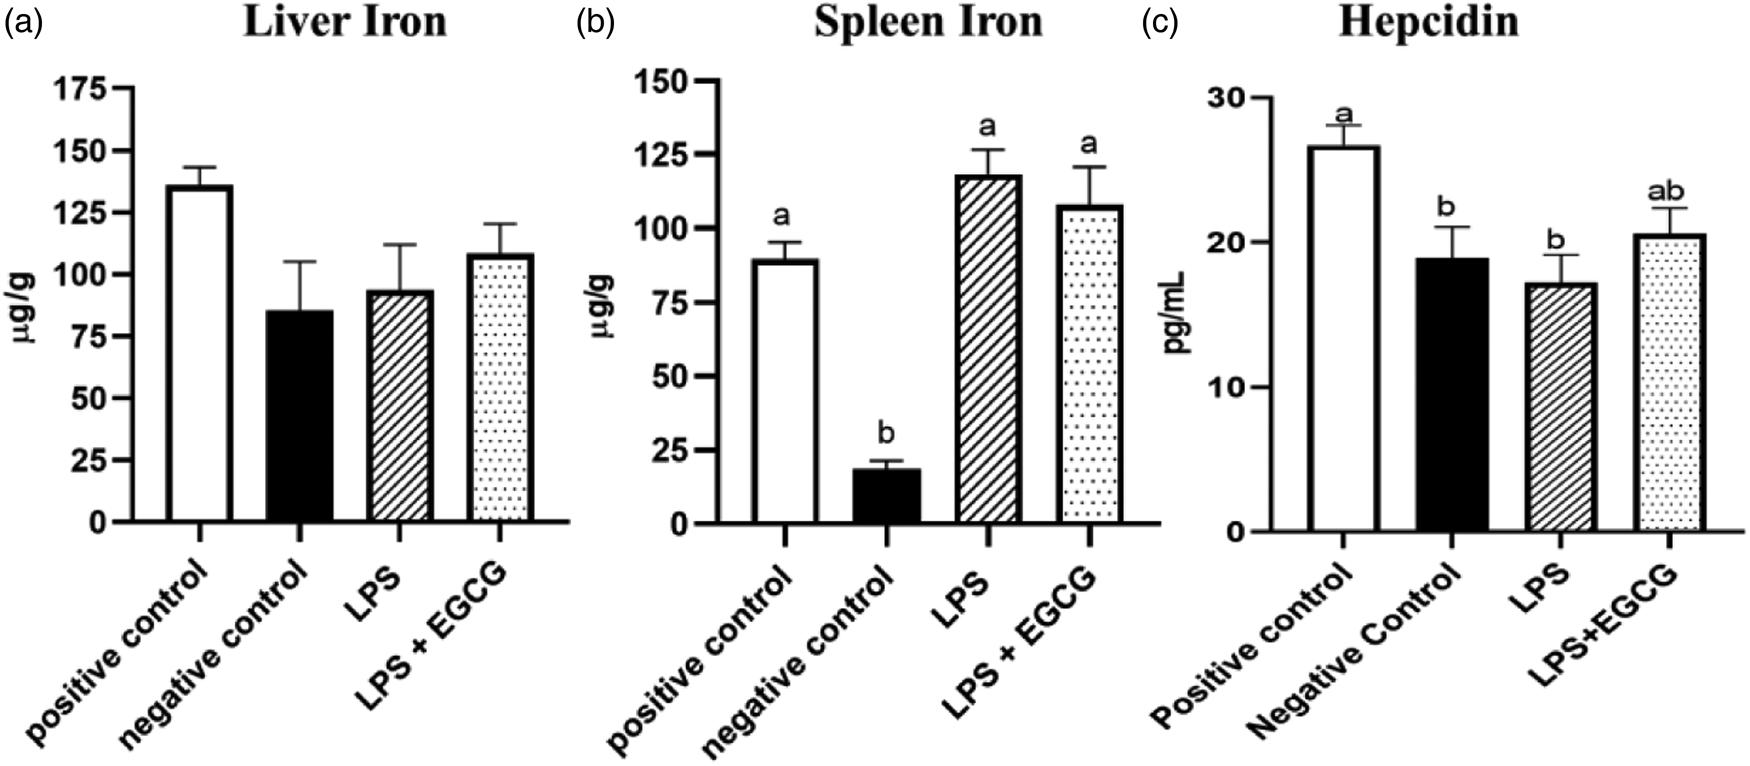
Fig. 3. Effects of EGCG and inflammation on liver (a) and spleen iron concentrations (b) and hepcidin concentrations (c). Data are presented as mean ± sem, eight per treatment group(n 7 in both experimental groups due to unexpected rodent deaths early in the study). Mean scores with different letters indicate statistical difference (P < 0⋅05), based on Tukey's multiple comparison test.
When observing inflammatory markers, SAA concentrations were significantly higher in LPS only group (3⋅1 ± 0⋅4 ng/ml) (P = 0⋅01) compared to the negative control group(2⋅3 ± 0⋅03 ng/ml) (Fig. 4(a)). Feeding EGCG significantly (P < 0⋅05) lowered SAA concentrations to a level similar to the negative and positive control groups suggesting reduced inflammation. Surprisingly, no significant differences were observed in CRP concentrations among the groups (Fig. 4(b)). IL-6 concentrations were significantly higher in the LPS + EGCG group than in all the groups. Unexpectedly, the LPS + EGCG group had significantly (146⋅1 ± 6⋅0 pg/ml P = 0⋅01) higher IL-6 concentrations than LPS alone (114⋅33 ± 4⋅78 pg/ml) group. (Fig. 4(c)).
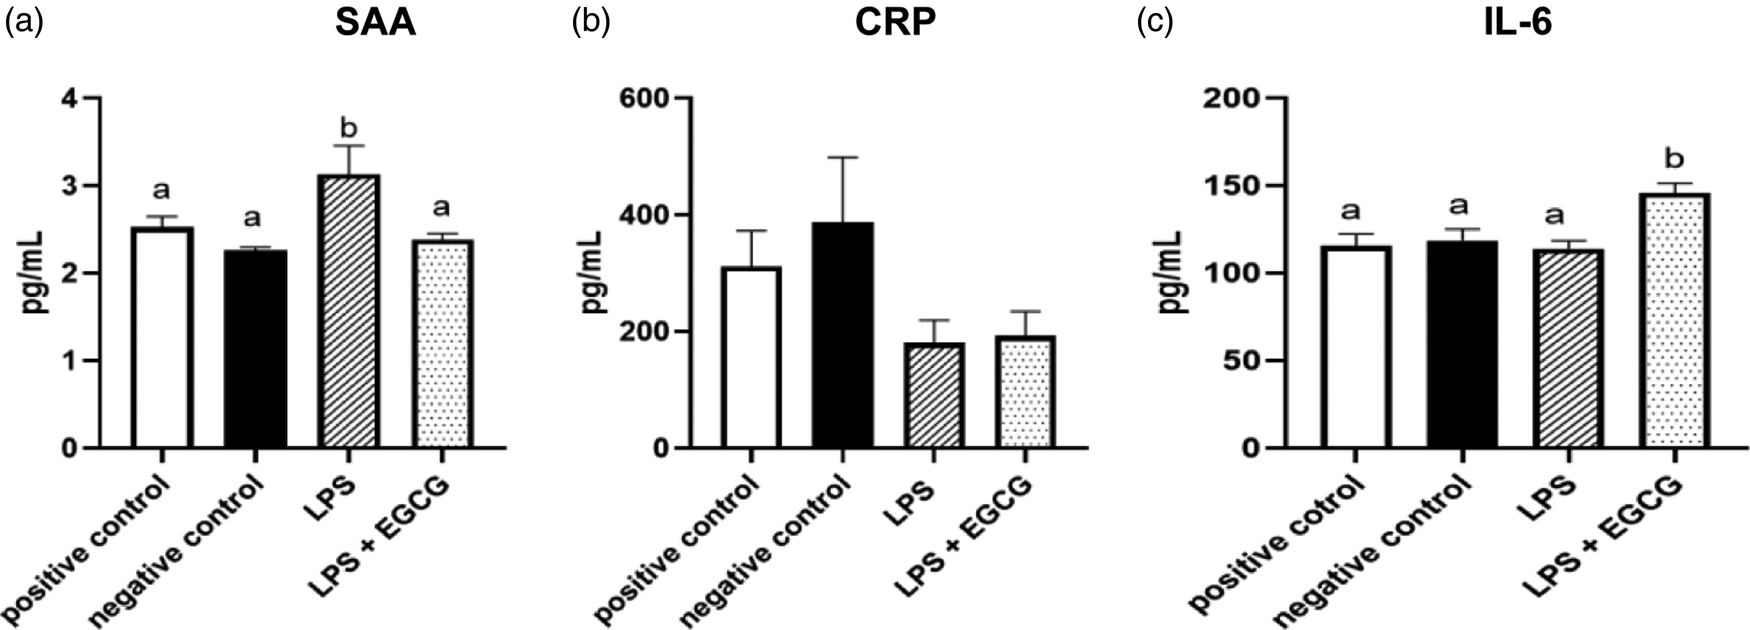
Fig. 4. Effects of EGCG on inflammation markers. Serum amyloid A (SAA) (a), C-reactive protein (CRP) (b), IL-6 concentrations (c), data are presented as mean ± sem, eight per treatment group (n 7 in both experimental groups due to unexpected rodent deaths early in the study). Mean scores with different letters are significantly different (P < 0⋅05) based on ANOVA with Tukey's multiple comparison test for each measure.
Discussion
Previous studies have shown a relationship between inflammatory markers and IDA,(Reference Aguree and Reddy8,Reference McClung and Karl36) but no studies till date propose using a dietary component to counteract inflammatory response in order to improve iron status. In the present study, LPS injection resulted in reduced serum iron but feeding rats with EGCG had no effect in counteracting inflammatory responses induced by LPS. However, the elevated SAA concentrations with LPS were significantly reduced by EGCG, suggesting its anti-inflammatory property.
The results of our study were unexpected as we did not observe any significant differences in cytokines or inflammation between the control group and the group treated with LPS. This contrasts with previous research which found that LPS administration increased levels of cytokines, particularly IL-6, and other markers of inflammation.(Reference Ranneh, Akim and Hamid22)
However, it is worth noting that the previous study used higher doses of LPS (1⋅0 ml/kg BW and 2 ml/kg BW), resulting in higher mortality rates than the lower dose used in our study (0⋅5 ml/kg BW). Our study had a higher survival rate, but stronger inflammatory responses and changes in hepcidin expression may require higher doses of LPS. Another difference between the two studies is the age of the rats used. The previous study used rats that were 9 weeks old when the LPS treatment began and over 13 weeks old at the end of the experiment, whereas our rats were only 5 weeks old at the start and 8 weeks old at the end. This is because it has been reported in mice that the levels of pro-inflammatory of TNF-α and IL-1β in were higher in mature compared to young control group following LPS administration.(Reference Zhao, Qiong and Zhang37) This difference in maturity could explain the varying inflammatory responses and the lack of difference between the treatment and control groups in our study. As the inflammatory responses were comparable between treatment groups, it was unsurprising that there were no significant differences in either experimental group when comparing haemoglobin concentrations and haematocrit to the positive control. The low haemoglobin concentrations in the negative control indicate that the rats were indeed iron deficient, thus providing knowledge for future studies to allow more focus on reducing chronic inflammation rather than inducing iron deficiency.
We also anticipated significant differences among liver iron concentrations, but no such findings were observed. Based on the reduction of serum iron following LPS-induced inflammation (based on SAA concentrations), we also expected high iron stores in the liver, but this was not observed. However, the LPS-only group showed a significant increase in spleen iron concentrations compared to the negative control. This could indicate ‘iron trapping,’ which is driven by hepcidin. Increased hepcidin levels will lead to an increase in endocytosis and the breakdown of ferroportin, thus keeping iron trapped within cells. This reduces the natural flow of iron from hepatocytes, enterocytes, and macrophages resulting in reduced serum iron concentration.(Reference Ueda and Takasawa38) Compared to the positive control, serum iron concentrations were 50 % lower in the LPS only and the LPS + EGCG groups. The levels of IL-6 and hepcidin were consistent among all groups,, but it is still uncertain what caused the decrease in serum concentration in the LPS group. Measuring other cytokines and inflammatory biomarkers might help to provide some clues to explain the observed changes in serum iron concentration. This indicates that EGCG did not improve serum iron, although some reduction in inflammation was found in terms of SAA concentration. However, the lower serum iron in the LPS only and LPS + EGCG groups demonstrates iron trapping theory in inflammation. The low serum iron was likely in response to inflammation, as it is consistent with previous studies that focused on inflammatory biomarkers.(Reference Suchdev, Williams and Mei39,Reference Nara and Watanabe40)
Higher concentrations of SAA in the LPS-only group but not in the LPS + EGCG group support our hypothesis. This data point alone indicates that the EGCG did reduce inflammation. The IL-6 data contradict this, as concentrations were elevated in the LPS + EGCG group but not in the LPS-only group or negative control. However, IL-6 concentrations are elevated in LPS + EGCG, which might be an anti-inflammatory response to ECCG as IL-6 also has extensive anti-inflammatory functions as a myokine.(Reference Nara and Watanabe40) Overall, inflammatory markers as a whole were inconclusive.
The inconclusive inflammatory biomarkers could also be due, in part, to the short half-life of CRP, which is approximately 19 h.(Reference Pepys and Hirschfield41) As an acute-phase protein, it has been reported that the plasma concentration of CRP deviates by at least 25 % during inflammatory conditions.(Reference Gabay and Kushner42) Importantly, when there is no longer a stimulus, CRP values reportedly decrease over 18–20 h.(Reference Ridker43) Thus, the timing of the blood draws in relation to the final dose of LPS may have been too large a time gap as other studies have reported a peak of pro-inflammatory cytokines occurring between 2 and 6 h post LPS administration.(Reference Matsuzaki, Kuwamura and Yamaji44,Reference Somann, Wasilczuk and Neihouser45) As the blood samples and tissues were collected a day after the administration of LPS, any changes in pro-inflammatory cytokines would have resolved before sample collection. We believe this to be the case with hepcidin, as it is also a transient hormone with a reported half-life of 2⋅3 min(Reference Xiao, Krzyzanski and Wang46) Thus, a blood draw closer to the time of LPS injection may have produced the expected hepcidin results. Importantly, previous studies suggest inflammatory regulators take precedence over iron stores: iron-deficient mice injected with LPS up-regulated hepcidin expression,(Reference Constante, Jiang and Wang47) while iron-loaded mice with experimentally induced anaemia down-regulated hepcidin expression.(Reference Nicolas, Chauvet and Viatte48) These contradictory assessment factors caused by inflammation could also explain the insignificant results observed in the liver iron.
The rationale behind using LPS was to induce inflammation similar to that of obesity, and it has been reported that inflammation is linked to increased adiposity.(Reference Welsh, Polisecki and Robertson49) IDA cannot be differentiated from the more prominent anaemia of inflammation because inflammation confounds the measurement of iron status.(Reference Aguree and Reddy8) Stoffel et al. (Reference Stoffel, El-Mallah and Herter-Aeberli50) evaluated different iron and inflammatory biomarkers in normal-weight v. obese women. They found higher levels of central adiposity correlated with elevated CRP, α-1 glycoprotein, serum hepcidin, total iron-binding capacity, and lower serum iron-to-hepcidin ratio and transferrin saturation.(Reference Stoffel, El-Mallah and Herter-Aeberli50) Similar results were reported by our group when normal-weight and obese subjects were compared to obese subjects.(Reference Aguree and Reddy8) The CRP values in the obese group were 8 times higher than in normal-weight women, and most of the normal-weight subjects were within the normal range, while those of the obese group were elevated.(Reference Aguree and Reddy8)
There were many strengths and limitations to this research. Measuring inflammatory markers such as CRP and hepcidin at a more optimal time could provide a clearer picture of whether inflammation was present due to LPS treatment. Measurement of iron biomarkers at the end of the iron-depletion phase just before the randomisation could also provide definitive answers as to whether the rats were indeed iron deficient prior to LPS and or EGCG treatment. Despite this limitation, the findings of this study are important because we measured a range of physiological factors that affect iron status and have opened the door to determining more ways to treat anaemia and chronic inflammation. Future studies could include a different LPS and EGCG administration regimen and dosage. Such studies should also measure more cytokines (e.g. tumour necrosis factor-α (TNF-α), interferon (IFN)-γ, interleukin-1 (IL-1), IL-1α, IL-1β), inflammatory, and iron biomarkers, as this will provide an opportunity to assess the effect of LPS and EGCG administration on iron metabolism. However, it should be noted that in the present study, we took a cautious approachfor each regimen to minimize stress on the rodents. It is possible that if we had used a higher dose of LPS administration or studied chronic inflammation (such as obesity), the results may have been different.
Conclusions
Multiple doses of 0⋅5 ml/kg of LPS did not increase serum cytokines (IL-6), CRP, or hepcidin. Higher doses of LPS may be needed to induce increased expression of pro-inflammatory cytokine changes in young rats. Blood and tissue samples should be collected a few hours after LPS administration to observe changes in cytokine and hepcidin concentrations.
Acknowledgments
We want to express our gratitude to Dr Matthew Rowling, an Associate Professor in the Department of Food Science and Human Nutrition at Iowa State University, for providing technical assistance throughout the project. Additionally, we thank the undergraduate students in our laboratory, Alexandra Handt and Kiya Toland, for contributing to various aspects of the project. Specifically, Alexandra Handt and Kiya Toland recorded animal weights and entered the data into an Excel file.
M. J., S. A., and M. B. R. conceptualised the study; M. J., S. A., K. S., and M. B. R. prepared the methodology; M. J., S. A., and M. B. R. did formal analysis; M. J., S. A., and M. B. R. investigated the study; M. B. R. collected resources; M. J. and S. A. wrote the original draft; K. S. and M. B. R. wrote, reviewed, and edited the article; M. B. R. supervised the study; M. B. R. acquired funds. All authors have read and agreed to the published version of the manuscript.
This research received no external funding: the research was funded by the Doris A. Adams Endowed Chair for MBR at the College of Human Sciences, Iowa State University.
The authors declare no conflict of interest.


 Open access