


Mg plays a key role in a wide range of cellular functions, which are known to affect many aspects of the endocrine system( Reference de Baaij, Hoenderop and Bindels 1 – Reference Gröber, Schmidt and Kisters 4 ). Many studies showed that lower serum or urinary Mg was associated with an increased risk of ischaemic stroke( Reference Joosten, Gansevoort and Mukamal 5 ), CHD and cardiovascular mortality( Reference Del Gobbo, Imamura and Wu 6 , Reference Qu, Jin and Hao 7 ). However, serum Mg concentrations were negatively associated with type 2 diabetes (T2D) and indices of glycaemic control and insulin resistance( Reference Bertinato, Wang and Hayward 8 ).
Some studies( Reference Wilson, Meigs and Sullivan 9 , 10 ) have shown that dyslipidaemia is one of the known risk factors for T2D. Traditional lipid measures, including total cholesterol (TC), TAG, HDL-cholesterol and LDL-cholesterol, are well documented in their association with the incidence of T2D( Reference Ley, Harris and Mamakeesick 11 , Reference Song, Liu and Wang 12 ).
In addition, central obesity had a greater effect on TC and LDL-cholesterol than BMI among women( Reference Njelekela, Negishi and Nara 13 ). The highest mean of serum lipids and the highest extent of dyslipidaemia existed in children having central obesity along with general obesity( Reference Bijari, Taheri and Chahkandi 14 ).
In the study by Cao et al.(Reference Cao, Wang and Guan15), higher serum Mg levels were associated with higher TC, TAG, HDL-cholesterol and LDL-cholesterol but lower non-HDL-cholesterol/HDL-cholesterol in the total population (all P<0·05). Similar relationships of urinary Mg with lipoproteins were also found in this study (all P<0·05). In contrast, in the study by Shahbah et al.( Reference Shahbah, El Naga and Hassan16), serum Mg was found to be positively correlated with HDL (P< 0·001) and negatively correlated with TAG, TC and LDL-cholesterol (P< 0·001). In addition, the study by Rasheed et al.(Reference Rasheed, Elahi and Ajaz17) found that mean serum Mg in diabetic patients was significantly lower as compared with healthy subjects.
Some of the conflicting study results confused us, which is attributed to their insufficient adjustment for confounders. Meanwhile, limited studies examined the association between serum Mg and blood lipids in subjects with T2D and central obesity.
The aim of our study was to explore the changes in the relationship between blood lipids and serum Mg of Chinese adults with T2D or central obesity. Using the Metabolic, Lifestyle and Nutrition Assessment in adult survey-China Health and Nutrition Survey (CHNS), we report that an elevated TAG, TC and LDL-cholesterol increased across progressive Mg groups in some subgroups. However, this association is somehow influenced by T2D. Meanwhile, after adjusting for confounders, a new phenomenon about serum lipids is found in lower serum Mg levels.
Methods
Study design
The CHNS is a large-scale, national cross-sectional survey that was designed to investigate the Chinese health and nutritional status. Currently, data are available in 2009. A stratified multi-stage cluster random process was used to draw samples from nine provinces of China, which included Shandong, Henan, Liaoning, Hunan, Heilongjiang, Jiangsu, Hubei, Guangxi and Guizhou. All participants voluntarily joined this study with informed consent, and the study was approved by an institutional review board of the University of North Carolina at Chapel Hill and China Center for Disease Control and Prevention. There was no Mg Supplementation during this study.
Study population
Participants aged 18 years or older were included in this study. Information on age, sex, region, activity level and dietary behaviour was collected. There were 8163 participants included in the surveys organised in 2009. This sample is varied, with variation found in a wide range of related biochemical markers, healthy factors, nutritional and demographic measures( Reference Popkin, Du and Zhai 18 ), TAG, TC, HDL-cholesterol and LDL-cholesterol.
The current study is a cross-sectional analysis of 8163 subjects included in the surveys organised in 2009, with complete information for the determination of T2D, central obesity, serum lipids and blood Mg, as described below. Every subject underwent the same examinations during this survey.
Measurements and definitions
Individuals aged over 7 years went to a neighbourhood clinic to have fasting blood samples collected by trained physicians. Individuals who were unable to attend the clinic had blood samples collected at home. To avoid omitting children in boarding schools and migrant workers, special efforts were made to schedule visits early in the morning or on weekends when these participants were at home. All interviewers spent 7 d in training provided by the collaborating teams before the survey, and were overseen through the Internet during their visits (at the same time, the monitor data were collected by the University of North Carolina at Chapel Hill, the China Centers for Disease Control and Prevention and the China-Japan Friendship Hospital).
Systolic (SBP) and diastolic (DBP) blood pressure was measured on the right arm, using mercury Sphygmomanometers with appropriate cuff sizes. Blood pressure was measured three times over a 10-min seated rest, and the mean of the three measurements was used in our analyses. The time interval between two measurements was about 30 s.
Testing of blood cell count was to be completed in local laboratories in accordance with the consensus guidelines of CHNS. Testing of serum lipids and blood Mg was to be completed in China-Japan Friendship Hospital, Ministry of Health laboratory, which meets all requirements for accurate measurement and testing.
After an overnight fast, blood was collected by venepuncture and tested immediately for glucose and HbA1c. Plasma and serum samples were then frozen and stored at −86°C for later laboratory analysis. All samples were analysed in a national central laboratory in Beijing (medical laboratory accreditation certificate ISO 15189:2007) with strict quality control. We focus on blood pressure (SBP and DBP) and biomarkers of cardiometablic disease risk related to T2D, dyslipidaemia (TC, HDL-cholesterol and LDL-cholesterol all measured using glycerol-phosphate oxidase method and the PEG-modified enzyme method, respectively, by determiner reagents (Kyowa Medex Co., Ltd) and TAG using glycerol-phosphate oxidase method and the PEG-modified enzyme method, respectively, by determiner regents (Kyowa Medex Co., Ltd)). Mg was measured on the Hitachi 7600 automated Analyzer Randox (Hitachi Inc.) by the Xylidyl Blue Colorimetric method (Randox Laboratories Ltd.
Weight was measured to the nearest 0·1 kg with light-weight clothing on a calibrated beam scale, and height was measured to the nearest 0·1 cm without shoes with a portable stadiometer. BMI was calculated as weight in kilograms divided by the square of height in metres. Waist circumference (WC) was measured at a point midway between the lowest rib and the iliac crest in a horizontal plane using non-elastic tape. Height, weight and WC were measured by trained examiners following a standard protocol from the WHO( Reference Than, Soe and Palaniappan 19 ). Height, weight and WC measurements were made at the same location and the same protocol was followed at each study visit.
Central obesity was defined by WC>90 cm for men and >80 cm for women( Reference Russo, Traversa and Bonomo 20 ). Laboratory data were obtained within 2 months of the questionnaire visit.
Subjects were classified according to T2D (yes/no) and central obesity (yes/no) initially and blood Mg (below 0·65 mmol/l, 0·65–0·95 mmol/l and over 0·95 mmol/l) afterward according to the classification of CHNS.
Additional information collected from interviews, physical examination and clinical records included the following: age, sex, weight, height, BMI, dyslipidaemia, dietary factors and use of anti-diabetic drugs (Fig. 1).
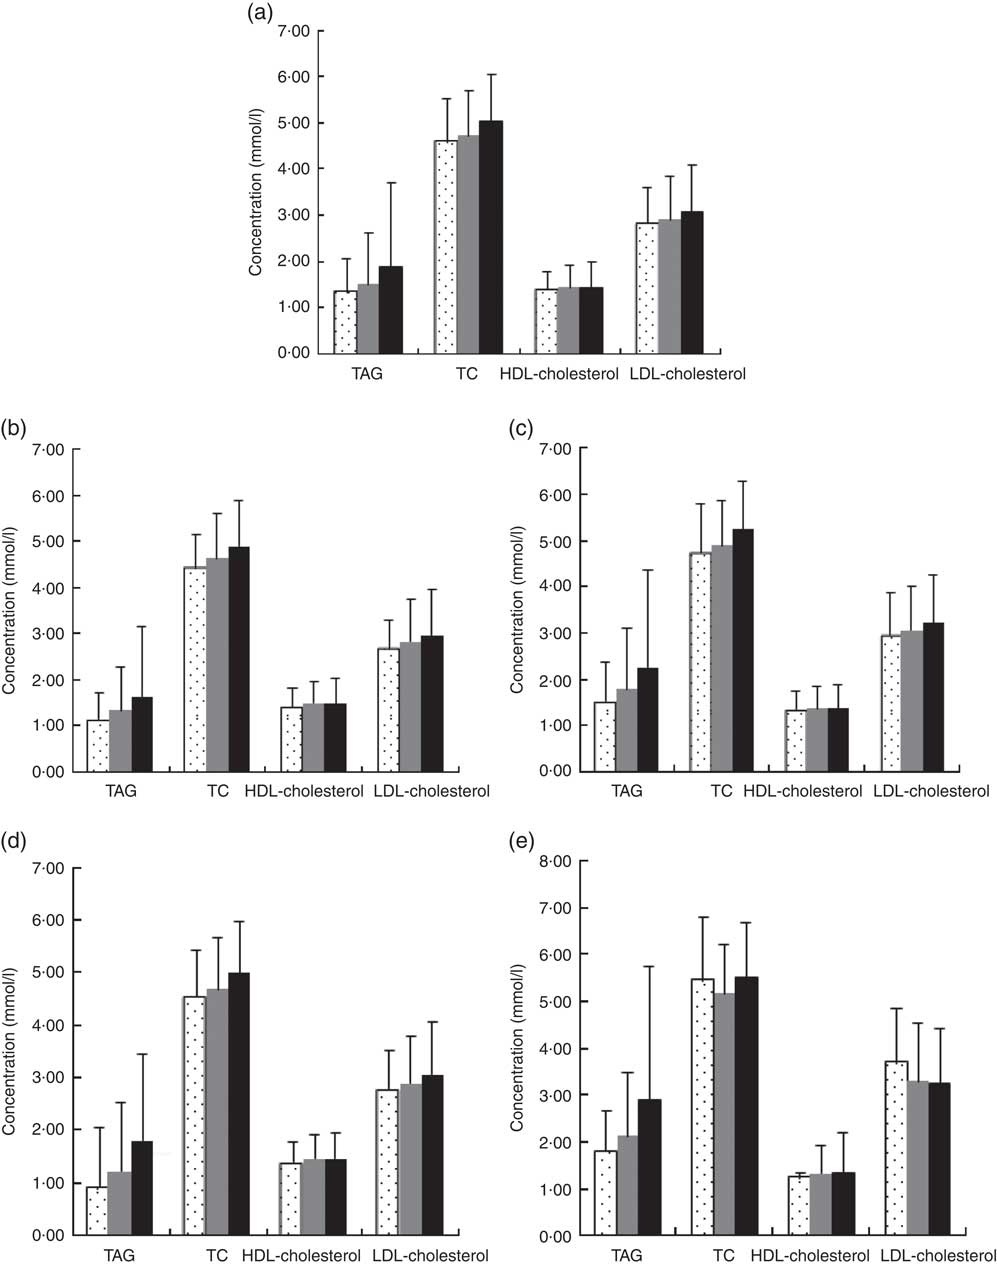
Fig. 1 Blood lipids according to type 2 diabetes (T2D) and central obesity status. (a) All subjects group, mean TAG, total cholesterol (TC), HDL-cholesterol, LDL-cholesterol (1·68, 4·87, 1·44, 2·98 mmol/l), (b) no central obesity group, mean TAG, TC, HDL-cholesterol, LDL-cholesterol (1·47, 4·74, 1·48, 2·88 mmol/l), (c) central obesity group, mean TAG, TC, HDL-cholesterol, LDL-cholesterol (2·02, 5·07, 1·37, 3·14 mmol/l), (d) No T2D group, mean TAG, TC, HDL-cholesterol, LDL-cholesterol (1·60, 4·82, 1·45, 2·96 mmol/l) and (e) T2D group, mean TAG, TC, HDL-cholesterol, LDL-cholesterol (2·52, 5·34, 1·33, 3·27 mmol/l). Values are means and 95 % CI represented by vertical bars. ![]() , Low magnesium ≤0·65 mmol/l;
, Low magnesium ≤0·65 mmol/l; ![]() , normal magnesium 0·65–0·95 mmol/l;
, normal magnesium 0·65–0·95 mmol/l; ![]() , high magnesium ≥0·95.
, high magnesium ≥0·95.
Statistical methods
Differences between Mg groups in socio-demographic and clinical characteristics were evaluated by ANOVA for continuous variables and χ 2 test for categorical variables. In particular, we calculated and tested the differences in blood lipids among the three Mg groups and among T2D (yes/no) and central obesity (yes/no) subgroups.
A generalised linear model of blood lipids (TAG, TC, HDL-cholesterol LDL-cholesterol) and Mg (three groups) was built adjusting for covariates, which included age (continuous), sex, BMI (continuous), WC (continuous), T2D (yes/no), anti-diabetic drug treatment (yes/no), insulin injection (yes/no), blood pressure(continuous), energy intake (continuous), fat intake (continuous), protein intake (continuous), carbohydrate intake (continuous), HbA1c (%), urea (continuous), uric acid (continuous), apoA-1 (continuous), apoB (continuous), lipoprotein (continuous), creatinine (continuous) and insulin (continuous).
Separate adjusted models were also built for subjects with or without T2D. As a sensitivity analysis, we performed more parsimonious models, excluding adjustments for some variables dealing with possible collinearity among some covariates. P values <0·05 were considered to be statistically significant.
Results
A total of 8163 subjects (mean age 50·9 years, 46·7 % males) were included in this analysis. Most of them (91·7 %) were without T2D and 38·4 % of the subjects had central obesity. The mean values of blood lipids (TAG, TC, HDL-cholesterol and LDL-cholesterol) were 1·33, 4·59, 1·38 and 2·82 mmol/l.
Approximately 8·3 % of the population had T2D. As presented in Table 1, the serum Mg of 52·2 % was at a normal level, 1 % at a low level (≤0·65 mmol/l) and 46·8 % at a high level (≥0·95 mmol/l). Subjects with a high level of serum Mg were characterised by significantly older age (P<0·0001), higher blood pressure (P<0·0001) and a higher WC (in males) (P<0·0001), but these differences were not clinically meaningful.
Table 1 Sample characteristics according to magnesium status (Mean values and standard deviations; numbers and percentages)
T2D, type 2 diabetes.
As the level of serum Mg increased, there was a significantly higher prevalence of T2D and a higher biochemical indicator (P<0·01), with the exception of apoA-1 and lipoprotein values.
Table 2 shows blood lipid values in the whole group, according to central obesity category and Mg status. A significant increase in blood lipids, with the exception of HDL-cholesterol, across progressive Mg groups (from low Mg level ≤0·65 mmol/l, normal level 0·65–0·95 mmol/l to high level≥0·95 mmol/l) in all subjects was noted (P<0·05). This phenomenon was also detected in subgroups, regardless of whether they were with central obesity or not. In addition, when compared with those of the group without central obesity, the mean increments of TAG, TC, HDL-cholesterol and LDL-cholesterol of subjects with central obesity were 1·52, 4·75, 1·36 and 2·97 mmol/l in the group with Mg level ≤0·65 mmol/l; 1·79, 4·9, 1·37 and 3·07 mmol/l in the group with Mg level of 0·65–0·95 mmol/l; and 2·26, 5·25, 1·36 and 3·21 mmol/l in the group with Mg level ≥0·95 mmol/l. TAG, TC, HDL-cholesterol and LDL-cholesterol were significantly higher among subjects with central obesity compared with those without central obesity (P<0·05).
Table 2 Blood lipid values according to central obesity and magnesium status (Mean values and standard deviations)
TC, total cholesterol.
Data of subjects with and without T2D are presented in Table 3. As depicted in Table 3, a significant increase in TAG, TC and LDL-cholesterol across progressive Mg groups was observed in subjects without T2D (P<0·05). However, no significant change of HDL-cholesterol and LDL-cholesterol across progressive Mg groups was observed in subjects with T2D (P>0·05). In addition, TAG, TC, HDL-cholesterol and LDL-cholesterol were significantly higher among subjects with T2D than those without T2D (P<0·05).
Table 3 Blood lipid values according to central obesity and magnesium status in patients without type 2 diabetes (T2D) and in patients with T2D (Mean values and standard deviations)
TC, total cholesterol.
Multivariable analysis of blood lipids with magnesium
The generalised linear model showed that after full adjustment of demographic characteristics, lifestyles, dietary factors and clinic variables (including T2D, blood glucose, level, anti-diabetic drugs treatment, insulin injection, blood pressure, Urea, Uric Acid, apoA-1, apoB, lipoprotein, creatinine, insulin), TAG, TC, HDL-cholesterol and LDL-cholesterol were significantly higher among subjects with a higher level of Mg≥0·95 mmol/l than those with a lower level (P<0·05). According to the 95 % CI, there was no significant difference between subjects with a serum Mg level ≤0·65 mmol/l and those with a level of 0·65–0·95 mmol/l.
Multivariable models for TAG and LDL-cholesterol failed to attain statistical significance in subjects with T2D. When the parsimonious model was used, the aforementioned general pattern was quite similar (Table 4). Therefore, this phenomenon was noted to be quite similar among subjects with T2D, by using a generalised linear model or parsimonious model.
Table 4 Generalised linear model of the association between blood lipids and magnesium according to type 2 diabetes (T2D) status (Mean values and 95 % confidence intervals)
TC, total cholesterol.
* Models were adjusted for demographic characteristics, lifestyles, dietary factors and clinic variables (including T2D, blood glucose, level, anti-diabetic drugs treatment, insulin injection, blood pressure, urea, uric acid, apoA-1, apoB, lipoprotein, creatinine and insulin).
† The parsimonious model adjusted for the same variables as the full model except for some variables dealing with possible collinearity among some covariates.
Discussion
There were significant correlations between abdominal obesity indicators and lipid levels in previous studies( Reference Rocha, Menezes and Melo 21 , Reference Ali, Cerjak and Kent 22 ). Our study supported this view that there was a positive correlation between serum lipids and central obesity (P<0·05). Thus, the central obesity factor needs to be adjusted to, while detecting the relationship between Mg and lipids.
The previous study shows that low Mg levels are related to T2D mellitus and its complications( Reference Tossiello 23 ). It is believed that low Mg levels are conducive to the development of insulin resistance( Reference Srinivasan, Niranjan and Kuzhandai Velu 24 , Reference Choi, Kim and Chung 25 ). The role of low Mg levels in the development of diabetic complications has been convincingly presented by Corsonello et al.( Reference Corsonello, Ientile and Buemi 26 ) and Xu et al.( Reference Xu, Sun and Deng 27 ), who suggested that serum concentrations of Mg correlate inversely with micro-albuminuria. In the study by Rasheed et al. ( Reference Rasheed, Elahi and Ajaz 17 ), serum Mg in diabetic patients was correlated with all lipid parameters. Among them, HDL-cholesterol was significantly (P<0·05) positively correlated (r 0·34), whereas TC and LDL-cholesterol were negatively correlated, albeit non-significantly, with serum Mg.
However, Jiancheng et al.( Reference Xu, Xu and Yao 28 ) failed to show any association between serum Mg and lipid profile in diabetic patients with or without complications. Meanwhile, Guerrero-Romero & Rodriguez-Moran( Reference Guerrero-Romero and Rodriguez-Moran 29 ) showed that in patients with T2D mellitus hypomagnesaemia is linked with low levels of HDL, irrespective of serum glucose level.
In our study, a significant increase of HbA1c (%), insulin and blood lipids, with the exception of HDL-cholesterol, across progressive Mg groups in all subjects was noted (P<0·05). T2D hindered the positive association between LDL-cholesterol and serum Mg. However, this positive association was still noted in subjects without T2D.
Lipid disturbance (higher TAG, TC and LDL with lower HDL) is most pronounced in diabetic children with hypomagnesaemia compared with those with normal serum Mg. A negative correlation is noted between serum Mg and TAG (r 0·636, P<0·001), TC (r 0·743, P<0·001) and LDL (r 0·634, P<0·001). However, there was a positive correlation between serum Mg and HDL (r 0·639, P<0·001)( Reference Shahbah, El Naga and Hassan 30 ). Our study results are consistent with this study on type 2 diabetic patients by using a generalised linear model or parsimonious model.
Meanwhile, statistically significant positive correlations between Mg concentration and TC or LDL concentration were found in middle-aged and older men( Reference Rotter, Kosik-Bogacka and Dołęgowska 31 ). These results are in concordance with the study by Mishra et al ( Reference Mishra, Padmanaban and Deepti 32 ) on type 2 adult diabetic patients that revealed a negative correlation between serum Mg and TAG (r 0·519, P<0·01) and a positive correlation between serum Mg and HDL (r 0·741), but did not show any significant correlation between TC or LDL with serum Mg. Moreover, Srinivasan et al.( Reference Srinivasan, Niranjan and Kuzhandai Velu 24 ) revealed a negative correlation between serum Mg and TAG (P<0·05), especially in poorly controlled diabetics (r 0·632), and Rasheed et al.( Reference Rasheed, Elahi and Ajaz 33 ) revealed a positive correlation between serum Mg and HDL (r 0·34, P<0·01), but there was a non-significant correlation with other lipid parameters.
Guerrero-Romero & Rodriguez-Moran( Reference Guerrero-Romero and Rodriguez-Moran 34 ) suggests that hypomagnesaemia contributes to lower HDL. Similarly, Randell et al.( Reference Randell, Mathews and Gadag 35 ) found positive correlations between Mg and TC and between Mg and LDL. In contrast, the results of Mahalle et al.( Reference Mahalle, Kulkarni and Naik 36 ) indicate that lower Mg levels are associated with higher TC and LDL, and lower HDL.
Our study results are quite similar to Mahalle’s view, by using generalised linear model or parsimonious model. Some of the conflicting studies whose results (lower Mg levels associated with lower blood lipids) confused us might be attributed to insufficient adjustment for confounders. In our study, there was no significant difference between subjects with the serum Mg level ≤0·65 mmol/l and those with the level of 0·65–0·95 mmol/l, by using a generalised linear model or parsimonious model.
Many studies show the relationship between Mg intake or status, and the prevalence of chronic diseases: hypertension, lipid disorders and the presence of CVD and the metabolic syndrome( Reference Swaminathan 37 , Reference Huang, Lu and Cheng 38 ). Nevertheless, in a study on patients with the metabolic syndrome, Mg supplementation (3 months, 400 mg/d) had no effect on improving lipid and carbohydrate metabolism( Reference Lima de Souza, Silva Mde and Cruz 39 ). However, in patients with T2D, 3 months of oral Mg supplementation resulted in significantly reduced LDL and fasting glucose compared with the control group receiving placebo( Reference Solati, Ouspid and Hosseini 40 ). Although there was no Mg supplement in our study, one thing is for sure, T2D hindered the metabolism between Mg and blood lipids according to our study and these papers. This effect can be explained by the role of Mg in the activity of lipoprotein lipase enzyme as described by Rayssiguire and colleagues( Reference Rayssiguier and Gueux 41 ). Meanwhile, there is a close correlation between T2D and lipase enzyme activity( Reference Liu, Gao and Tang 42 ).
Our research has several limitations. First, although we have corrected a number of confounding factors, we lack data regarding blood n-3 levels in our study, which may affect the blood lipid profile. Second, further studies are necessary to explore the precise reasons for the observed metabolism change influenced by T2D. Third, we lack data regarding lipoprotein lipase enzyme levels in our study, which may explore fundamental metabolism. Fourth, we lack data regarding Mg intake from diet. Fifth, the cross-sectional analysis of data does not allow causal assessment of the relationship studied. Sixth, despite exhaustive adjustments and stratifications used, we recognise that animal experiments are necessary to prove the results. We hope that future studies are conducted to address this area.
In summary, because a positive correlation between serum lipids and Mg was observed, Mg status in high level (≥0·95 mmol/l) is an adverse signal for high blood lipids. Mg status at a high level (≥0·95 mmol/l) is often accompanied by the high blood lipids, as shown in Table 4. In Table 4, the results were adjusted for most of the confounders in this research. As T2D hindered the metabolism between Mg and blood lipids through lipase enzyme activity, prevention of T2D is very important in the protection of endocrine function. TAG, TC, HDL-cholesterol and LDL-cholesterol were significantly higher among subjects with T2D or central obesity than those without T2D or central obesity (P<0·05). Meanwhile, the level of blood lipids (with the exception of HDL-cholesterol) was associated with that of serum Mg, but this association was somehow hindered by T2D in LDL-cholesterol. In addition, both multivariable models for TAG and LDL-cholesterol failed to attain statistical significance among subjects with T2D, different from those without T2D. This new finding is attributed to our sufficient adjustment for confounders.
Acknowledgements
This research uses data from the China Health and Nutrition Survey (CHNS). The authors thank the National Institute for Nutrition and Health, China Center for Disease Control and Prevention, Carolina Population Center (P2C HD050924, T32 HD007168), the University of North Carolina at Chapel Hill, the National Institutes of Health (NIH) (R01-HD30880, DK056350, R24 HD050924 and R01-HD38700) and the NIH Fogarty International Center (D43 TW009077, D43 TW007709) for financial support for the CHNS data collection and analysis files from 1989 to 2015 and future surveys, and the China-Japan Friendship Hospital, Ministry of Health for support for CHNS 2009, Chinese National Human Genome Center at Shanghai since 2009 and Beijing Municipal Center for Disease Prevention and Control since 2011.
L. Y., J. Z. and L. W. contributed to the study concept, design and supervision; the analysis and interpretation of the data; and the drafting and critical revision of the manuscript for important intellectual content. S. L., Q. Z. and P. X. contributed to the analysis and interpretation of the data, and to critical revision of the manuscript for important intellectual content. K. W., M. Z. and Y. J. contributed to administrative, technical and material support for the study; to the analysis and interpretation of the data; and to critical revision of the manuscript for important intellectual content.
The authors declare that there are no conflicts of interest.


