


Obesity is a major global public health issue. A BMI (the weight in kg divided by the square of the height in m) ≥30 kg/m2 is categorised as obesity, and 13 % of adults aged 18 years or older had BMI ≥ 30 kg/m2 in 2016 globally(1). From 1975 to 2014, obesity increased from 3·2 % to 10·8 % in men and from 6·4 % to 14·9 % in women(2). Excess body weight accounted for 4·0 million deaths and 120 disability-adjusted life years in 2015(3). Overweight and obesity increase diabetes, hypertension, heart disease and osteoarthritis(Reference Malnick and Knobler4). Meta-analyses showed that a high BMI (≥25 kg/m2) was associated with a higher risk of all-cause mortality(Reference Flegal, Kit and Orpana5,Reference Di Angelantonio, Bhupathiraju and Wormser6) .
Recently, many studies reported that eating and drinking habits including eating speed, skipping breakfast and alcohol consumption were associated with increased risk of overweight and obesity(Reference Hurst and Fukuda7–Reference Maruyama, Sato and Ohira21). However, most studies were cross-sectional, and few studies have evaluated the longitudinal association between these habits and the risk of obesity in healthy individuals.
Therefore, we conducted a 5-year longitudinal big data analysis for evaluating various eating and drinking habits and the risk of obesity using a large-scale health check-up (HC) database, which includes company employees and their families.
Methods
Study design and data source
In 2008, the Japanese Ministry of Health, Labour and Welfare introduced annual health screening and health promotion services called ‘Specific Health Checkups and Specific Health Guidance.’ Every citizen aged 40–74 years can receive a questionnaire survey of lifestyle, laboratory tests and anthropometric values for diabetes, dyslipidaemia, hypertension and the metabolic syndrome(Reference Fukasawa, Tanemura and Kimura22).
The retrospective longitudinal study used the JMDC-HC database (JMDC Inc.) from 1 January 2008 to 30 September 2018. The database contains data of employees (mainly from large-scale companies) and their families from employees’ health insurers(Reference Fukasawa, Tanemura and Kimura22). The JMDC-HC database includes the following information: sex, date of birth, date of HC; measured anthropometric measurements such as BMI and waist circumference (WC); measured laboratory values including systolic blood pressure (BP), diastolic BP, LDL-cholesterol, HDL-cholesterol, TAG, aspartate aminotransferase, alanine aminotransferase and γ-glutamyl transpeptidase. The database also included a self-administered questionnaire of lifestyle behaviours (current smoking, regular exercise, dietary, drinking and sleeping habits); medication use for hypertension, dyslipidaemia and diabetes mellitus; and history of heart disease, stroke and kidney disease.
The present study was approved (R1989) by the ethics committee of Kyoto University. Informed consent was waived because of the use of anonymous data.
Participants
We included adults aged 20 years or older, who received initial HC between 2008 and 2012, and 5 years later from the initial HC. We excluded people who had at least one missing variable in baseline data; have a history of heart disease, stroke or kidney disease to exclude severely ill patients; with BMI ≥ 25 kg/m2, or WC ≥ 85 cm for men and 90 cm for women at baseline to examine the incidence of obesity and abdominal obesity. Although the WHO categorised BMI ≥ 25 kg/m2 as overweight and BMI ≥ 30 kg/m2 as obesity, the Japan Society for the Study of Obesity defined BMI ≥ 25 kg/m2 as obesity and WC ≥ 85 cm for men and 90 cm for women as abdominal obesity because only 2–3 % Japanese have BMI ≥ 30 kg/m2, and mild excess of adiposity introduces glucose intolerance and complications in Japanese population(23). With this definition, 30·7 % of men and 21·9 % of women with a BMI ≥ 25 kg/m2 in Japan had obesity(24).
Variables
We defined BMI ≥ 25 kg/m2 at fifth-year HC as the primary outcome and abdominal obesity (WC ≥ 85 cm for men and ≥ 90 cm for women) as the secondary outcome.
Exposure variables consisted of eating and drinking habits based on a self-reported questionnaire from HC. These habits include the following variables: eating speed (I eat faster than other people: fast/normal/slow), late dinner (I have dinner within 2 h before bedtime at least 3 times a week: yes/no), late snacking (I have snack after dinner at least 3 times a week: yes/no), skipping breakfast (I does not have breakfast at least 3 times a week: yes/no), drinking habit including frequency of drinking alcoholic beverages (none or rarely/occasionally/daily) and amount of alcohol per d when they drink alcohol (<20 g/20–40 g/40–60 g/≥ 60 g).
From the baseline HC data, the following variables were extracted as covariates: age, sex, current smoking status (I am a current smoker: yes/no), regular exercise (I exercise 30 min or longer, 2 d or more a week: yes/no), physical activity (I walk ≥1 h/d or have equivalent physical activity: yes/no), walking fast (I walk faster than other same age people: yes/no), insufficient sleep (I have enough sleep: yes/no), measured baseline anthropometric measures (BMI and WC); measured laboratory values (systolic BP, diastolic BP, LDL-cholesterol, HDL-cholesterol, TAG, aspartate aminotransferase, alanine aminotransferase and γ-glutamyl transpeptidase); weight gain ≥ 10 kg from 20 years (yes/no), and weight change ≥ 3 kg in the preceding year (yes/no); drug use for hypertension, dyslipidaemia and diabetes (yes/no) and calendar year at baseline.
Statistical analysis
Continuous variables were summarised by medians and interquartile ranges; binary and categorical variables were summarised by numbers and percentages. Age–sex-adjusted, and multivariable logistic regression analyses were performed for the incidence of obesity and abdominal obesity; OR and 99 % CI were estimated. Covariates in multivariable analyses were listed above. We did not apply any statistical variable selection such as the stepwise method, and we chose clinically important covariates in the model. We also checked multicollinearity with the variance inflation factor. To check the consistency of the primary analyses, we conducted linear regression analyses with the outcome of the difference of BMI or WC as sensitivity analyses. To account for multiple testing, all reported P values were two-sided and P < 0·01 was considered statistically significant. All statistical analyses were performed using SAS version 9.4 (SAS Institute Inc.).
Results
In the JMDC-HC database, 620 932 adults received HC at least once between 2008 and 2012. Among them, 497 750 were excluded according to the exclusion criteria. Of all people, 123 182 people who received an HC after 5 years were included in this study (Fig. 1).

Fig. 1. Study flow chart. WC, waist circumference
Table 1 shows the baseline characteristics. Median age was 45 (interquartile range 40, 51) years, and 76 965 (62·5 %) were men. Individuals who developed obesity tended to be younger; had non-healthy lifestyles, such as current smoking, eating fast, skipping breakfast, large amount of alcohol consumption and insufficient sleep; experienced weight gain from 20 years or weight change in the preceding year; received drugs for hypertension and dyslipidaemia; and had higher anthropometric and laboratory values, including BMI, WC, systolic BP, diastolic BP, LDL-cholesterol and TAG. On the other hand, many individuals who did not develop obesity were daily drinkers (Table 1).
Table 1. Baseline characteristics for the whole sample and for those who developed or not developed obesity during the 5 years of follow-up*
(Medians and interquartile ranges (25 %, 75 %); numbers and percentages)
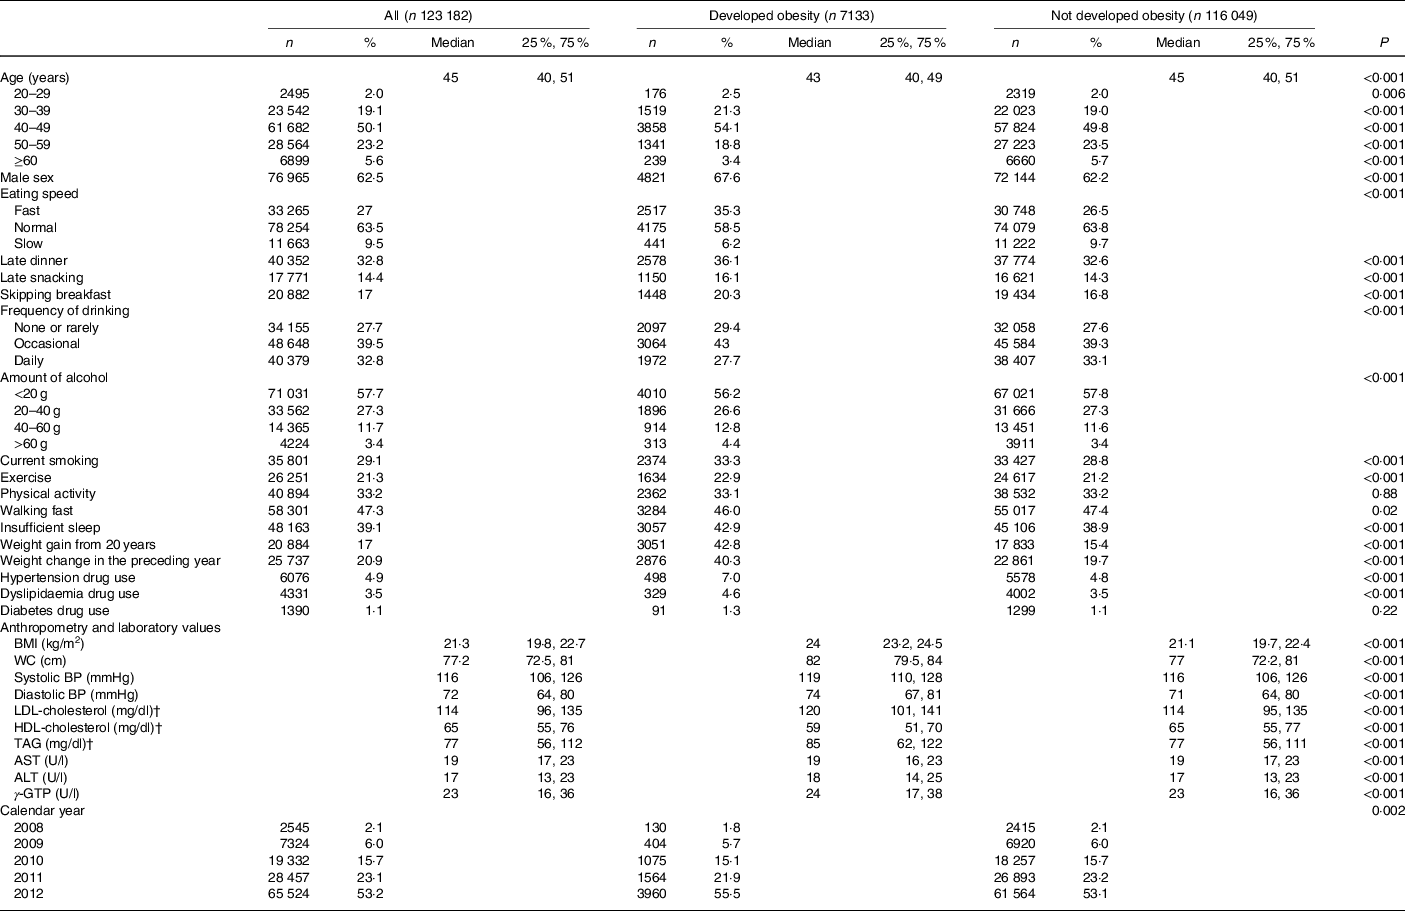
WC, waist circumference; BP, blood pressure; AST, aspartate aminotransferase; ALT, alanine aminotransferase; GTP, glutamyl transpeptidase.
* The Wilcoxon rank sum test was used for continuous variables, and the χ 2 test was used for categorical variables to calculate P value.
† To convert cholesterol in mg/dl to mmol/l, multiply by 0·0259. To convert TAG in mg/dl to mmol/l, multiply by 0·0113.
Table 2 shows the association between eating and drinking habits and the risk of obesity; 7133 (5·8 %) people developed obesity after 5 years. Skipping breakfast (OR 1·21; 99 % CI 1·10, 1·34) was associated with higher risks of obesity in men, whereas occasional (OR 0·86; 99 % CI 0·78, 0·94) or daily (OR 0·72; 99 % CI 0·64, 0·81) drinking of alcoholic beverages was associated with a lower risk of obesity (Table 2).
Table 2. Logistic regression analyses for obesity
(Odds ratios and 99 % confidence intervals)

WC, waist circumference; BP, blood pressure; AST, aspartate aminotransferase; ALT, alanine aminotransferase; GTP, glutamyl transpeptidase.
* Adjusted for age, sex; eating speed, late dinner, late snacking, skipping breakfast, frequency of drinking, amount of alcohol; current smoking, regular exercise, physical activity, walking fast, insufficient sleep; baseline anthropometric measures (BMI and WC); laboratory values (systolic BP, diastolic BP, LDL-cholesterol, HDL-cholesterol, TAG, AST, ALT and γ-GTP); weight gain ≥10 kg from 20 years, weight change ≥3 kg in the preceding year; drug use for hypertension, dyslipidaemia, and diabetes and calendar year.
Table 3 shows the associations between eating and drinking habits and abdominal obesity; 12 725 (10·3 %) people developed abdominal obesity after 5 years. Late snacking (OR 1·09; 99 % CI 1·01, 1·18) and skipping breakfast (OR 1·21; 99 % CI 1·13, 1·30) were associated with a high risk of abdominal obesity, whereas occasional (OR 0·91; 99 % CI 0·84, 0·99) or daily (OR 0·85; 99 % CI 0·78, 0·93) drinking of alcohol beverages was associated with a low risk of abdominal obesity (Table 3).
Table 3. Logistic regression for abdominal obesity
(Odds ratios and 99 % confidence intervals)

WC, waist circumference; BP, blood pressure; AST, aspartate aminotransferase; ALT, alanine aminotransferase; GTP, glutamyl transpeptidase.
* Adjusted for age, sex; eating speed, late dinner, late snacking, skipping breakfast, frequency of drinking, amount of alcohol; current smoking, regular exercise, physical activity, walking fast, insufficient sleep; baseline anthropometric measures (BMI and WC); laboratory values (systolic BP, diastolic BP, LDL-cholesterol, HDL-cholesterol, TAG, AST, ALT and γ-GTP); weight gain ≥ 10 kg from 20 years, weight change ≥ 3 kg in the preceding year; drug use for hypertension, dyslipidaemia, and diabetes and calendar year.
Online Supplementary Tables S1 and S2 show the associations between eating and drinking habits and the difference of BMI and WC, respectively. Skipping breakfast was associated with the increase in BMI, and occasional or daily drinking of alcohol beverages, and 20–40 g alcohol consumption were associated with the decrease in BMI (online Supplementary Table S1). Fast eating, late dinner and skipping breakfast were associated with the increase in WC, and slow eating and daily drinking of alcohol beverages were associated with the decrease in WC (online Supplementary Table S2).
Discussion
In this 5-year retrospective longitudinal big data analysis, we evaluated the association between various eating and drinking habits and the risks of obesity and abdominal obesity at 5 years using the JMDC-HC database. Multivariable logistic regression analyses revealed that frequent drinking of alcoholic beverages was associated with a lower risk of obesity and abdominal obesity. In contrast, skipping breakfast was associated with a higher risk of obesity and abdominal obesity. Late snacking was associated with a high risk of abdominal obesity, but not associated with obesity. According to the longitudinal design and the adjustment of major confounding factors, including smoking status and physical activity, we could evaluate these unbiased associations without reverse causation.
Our results were consistent with previous studies that evaluated the association between eating and drinking habits and the risk of obesity. Frequent drinking of alcoholic beverages was inversely associated with the risk of obesity than non-or-rarely drinking. Although the amount of alcohol was associated with the risk of obesity and abdominal obesity after age-adjusted, the amount of alcohol consumption was not significantly associated with the onset of obesity and abdominal obesity after multivariable adjustment except for abdominal obesity in women. A drinking habit provides energy from alcohol (7·1 kcal (29·7 kJ)/1 g of alcohol), and other dietary sources fit with alcohol drinking, but a clear cause–effect association between alcohol intake and weight gain is not still clear(Reference Traversy and Chaput9). A systematic review showed that heavy drinking might cause weight gain, but low to moderate drinking may prevent weight gain(Reference Sayon-Orea, Martinez-Gonzalez and Bes-Rastrollo10). Another systematic review revealed that a higher beer consumption (>500 ml/d) might be associated with abdominal obesity(Reference Bendsen, Christensen and Bartels11). Besides, a recent longitudinal study reported that increased alcohol consumption was associated with weight gain(Reference Downer, Bertoia and Mukamal12). On the other hand, the evaluation between frequency of drinking alcoholic beverages and obesity is scarce. A cross-sectional study in France showed that daily alcohol intake was associated with smaller anthropometric indicators(Reference Dumesnil, Dumesnil and Dauchet13). As we know, our study is the first longitudinal study that evaluated the frequency of drinking alcoholic beverages and obesity and our results may have added an insight that not only low to moderate amount of alcohol consumption but also frequency of drinking alcoholic beverages may be useful for obesity management.
Skipping breakfast was associated with subsequent obesity. It is commonly reported that ‘breakfast is the most important meal of the day(Reference O’Neil, Byrd-Bredbenner and Hayes25),’ but 17 % of participants skipped breakfast in the present study. Kito et al. evaluated the association of eating habits and obesity using the JMDC-HC database(Reference Kito, Kuriyama and Takahashi8). Skipping breakfast was associated with the risk of obesity, but late dinner was not statistically significant. We observed similar results in the present study. A cross-sectional study (Third National Health and Nutrition Examination Survey; NHANES III) reported that people who skipped breakfast or ate meat and eggs had higher BMI than those who ate cereals and bread(Reference Cho, Dietrich and Brown14). Similarly, a systematic review of cross-sectional studies reported that skipping breakfast was associated with the risk of obesity in the Asia–Pacific region(Reference Horikawa, Kodama and Yachi15). In contrast, a recent systematic review of randomised controlled trials reported that breakfast intake increased body weight and energy intake in short periods(Reference Sievert, Hussain and Page16). The reason for this discrepancy is unclear, but the maximum study period in the preceding randomised trials was only 16 weeks. Therefore, we believe that the long-term effectiveness of breakfast is still debatable.
Regarding eating speed, fast and slow eating were associated with high and low risk of obesity with the age-adjusted model but not significantly associated with the multivariable model. Hurst et al. (Reference Hurst and Fukuda7) reported that the change in eating speed was associated with the incidence of obesity in diabetic patients, and our results were not consistent with their results even though the same database was used. In a meta-analysis, Ohkuma et al. (Reference Ohkuma, Hirakawa and Nakamura17) reported that fast eating was positively associated with excess body weight. Cross-sectional and longitudinal studies also showed that fast eating was significantly associated with weight gain(Reference Tanihara, Imatoh and Miyazaki18–Reference Maruyama, Sato and Ohira21). The discrepancies in the result from the previous studies may be owing to the different population or outcomes, longitudinal design or adjustment of a lot of confounders.
Our results could be implemented for the health promotion of modifiable eating habits, such as eating speed and skipping breakfast. As less energy intake can be achieved by reducing the eating rate without increasing hunger, such promotions are expected to reduce obesity(Reference Robinson, Almiron-Roig and Rutters26). Meanwhile, at this moment, we do not intend to encourage daily drinking as a health promotion strategy. This is because the large amount of alcohol intake may be associated with obesity and abdominal obesity, although such relationship was not statistically significant. Furthermore, alcohol is known as a risk factor for many disease and injury, such as alcohol dependence(Reference Griswold, Fullman and Hawley27). Mild to moderate drinking focusing on both the frequency and amount for better health, such as obesity management, might be worth to consider while conducting future research(Reference Zhang, Shen and Miles28). However, excess alcohol consumption would be harmful and should be avoided.
This study has some limitations. First, reliability and granularity of some variables may be insufficient because these variables were derived from the self-reported questionnaire of the annual HC rather than from research. Therefore, the type of alcohol (beer, wine, etc.), past pattern of drinking such as nondrinker or past drinker, is not discernible because the classification in the questionnaire is not sufficiently detailed. Besides, the total energy intake was also not available, and the insufficient data may result in some unmeasured confounding in our analyses.
Second, the generalisability of the present study is unclear. Our study included few people aged 70 years or older because the JMDC database consists of company employees and their families who are relatively young. Fukasawa et al. acknowledged that the population included in the JMDC-HC database was younger and had fewer lifestyle diseases than the population included in the National Health and Nutrition Survey(Reference Fukasawa, Tanemura and Kimura22). Therefore, the results of the present study need caution for applying to other populations, such as elderly and self-employees.
Third, the socio-economic factors are inversely associated with the risk of obesity, especially in women in developed countries(Reference McLaren29), but these factors are not included in this database. However, we assume that the socio-economic factors are relatively homogeneous because the database constitutes company employees and their families whose socio-economic status is relatively similar. Therefore, the adaptation of our results to self-employed and older people is difficult.
Finally, in our study, many people were excluded because they had missing variable in baseline data or did not receive a fifth-year HC. If baseline characteristics between included and excluded people were different, the results might have been biased owing to the missing values.
Conclusion
In conclusion, according to the 5-year longitudinal data, eating and drinking habits, such as mild to moderate alcohol consumption and avoiding skipping breakfast, may result in better obesity prevention. However, excess alcohol consumption would be harmful and should be avoided. A prospective longitudinal study would be necessary to confirm the association between eating and drinking habits and obesity.
Acknowledgements
The study was sponsored by Suntory Beverage & Food Ltd. The sponsor was involved in the design of the study and the interpretation of the results. This research is, in part, financially supported by the Project Promoting Clinical Trials for Development of New Drugs (grant number: 19lk0201061h0004) from the Japan Agency for Medical Research and Development (AMED).
T. S., M. T. and K. K. were responsible for study concept and design. K. K. obtained funding. T. S. acquired the data, and all authors were involved in analysis and interpretation of data. T. S. drafted the manuscript, and all authors reviewed the final manuscript and agreed to be accountable for all aspects of the work and approved the final manuscript for submission. The corresponding author attests that all listed authors meet authorship criteria and that no others meeting the criteria have been omitted.
K. K. is responsible for the joint research programme with the sponsor and is an advisor at JMDC Inc. T. S. is employed using the research fund of a joint research programme with the sponsor. M. T. has nothing to declare.
Supplementary material
For supplementary material referred to in this article, please visit https://doi.org/10.1017/S0007114521000179


