


Efforts to overcome the limitations of evaluating single nutrients and foods in isolation have led to a gradual shift in emphasis to the evaluation of dietary patterns(Reference Hebert, Shivappa and Wirth1,Reference Hu2) . Although the investigation of dietary patterns is generally performed in terms of the daily intake of individual foods or food groups(Reference Newby and Tucker3–Reference Hearty and Gibney6), an increasing number of studies have focused on dietary intake at the level of specific eating occasions (i.e. breakfast, lunch, dinner and snack) or meal patterns(Reference Kerver, Yang and Obayashi7–Reference Leech, Worsley and Timperio9). Studying dietary patterns at the meal level in the context of overall dietary patterns may be more pertinent when considering synergies and interactions during digestion and metabolism(Reference Jacobs and Steffen10). Characterising different meal types is particularly important because the same foods are not always consumed in the same proportions at each meal, resulting in meal-specific food combinations and different nutritional qualities by meal types(Reference Andersson, Nydahl and Gustafsson11–Reference Murakami, Livingstone and Sasaki15). This dietary information would be more relevant for formulating meaningful meal-based dietary guidelines and public health messages as well as for developing effective intervention strategies for promoting healthy eating.
Recent studies have suggested that not only the amount and type of food intake but also the circadian timing of food intake need to be considered, given that food intake, appetite, digestion and metabolism each exhibit circadian patterns(Reference Arble, Bass and Laposky16–Reference Almoosawi, Vingeliene and Karagounis18). For example, in a British cohort, increasing energy intake from carbohydrates at the expense of a similar amount of energy from fat at breakfast and at mid-morning at the age of 43 years was associated with decreased prevalence of the metabolic syndrome 10 years later(Reference Almoosawi, Prynne and Hardy19). Another 6-year prospective cohort study in Italy has shown that a higher intake of energy at dinner was associated with higher incidence of obesity, the metabolic syndrome and non-alcoholic fatty liver disease(Reference Bo, Musso and Beccuti20). Further, a traditional wheat-based breakfast identified by factor analysis was associated with a decreased risk of hyperglycaemia in a 6-year prospective cohort study in Chinese adults, whereas rice-based traditional lunch and dinner were associated with an increased risk(Reference Shi, Riley and Taylor21). Additionally, a 3-year prospective cohort study showed that an even distribution of daily protein intake across meals was independently associated with greater muscle strength, but not with the mobility score, in older Canadian adults(Reference Farsijani, Payette and Morais22).
Unfortunately, research on these topics is constrained by the fact that the primary method of dietary assessment currently employed in most cross-sectional and prospective cohort studies is FFQ, which precludes an informed evaluation of the timing of dietary intake and meal-specific dietary intake(Reference Almoosawi, Vingeliene and Gachon23). This kind of information can be derived from more detailed dietary assessment methods such as dietary record (DR) and 24-h dietary recall(Reference Leech, Worsley and Timperio9). However, when using these methods, collection of dietary data over multiple days is essential for the assessment of habitual intake at the individual level and is still not always feasible because of its expensive and burdensome nature(Reference Willett24). Taken together, the development of dedicated fit-for-purpose methodology for collecting data on meal patterns and time of day of dietary intake which is also inexpensive to administer and has low participant burden is required to efficiently advance this new research field(Reference Leech, Worsley and Timperio9).
In this study, we developed the Meal-based Diet History Questionnaire (MDHQ), a self-administered questionnaire designed for estimating food and nutrient intakes for each meal type separately. This was done based on actual food consumption data obtained from a Japanese population.
Methods
General concept of the Meal-based Diet History Questionnaire
Our main aim was to develop a self-administered diet-history type questionnaire for estimating food and nutrient intakes for each meal type separately (i.e. MDHQ). We also intended that the time taken to complete the MDHQ should be a compromise between that taken to complete the 288-item Diet History Questionnaire (DHQ; 30–45 min)(Reference Sasaki, Yanagibori and Amano25–Reference Murakami, Livingstone and Fujiwara28) and the seventy-three-item Brief Diet History Questionnaire (BDHQ; 10–15 min)(Reference Kobayashi, Murakami and Sasaki26–Reference Murakami, Livingstone and Fujiwara28).
As shown in Fig. 1, the MDHQ consisted of the three different parts. Supplementary Fig. S1 shows the MDHQ translated into English. Part 1 of the MDHQ included quantitative questions on consumption frequency of generic food groups (herein referred to as Tier 1 food groups) for each meal type, with potential answers of 0–7 d/week. In this way, the MDHQ can collect dietary information needed for meal patterns and time of day of dietary intake, which cannot be derived from the DHQ or BDHQ. We decided a priori not to collect information on portion sizes (except for alcoholic beverages, for which the amount of each beverage consumed for a typical drinking occasion was asked in Part 2). This decision was mainly based on our previous observation that the BDHQ, which does not collect information on portion sizes and applies fixed portion sizes for dietary intake calculation, had similar efficacy in estimating food and nutrient intakes to the DHQ, where information on portion sizes is collected(Reference Kobayashi, Murakami and Sasaki26,Reference Kobayashi, Honda and Murakami27) . Limited usefulness of portion size information is also supported by several previous studies(Reference Noethlings, Hoffmann and Bergmann29,Reference Schlundt, Buchowski and Hargreaves30) .

Fig. 1. A brief description on the structure of the Meal-based Diet History Questionnaire, with examples of questions.
Part 2 of the MDHQ included questions on relative consumption frequency of sub-food groups (herein referred to as Tier 2 food groups) within one of the generic food groups (Tier 1 food groups), with possible answers of ‘always’, ‘often’, ‘sometimes’, ‘rarely’ and ‘never’. By combining information derived from Parts 1 and 2, we are able to increase the number of foods we can estimate efficiently but within a limited number of questions.
Part 3 of the MDHQ asks about general eating behaviours, which are intended to use in a variety of ways during dietary intake calculation as described below. The reference time period was defined as the preceding month, to correspond with the time frame of both the DHQ and BDHQ.
Data source
The MDHQ, including its dietary intake calculation algorithm, was developed based on a 16-d DR obtained from a group of Japanese adults. The food consumption data were collected between November 2002 and September 2003 in four geographically diverse areas in Japan: Osaka (urban), Okinawa (urban island), Nagano (rural inland) and Tottori (rural coastal). Details of the survey have been described elsewhere(Reference Kobayashi, Murakami and Sasaki26–Reference Murakami, Livingstone and Fujiwara28,Reference Murakami, Sasaki and Takahashi31,Reference Murakami, Livingstone and Sasaki32) . In brief, the target population consisted of apparently healthy, community-dwelling women and their cohabitating spouses. Our recruitment strategy was such that each 10-year age category (30–39, 40–49, 50–59 and 60–69 years) included eight women for each area (without consideration of age of men), resulting in 256 invited participants. To minimise dropout rate, potential participants were restricted to individuals who gave us full understanding of the purpose, procedure and heavy burden of the survey and willingness to complete the entire survey. None of the sample was a dietitian, had experience with dietary counselling from a medical doctor or dietitian or had a history of hospitalisation for diabetes education.
Dietary data were collected by DR. The participants were requested to document and weigh all items eaten or drunk, both in and out of the home, over four non-consecutive days (three weekdays and one weekend day), once per season with an interval of about 3 months between surveys. At orientation, local dietitians explained to participants how to complete the DR using both written and verbal instructions, after which participants were provided with recording sheets and a digital scale. On occasions when weighing was problematic (e.g. eating out), participants were instructed to document as much information as possible, including the brand name of the food and the consumed portion size (based on typical household measures) as well as the details of leftovers. The recording sheets for each survey day were submitted directly to the local dietitian after the survey was completed, who then reviewed the forms and, whenever necessary, sought additional information or modification of the record via telephone or in person. All of the collected records were further reviewed by dietitians at the respective local centre and then again at the study centre. In accordance with standard procedures, portion sizes estimated using household measures were converted into weights and individual food items were coded based on the Standard Tables of Food Composition in Japan(33). In total, 121 women aged 31–69 years and 121 men aged 31–81 years completed the study protocol; basic characteristics of the sample have been shown elsewhere(Reference Murakami, Livingstone and Fujiwara28,Reference Murakami, Livingstone and Sasaki32) . Consequently, a total of 3872 DR data, including 206 837 food item entries, comprised the basis for the MDHQ.
The food diary sheet used was based on a typical Japanese eating pattern, prescribed in the diary as breakfast, lunch, dinner and snacks. During the diet recording, participants were asked to record the clock time when consumption of a food or beverage started. We considered an eating occasion to be any named separate intake occasion with a discrete clock start time. Each eating occasion was then categorised into breakfast, lunch, dinner or snacks based on the section in the food diary in which it was recorded. Food intakes were calculated for each person for each day for each meal type.
The dietary study was conducted according to the guidelines laid down in the Declaration of Helsinki. The study purpose and protocol were explained before the study, and written informed consent was obtained from each participant. Use of data from the DR survey was approved by the University of Tokyo Faculty of Medicine Ethics Committee (project ID: 3421).
Results
In this section, we describe the development process of the MDHQ consisting of the following three parts, with a total of 196 items (Supplementary Fig. S1).
Part 1 of the Meal-based Diet History Questionnaire: questions on Tier 1 food groups for each meal type
Determination of meal type
Part 1 of the MDHQ is shown on Pages 2–7 in Supplementary Fig. S1. Based on the DR data set, the mean clock start time at the individual level was 07.33 (sd 00.38) hours for breakfast, 12.25 (sd 00.28) hours for lunch and 19.17 (sd 00.57) hours for dinner, and mean daily snack frequency was 1.7 (sd 1.1). We thus included the following six meal types in Part 1 in the MDHQ: breakfast, morning snack, lunch, afternoon snack, dinner and night snack.
Selection of Tier 1 food groups
As shown previously(Reference Murakami, Livingstone and Sasaki32), each unique food item eaten by the participants in the DR data (approximately 1300 individual food item codes) was reclassified into 1 of 20 generic food groups (i.e. Tier 1 food groups): rice, bread, noodles, other grains, potatoes, pulses and nuts, vegetables, fruit, fish and shellfish, meat, eggs, dairy products, confectioneries, fruit and vegetable juice, alcoholic beverages, soft drinks, non-alcoholic and non-energetic beverages, sugars, fats and oils, and seasonings. Grouping of foods was done based on similarities in nutrient profile or culinary use of the foods, mainly in accordance with the Standard Tables of Food Composition in Japan(33). After excluding three food groups usually consumed with other foods (sugars, fats and oils, and seasonings) as well as one food group (other grains), where intake at the population level was low(Reference Murakami, Livingstone and Sasaki32) and difficult to assess, there were sixteen Tier 1 food groups. Given their high intake in Japanese as well as their importance in food combinations(Reference Murakami, Livingstone and Sasaki14,Reference Murakami, Livingstone and Sasaki32) , non-alcoholic and non-energetic beverages were further divided into six food groups (i.e. green tea, barley tea, oolong tea, black tea, coffee and water), which were also classified into Tier 1 food groups for simplicity. Furthermore, we included miso soup and pickled vegetables as Tier 1 food groups because of their high intakes(Reference Okubo, Murakami and Sasaki34), although at the individual food item code level, the former was included in seasonings and the latter in vegetables. Finally, we included breakfast cereals as a Tier 1 food group (at the breakfast section only) because they could make a relatively large contribution to overall intake among habitual consumers, albeit that the number of appearances in the DR was quite small (i.e. nineteen appearances with a mean amount of 39 g). We included these twenty-four Tier 1 food groups in Part 1 in the MDHQ, which are shown in the first column of Table 1.
Table 1. Foods included in the Meal-based Diet History Questionnaire (MDHQ)*
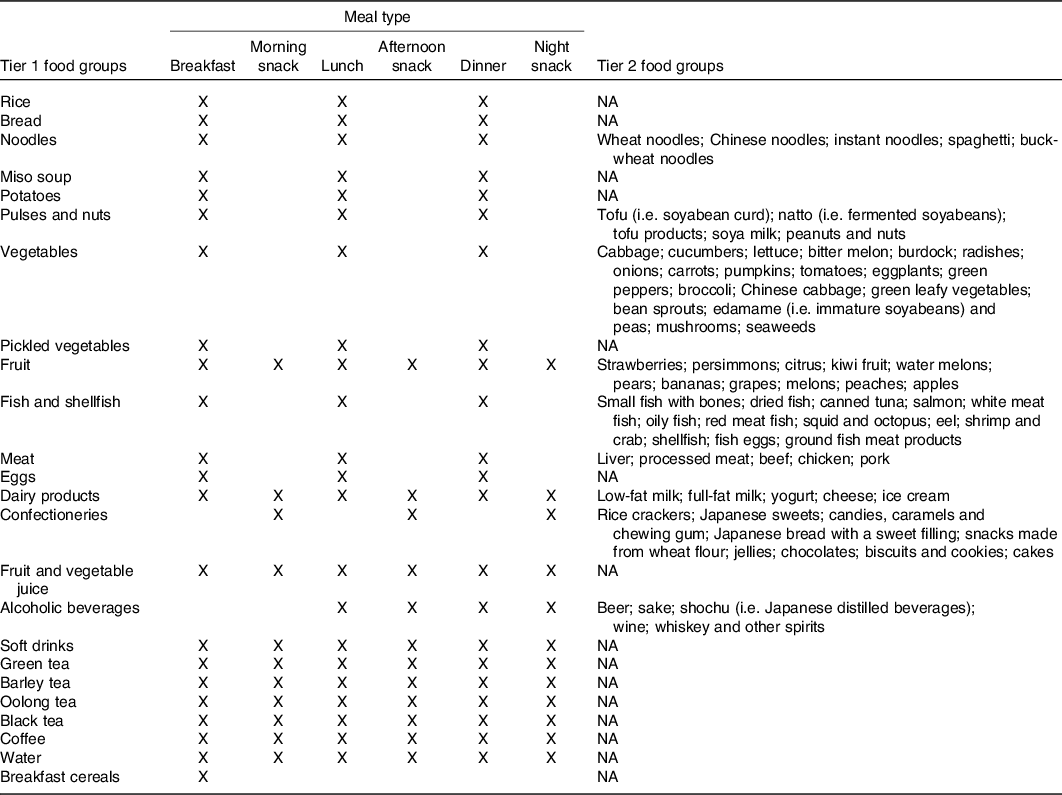
NA, not applicable.
* The MDHQ (Supplementary Fig. S1) consists of the following three parts. Part 1 includes questions on the consumption frequency as the number of d/week for each of the Tier 1 food groups for each of the meal types as shown above; questions on portion size are not included. In Part 2, for some of the Tier 1 food groups (i.e. noodles, pulses and nuts, vegetables, fruit, fish and shellfish, meat, dairy products and confectioneries), relative consumption frequency of sub-food groups (i.e. Tier 2 food groups) within the Tier 1 food group is asked, with possible answers of ‘always’, ‘often’, ‘sometimes’, ‘rarely’ and ‘never’; for alcoholic beverages, the amount of each beverage consumed for a typical drinking occasion is answered by selecting one of seven possible answers. Part 3 asks about eating behaviours, as shown in Table 2.
To minimise the number of questions in the MDHQ, we developed a list of Tier 1 food groups for inclusion in each of the meal sections, based on the intake level of each Tier 1 food group at each meal(Reference Murakami, Livingstone and Sasaki32). These Tier 1 food groups predominantly consumed at every main meal but not as snacks (such as rice, vegetables and meat) were included in the breakfast, lunch and dinner sections, but not in the three snack sections. Conversely, we included confectioneries only in the sections on snacks because of their very low intake levels at main meals(Reference Murakami, Livingstone and Sasaki32). Since fruit, dairy products and beverages were commonly consumed at both main meals and snacks(Reference Murakami, Livingstone and Sasaki32), these were included in all eating occasion sections (except for the breakfast and morning snack sections for alcoholic beverages). The Tier 1 food groups for each meal type are summarised in the second to seventh columns of Table 1.
Part 2 of the Meal-based Diet History Questionnaire: questions on Tier 2 food groups
Part 2 of the MDHQ is shown on Pages 8–12 in Supplementary Fig. S1. After scrutinising the list of food item codes in the DR data set, we identified nine Tier 1 food groups within which there were food items that are distinctively different from each other in terms of either nutrient profile or culinary use. For each of these Tier 1 food groups, sub-food groups (i.e. Tier 2 food groups) were created based on food item codes, mainly in accordance with individual food items used in the DHQ(Reference Sasaki, Yanagibori and Amano25,Reference Kobayashi, Murakami and Sasaki26) . For example, Tier 2 food groups for dairy products included low-fat milk, full-fat milk, yogurt, cheese and ice cream; Tier 2 food groups for other Tier 1 food groups are shown in the last column of Table 1. A sum of these Tier 2 food groups accounted for 87–100 % of total amount of the respective Tier 1 food group consumed in the DR data set. These Tier 2 food groups were included in Part 2 in the MDHQ.
Part 3 of the Meal-based Diet History Questionnaire: questions on eating behaviours
Part 3 of the MDHQ (Pages 13–14 in Supplementary Fig. S1) consisted of eighteen questions on eating behaviours in the BDHQ(Reference Kobayashi, Murakami and Sasaki26–Reference Murakami, Livingstone and Fujiwara28), including the relative amounts of white rice and main and side dishes consumed. Information from Part 3 is applied during several calculations as described below; a summary is provided in Table 2.
Table 2. Eating behaviours asked in Part 3 in the Meal-based Diet History Questionnaire (MDHQ)*
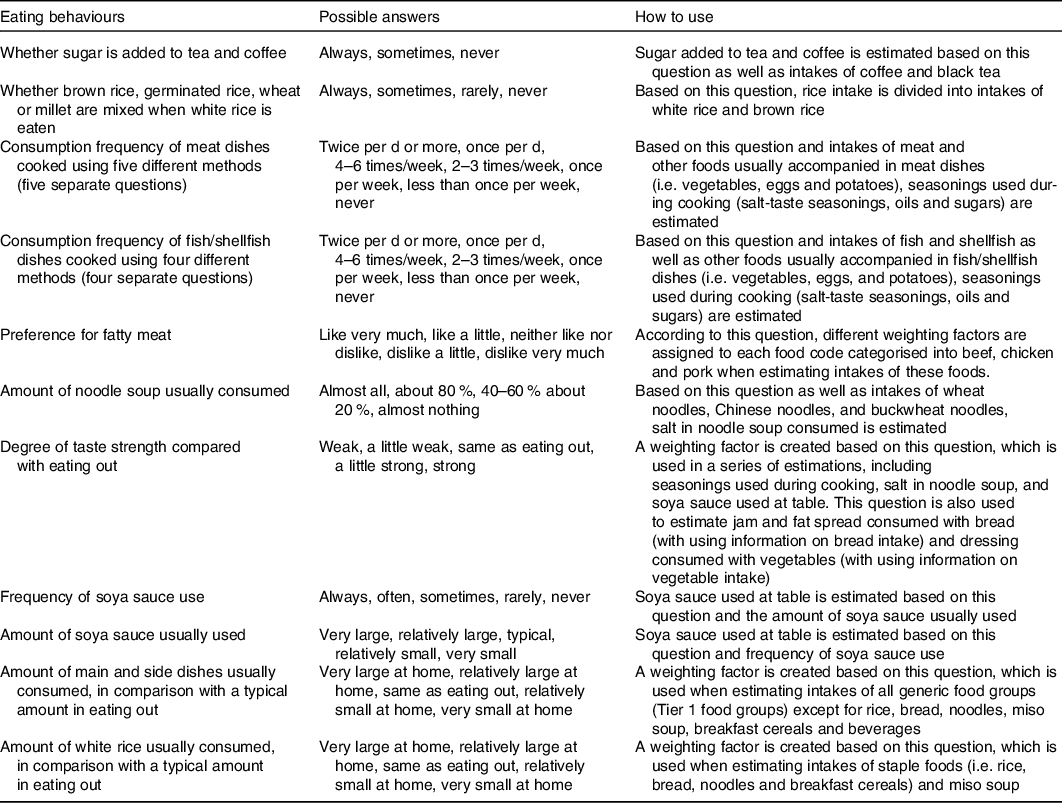
* The MDHQ (Supplementary Fig. S1) consists of the following three parts. Part 1 includes questions on the consumption frequency as the number of d/week for each of the Tier 1 food groups for each of the meal types (as shown in Table 1); questions on portion size are not included. In Part 2, for some of the Tier 1 food groups, relative consumption frequency of sub-food groups (i.e. Tier 2 food groups) within the Tier 1 food group is asked, with possible answers of ‘always’, ‘often’, ‘sometimes’, ‘rarely’ and ‘never’ (as shown in Table 1). Part 3 asks about eating behaviours, as shown above.
Calculation algorithm in the Meal-based Diet History Questionnaire
Tier 1 food groups
We developed an ad hoc computer algorithm for calculating food and nutrient intake based on the MDHQ. Detailed descriptions are provided in Table 3. Briefly, the intake of each of Tier 1 food groups at each of the meal types is calculated as the consumption frequency (from Part 1) multiplied by sex-specific and meal-type-specific portion size as well as by weighting factor(s) (e.g. a factor determined by age using the Estimated Energy Requirement(35)). For each of Tier 1 food groups, sex-specific and meal-type-specific portion size was defined as the mean of the intake value of the respective Tier 1 food group in the DR data. Fig. 2 shows an example of dietary intake calculation in the MDHQ. Here, the subject is a man aged 42 years, and the consumption frequency of noodles (a Tier 1 food group) at breakfast is 3 d/week. Thus, as shown in Fig. 1(a), noodles intake (50·7 g/d) is calculated as follows: (consumption frequency; 3/7 here) × (sex-specific and meal-type-specific portion size in g; 129 for men and breakfast) × (weighting factor based on the information on relative amount of white rice from Part 3; e.g. 0·9 for ‘relatively small at home’) × (weighting factor based on age; e.g. 1·02 for men aged 42 years).
Table 3. Calculation algorithm used in the Meal-based Diet History Questionnaire (MDHQ)*
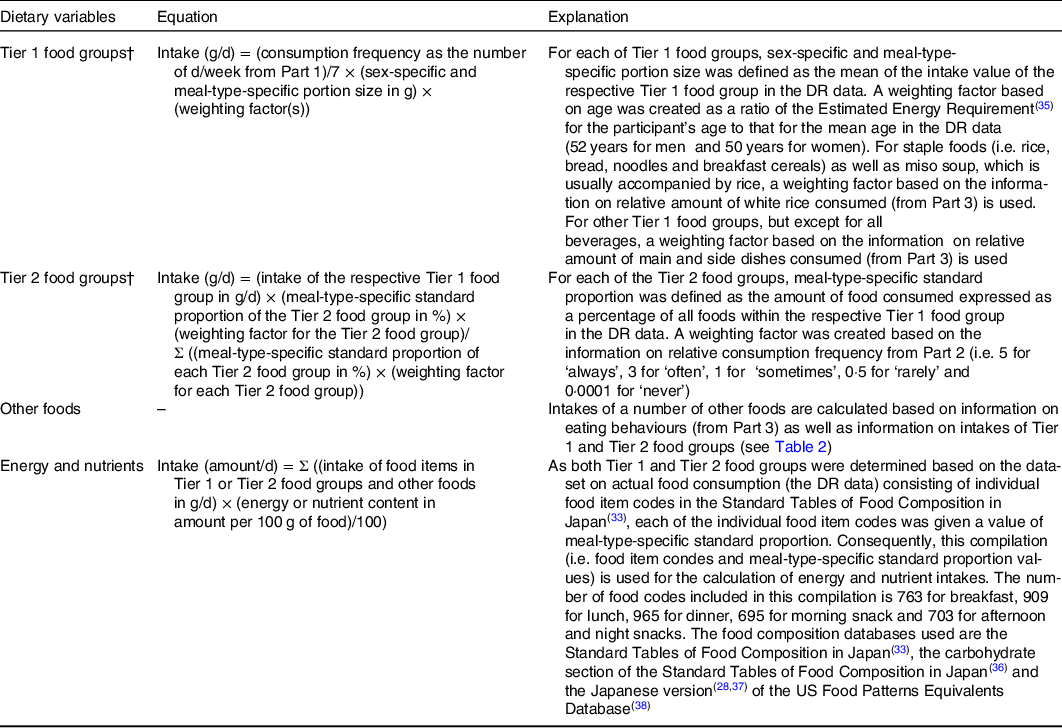
DR, dietary record.
* The MDHQ (Supplementary Fig. S1) consists of the following three parts. Part 1 includes questions on the consumption frequency as the number of d/week for each of the Tier 1 food groups for each of the meal types (as shown in Table 1); questions on portion size are not included. In Part 2, for some of the Tier 1 food groups, relative consumption frequency of sub-food groups (i.e. Tier 2 food groups) within the Tier 1 food group is asked, with possible answers of ‘always’, ‘often’, ‘sometimes’, ‘rarely’ and ‘never’ (as shown in Table 1). Part 3 asks about eating behaviours (as shown in Table 2).
† For beer, sake, shochu (i.e. Japanese distilled beverages), wine, and whiskey and other spirits, intake at each meal type is calculated as daily consumption frequency of a Tier 1 food group alcoholic beverages (from Part 1) multiplied by the typical consumption amount of each beverage (from Part 2) and the weighting factor based on age. The sum of them constitutes the intake of a Tier 1 food group alcoholic beverages.
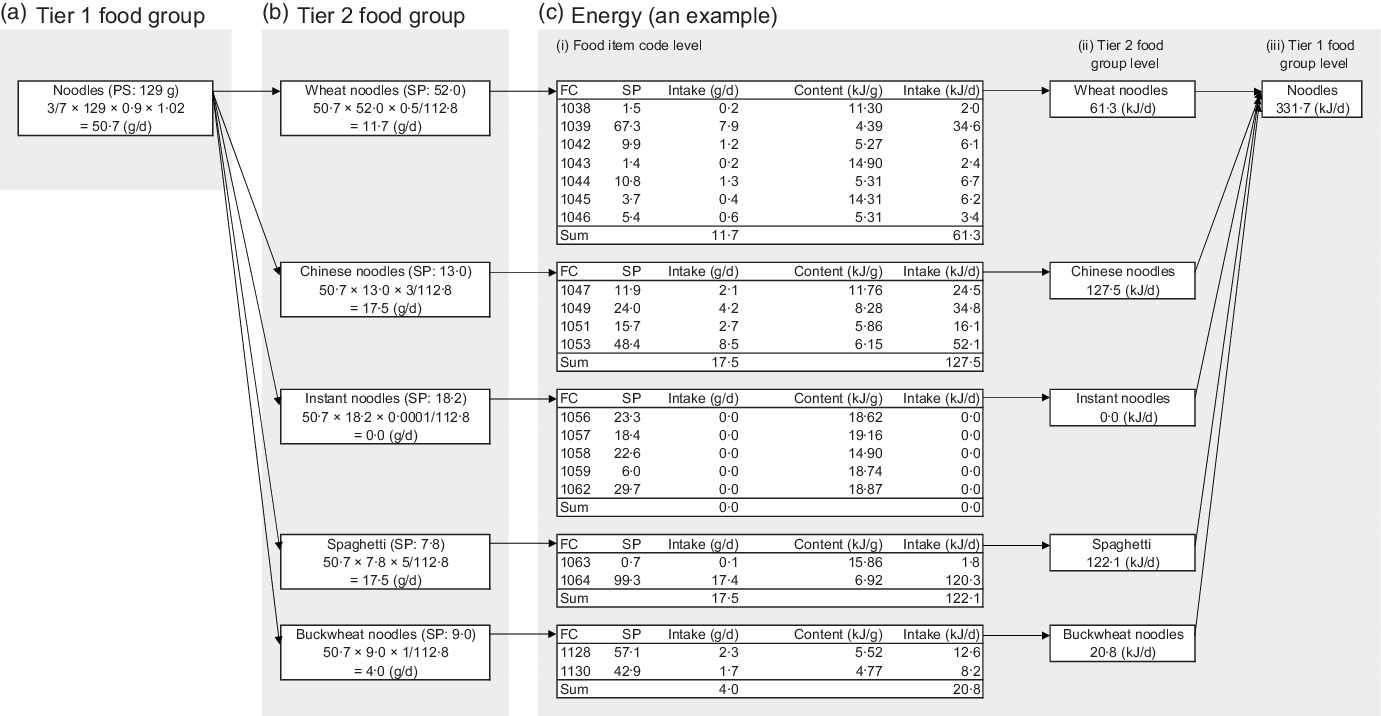
Fig. 2. An example of dietary intake calculation in the Meal-based Diet History Questionnaire. (a) Tier 1 food group. Here, the subject is a man aged 42 years, and the consumption frequency of noodles (a Tier 1 food group) at breakfast is 3 d/week. Then, noodles intake (50·7 g/d) is calculated as follows: (consumption frequency; 3/7 here) × (sex-specific and meal-type-specific portion size in g; 129 for men and breakfast) × (weighting factor based on the information on relative amount of white rice; e.g. 0·9 for ‘relatively small at home’) × (weighting factor based on age; e.g. 1·02 for men aged 42 years). (b) Tier 2 food group. Assume that the relative consumption frequency of Tier 2 food groups within noodles is as follows: ‘rarely’ (weighting factor 0·5) for wheat noodles, ‘often’ (weighting factor 3) for Chinese noodles, ‘never’ (weighting factor 0·0001) for instant noodles, ‘always’ (weighting factor 5) for spaghetti and ‘sometimes’ (weighting factor 1) for buckwheat noodles. Then, intake of wheat noodles, a Tier 2 food group, (11·7 g/d) is calculated as follows: (Tier 1 food intake in g/d; here, noodles: 50·7) × (meal-type-specific standard proportion of the Tier 2 food group in %; 52·0 for wheat noodles at breakfast) × (weighting factor for the Tier 2 food group; 0·5 here)/(Σ ((meal-type-specific standard proportion of each Tier 2 food group in %) × (weighting factor for each Tier 2 food group)); here, 112·8, that is, (52·0 × 0·5; for wheat noodles) + (13·0 × 3; for Chinese noodles) + (18·2 × 0·0001; for instant noodles) + (7·8 × 5; for spaghetti) + (9·0 × 1; for buckwheat noodles)). (c) Energy (an example). The food composition database for each Tier 2 food group (and each Tier 1 food group without any Tier 2 food group) consists of individual food item codes, with values of meal-type-specific standard proportion. For example, a Tier 2 food group wheat noodles consists of seven individual food item codes. Thus, for energy intake calculation, wheat noodles intake is divided into these seven item codes, simply based on values of meal-type-specific standard proportion, and then intake for each item code is multiplied by its energy content; the sum of these products is energy intake from wheat noodles. In the same way, energy intake from a Tier 1 food group is calculated as the sum of energy intake from all Tier 2 food groups within the Tier 1 food group. PS, sex-specific and meal-type-specific portion size; SP, meal-type-specific standard proportion; FC, individual food item code.
Tier 2 food groups
As shown in Table 3, the intake of each of Tier 2 food groups within the respective Tier 1 food group at each of the meal types is calculated on the basis of intake of the respective Tier 1 food group, meal-type-specific standard proportion of Tier 2 food groups and weighting factors created based on the information on relative consumption frequency (from Part 2). For each of the Tier 2 food groups, meal-type-specific standard proportion was defined as the amount of food consumed expressed as a percentage of all foods within the respective Tier 1 food group in the DR data. In the example shown in Fig. 2(b), it is assumed that the relative consumption frequency of Tier 2 food groups within noodles is as follows: ‘rarely’ (weighting factor 0·5) for wheat noodles, ‘often’ (weighting factor 3) for Chinese noodles, ‘never’ (weighting factor 0·0001) for instant noodles, ‘always’ (weighting factor 5) for spaghetti and ‘sometimes’ (weighting factor 1) for buckwheat noodles. Thus, intake of wheat noodles, a Tier 2 food group, (11·7 g/d) is calculated as follows: (Tier 1 food intake in g/d; here, noodles: 50·7) × (meal-type-specific standard proportion of the Tier 2 food group in %; 52·0 for wheat noodles at breakfast) × (weighting factor for the Tier 2 food group; 0·5 here)/(Σ ((meal-type-specific standard proportion of each Tier 2 food group in %) × (weighting factor for each Tier 2 food group)); here, 112·8, that is, ((52·0 × 0·5; for wheat noodles) + (13·0 × 3; for Chinese noodles) + (18·2 × 0·0001; for instant noodles) + (7·8 × 5; for spaghetti) + (9·0 × 1; for buckwheat noodles)).
For beer, sake, shochu (i.e. Japanese distilled beverages), wine, and whiskey and other spirits, intake at each meal type is calculated as daily consumption frequency of a Tier 1 food group alcoholic beverages (from Part 1) multiplied by the typical consumption amount of each beverage (from Part 2) and the weighting factor based on age. The sum of them constitutes the intake of a Tier 1 food group alcoholic beverages.
Other foods
Based on the information on eating behaviours (from Part 3) as well as information on intakes of Tier 1 and Tier 2 food groups, we developed calculation algorithms for intakes of a number of other foods, including sugar added to tea and coffee; seasonings (salt-taste seasonings, oils and sugars) used during cooking; salt in noodle soup; jam consumed with bread; fat spread consumed with bread; dressing consumed with vegetables; and soya sauce. These are summarised in Table 2.
Energy and nutrients
Intakes of energy and nutrients are calculated as the intakes of Tier 1 or Tier 2 food groups multiplied by their nutrient compositions and then summing up these products (Table 3). In this calculation, relative amount of food items (food item codes) within the respective Tier 1 or Tier 2 food group in the DR data set is taken into account. The food composition tables used are the Standard Tables of Food Composition in Japan(33), as well as the carbohydrate section of the Standard Tables of Food Composition in Japan(36) and the Japanese version(Reference Murakami, Livingstone and Fujiwara28,Reference Murakami, Livingstone and Fujiwara37) of the US Food Patterns Equivalents Database(Reference Bowman, Clemens and Friday38) (so that added sugars can be calculated). More specifically, the food composition database for each Tier 2 food group (and each Tier 1 food group without any Tier 2 food group) consists of individual food item codes, with values of meal-type-specific standard proportion. For example, as shown in Fig. 2(c), a Tier 2 food group wheat noodles consists of seven individual food item codes. Thus, for the calculation of energy intake (an example), wheat noodles intake (11·7 g/d) is divided into these seven item codes, simply based on values of meal-type-specific standard proportion, and then intake for each item code is multiplied by its energy content; the sum of these products (61·3 kJ/d) is energy intake from wheat noodles. In the same way, energy intake from a Tier 1 food group (noodles here; 331·7 kJ/d) is calculated as the sum of energy intake from all Tier 2 food groups (61·3, 127·5, 0·0, 122·1 and 20·8 kJ/d).
Discussion
Research on meal patterns and time of day of dietary intake has been hindered by the lack of fit-for-purpose dietary assessment questionnaires for estimating meal-specific dietary intakes. Thus, we developed a self-administered, meal-based diet-history type questionnaire (i.e. MDHQ), on the basis of 3872 DR data in Japanese. To our knowledge, this is the first attempt at developing a self-administered dietary assessment questionnaire which can estimate intakes of foods and nutrients for each meal type separately, in addition to overall dietary intakes.
FFQ, including the DHQ and BDHQ, do not usually include the assessment of the timing of dietary intake and meal-specific dietary intake(Reference Leech, Worsley and Timperio9). While detailed and thus burdensome methods such as DR and 24-h dietary recall are able to collect such information, multiple-day assessment is required for habitual intake, which is not always feasible in nutrition research despite the advancement of technology(Reference Cade39). These led us to develop the MDHQ as a dedicated fit-for-purpose methodology for collecting data on meal patterns and time of day of dietary intake. While traditional FFQ including the DHQ and BDHQ ask about food intake on a daily basis (as a whole diet), the MDHQ is designed for collecting dietary information for each meal type separately. Given that the cognitive tasks required during dietary recall are complex, including understanding what information is being asked for, and searching for and evaluating the retrieved information before providing a response(Reference Livingstone, Robson and Wallace40), the MDHQ may be easier to answer, facilitating better estimation of food intake. This may be particularly relevant to Japanese because previous studies among Japanese adults have shown that the selection, amount and combination of foods consumed are markedly different between meal types(Reference Murakami, Livingstone and Shinozaki13–Reference Murakami, Livingstone and Sasaki15,Reference Murakami, Livingstone and Sasaki32) . An in-house pretest conducted with staff and students from the Department of Social and Preventive Epidemiology, University of Tokyo confirmed that the MDHQ took a median of 20 min to complete (n 16). This may suggest that the MDHQ is inexpensive to administer and has low participant burden, despite the fact that because of its complex structure and algorithms, dietary intake data for each meal type can be obtained. We believe that the MDHQ is a promising tool for advancing the new research area of meal patterns and time of day of dietary intake, or chrono-nutrition research. A validation study of this tool is warranted.
The strength of this study is the use of detailed information on actual food consumption, covering all seasons with a large number of records (n 3872), for the empirical development of the MDHQ and its calculation algorithm. However, there are also several limitations inherent in the dietary data used. First, all self-reported dietary assessment methods are subject to both random and systematic errors(Reference Livingstone and Black41), and the nature and extent of the measurement error of self-reported information on dietary intake from each meal type are largely unknown(Reference Kant42). Our data-driven development of the MDHQ is not free from these problems. Second, although sampling for the dietary survey was conducted to consider regional differences in dietary habits, the population was not a nationally representative sample of the Japanese population. As volunteers, the participants may have been biased towards greater health consciousness. Further, as the participants (men and women) were from the same household, sex differences in dietary habits may have been under-represented. These factors might have affected the representation of some food items and portion sizes during the development of MDHQ. Theoretically speaking, with a more nationally representative dietary data, the MDHQ would have been more generalisable to Japanese. Nevertheless, we believe that the 3872 DR data used here are one of the most relevant one in Japan, mainly because the Japanese national dietary survey is based on a single-day DR at the household level, covering only 1 month of year(Reference Ikeda, Takimoto and Imai43).
Although the MDHQ was developed for Japanese, the development was based on actual food consumption data and the process was highly standardised; thus, the same strategy could also be applied for other populations. This may be particularly promising in the context of international comparison of meal patterns and time of day of dietary intake or characterisation of Japanese diet, which is largely hindered by a lack of inexpensive dietary assessment tools for such purposes.
In conclusion, we described data-driven development of the MDHQ for Japanese adults. Given that the MDHQ was empirically developed based on comprehensive information on actual food consumption, this innovative tool may be useful as a dietary assessment tool for future epidemiological research on meal patterns and time of day of dietary intake, or chrono-nutrition research. Thus, a rigorous evaluation of validity of the MDHQ is warranted. We are now preparing for such a study to establish the integrity of both the paper-based and web-based versions of MDHQ for use in large-scale epidemiological studies.
Acknowledgements
The authors thank Naoko Hirota, Akiko Notsu, Ayako Miura, Hidemi Todoriki, Mitsuru Fukui and Chigusa Date for data collection in the dietary survey.
This study was funded by the H13 Health Sciences Research Grant (Kenkou-kagakusougoukenkyujigyou) from the Ministry of Health, Labour and Welfare, Japan. The Ministry of Health, Labour and Welfare had no role in the design, analysis or writing of this article.
K. M. conceptualised and developed the MDHQ, prepared the first draft of the manuscript and had primary responsibility for the final content; N. S. contributed to the conceptualisation and development of the MDHQ and assisted in the writing of the manuscript; T. A. M. and M. B. E. L. contributed to the conceptualisation of the MDHQ and provided critical input into the final draft of the manuscript and S. S. directed the dietary survey. All authors have read and agreed to the final version of the manuscript.
The authors declare that there are no conflicts of interest.
Supplementary material
For supplementary materials referred to in this article, please visit https://doi.org/10.1017/S0007114520004936


 Open access