


CVD is one of the leading contributors to the global disease burden(Reference Newton, Briggs and Murray1). Despite efforts over several decades, CVD remains a significant cause of disability, death and health inequalities. In the UK, there are about seven million people living with CVD and about a quarter (25 %) of all UK deaths are caused by CVD(2). The total annual healthcare cost of CVD in the UK is estimated at £9 billion while the cost to the UK economy (including premature death, disability and informal costs) is estimated at £19 billion each year(2). With an ageing and growing population and improved survival rates from CVD, these numbers are only expected to rise further.
Even though the rate of overall CVD deaths in England has reduced by over 50 % in <30 years (most likely due to a more effective control of blood pressure), the gap between highest and lowest rates of CVD mortality in England has not narrowed: the areas with the highest rate of CVD mortality 30 years ago are still the areas with the highest rates of CVD mortality now. For instance, and as shown in Fig. 1(a), the rates of mortality in the North East of England in 2016 were at a level comparable to those in Greater London 17 years ago. Furthermore, mortality rates for avoidable CVD deaths show huge variation by deprivation (Fig. 1(b). CVD prevalence also varies with deprivation: the most recent Health Survey for England (HSE) shows that in 2017, 22 % of adults aged 35 years and over in the lowest quintile reported having any doctor-diagnosed CVD while they were only 16 % in the highest income quintile(3).

Fig. 1. (Colour online) CVD and inequalities: (a) CVD deaths, North East England v. London, 1990–2017 (per 100 000, all ages), source: Global Burden of Diseases (GBD) Compare (4) and (b) age-standardised avoidable mortality rates from CVD by deprivation in England (2015), data source: Office for National Statistics(5).
Cardio-metabolic risk is a term that describes a family of risk factors of metabolic origin that increase the risk of developing CVD such as CHD, stroke, type 2 diabetes and chronic kidney disease. Some of these risk factors are non-modifiable (such as age, sex and ethnicity) while others are modifiable and preventable. These modifiable risk factors can be divided into social and environmental factors (including financial inequalities, employment, housing, air pollution but also our food environment) and behavioural risk factors, which include smoking, alcohol consumption, physical inactivity, poor diet and obesity(6).
Dietary health in England
UK government dietary advice is based upon recommendations from independent expert scientific committees such as the Scientific Advisory Committee on Nutrition (SACN). Dietary recommendations come in the form of dietary reference values and food-based guidelines. The current UK government advice on healthy eating is encompassed pictorially in the Eatwell Guide shown in Fig. 2(7).

Fig. 2. (Colour online) The Eatwell Guide, the UK national food model: a visual tool describing a diet consistent with UK dietary advice.
Reviews of the evidence on the relationship between diet, specific nutrients and CVD risk have informed recommendations for salt, fibre, fruit and vegetables, fatty acids (saturated, unsaturated and trans fatty acids) and oily fish (Table 1)(8–12). The recommendations for energy intake (Table 2) are also relevant as energy intake above the energy requirements increases the risk of excess weight gain which can lead to obesity, a risk factor for CVD(6). The recommendations for free sugars are also related to CVD risks as diets high in free sugars increase the risk of excess energy consumption(12).
Table 1. UK dietary recommendations and current intakes

Table 2. Estimated energy requirements (EAR), estimated energy intakes and excess energy intakes by age band, sex and weight status

* Estimated from the Henry equations using average height and weight data (HSE 2012–2014(17)) and average physical activity levels values. Excess is the difference between energy intakes and the EAR. Further details on the methods can be found in(16). Source: Calorie reduction: the scope and ambition for action(16).
When compared with dietary recommendations, data from the National Diet and Nutrition Survey show that, on the whole, average diets in the UK do not meet recommendations (Table 1). In terms of time trend, long-term data show that over the years intakes have improved for a few foods or nutrients (salt and trans fatty acids) but that for most of them intakes have not changed and are still not meeting recommendations (fruit and vegetables, saturated fat, oily fish and fibre)(15). Estimated energy intakes have been derived from the Henry equation using HSE average height, weight and physical activity levels(16) and compared to current recommendations (Table 2). These calculations show that, on average, adults consume between 335 and 1213J (80 to 290 kcal) excess energy daily, and overweight and obese adults up to 1778J (425 kcal) excess energy daily. Compared with those with ideal body weights, overweight and obese children consume between approximately 586 and 2092J (140 t0 500 kcal) excess energy daily, depending on their sex and age.
As expected with these excess levels of energy intakes, the prevalence of overweight and obesity is high. The average person in England is now overweight: the 2017 HSE found that 61 % of women, 67 % of men and 30 % of children aged 2–15 years were overweight or obese(3). More detailed data on childhood obesity show that in 2017/18, almost a quarter (22·4 %) of children in primary school aged 4–5 years, and over a third (34·3 %) aged 10–11 years, were overweight or obese(18).
Obesity is a concern across all age and sex groups, but prevalence for children living in the most deprived areas is more than double that for those in the least deprived areas: 12·8 v. 5·7 % for children aged 4–5 years and 26·8 v. 11·7 % for those aged 10–11 years(18). In both age groups, severe obesity prevalence was about four times as high in the most deprived area as in the least deprived area(18). This deprivation gap for obesity has only been increasing with time: between 2006–2007 and 2017–2018, it has increased by 1·6 percentage points for children aged 4–5 years and by 5·0 percentage points for those aged 10–11 years(18).
Children who are obese are more likely to be obese adults and obese adults are more likely to have health problems. For instance, obese individuals are more than 2·5 times more likely to develop high blood pressure and five times more likely to develop type 2 diabetes(19). There is therefore a lot to gain in addressing childhood obesity and in reducing this deprivation gap: not only would it bring multiple physical health benefits, including a reduction in CVD, but it would also reduce the huge financial costs associated with obesity and obesity-related conditions.
Why are diets poor in England?
Nutrition and cooking are now imbedded within the National Curriculum and the school food standards have been in operation for many years(20). The majority of foods carry both front of pack traffic labels(21) and the mandatory nutrition information on the back of pack(22). Surveys reportedly show nutrition knowledge tends to be reasonable(23) yet this is not translated into action.
Public Health England (PHE)(24) and others(25,26) have previously discussed the reasons for poor diet in England, which include structural factors such as advertising, marketing, price, high density of food outlets and walkability of towns and cities. These factors nudge food choices towards less healthy options and low levels of physical activity. For example, 40 % of the food bought from UK supermarkets is on promotion and these promotions, which tend to be on less healthy products, increases the amount of food purchased by a fifth(24).
Another example is the growth of the eating out-of-home sector (such as cafes, restaurants, pubs, etc.), which now provides 20–25 % of an adult's energy intake(16). The density of fast food outlets has increased in England and there is evidence linking the density of fast food outlets to the level of area deprivation(Reference Donin, Nightingale and Owen27–Reference Fraser, Edwards and Cade29). Fig. 3(a) shows the density of fast food outlets in England where there are, on average, 96 fast food outlets per 100 000 population. This number ranges from 26 to 232, with the local authorities with a higher deprivation score (i.e. more deprived) having a greater density of fast food outlets (Fig. 3(b))(30). Although some studies show mixed results, there is a growing body of evidence on the association between exposure to fast food outlets and obesity(Reference Donin, Nightingale and Owen27,Reference Patterson, Risby and Chan28,Reference Burgoine, Forouhi and Griffin31) .
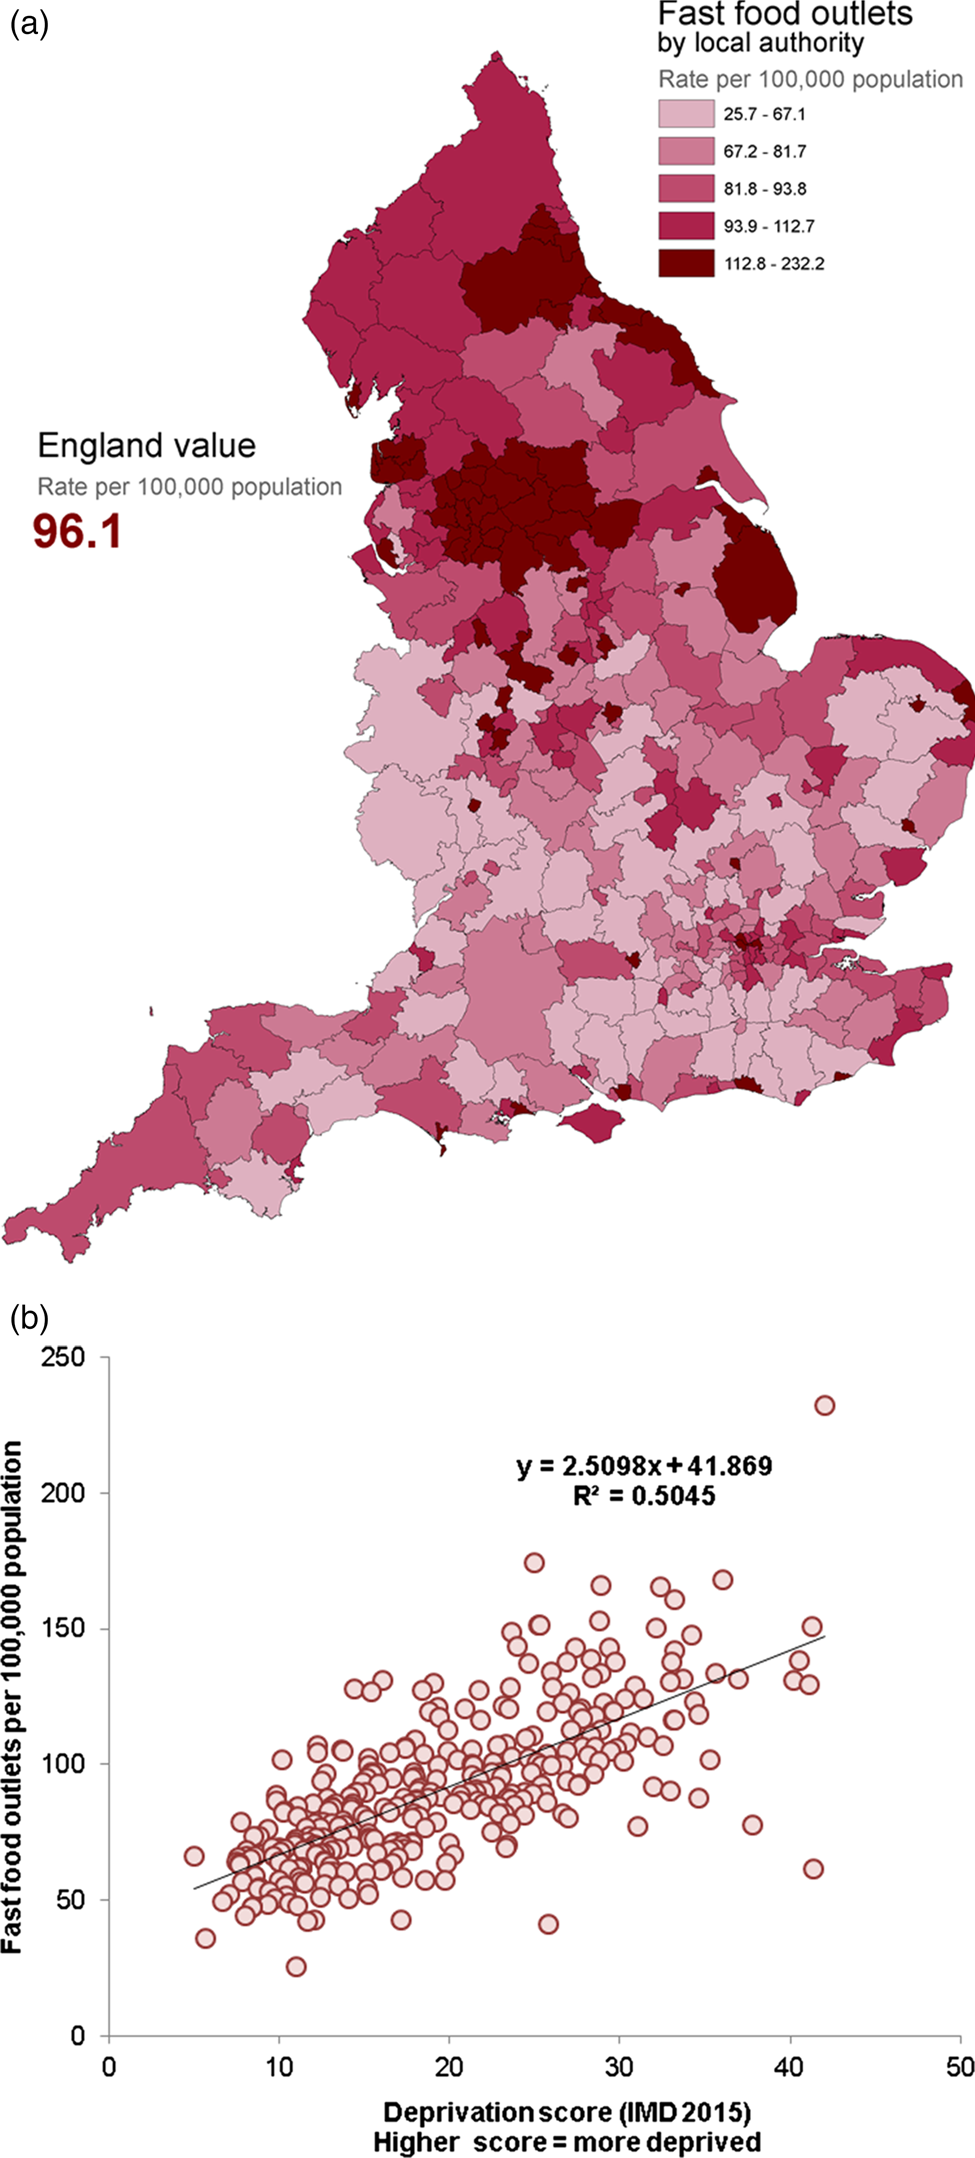
Fig. 3. (Colour online) Density of fast food outlets in England: (a) density by local authorities and (b) relationship between fast food outlet density and deprivation by local authority (IMD, Index of Multiple Deprivation). In this analysis ‘fast food’ refers to energy-dense food that is available quickly, covering therefore a range of outlets that include, but are not limited to, burger bars, kebab and chicken shops, chip shops and pizza outlets. Source: Fast food outlets: density by local authority in England(30).
Dietary policy in England
There are many ways in which the government can act to assist the population in achieving dietary recommendations and reducing disease incidence such as CVD. One way is to simply provide information about lifestyle and dietary recommendations, hoping that consumers will choose those foods in the proportions recommended to improve their health. The government can also be more active in order to enable choice or make healthier choices the default option. This can take the form of incentives and disincentives, restriction of choice and, ultimately, legislation. In particular, reformulation programmes are an effective strategy for improving diets at a population level, providing that the most commonly consumed foods are changed. Product reformulation also places the least burden on the public as it allows everyday foods to be changed so that there is no need for individuals to consciously review and sustain changes to improve their diet.
The salt reduction programme
In 2003, SACN published its report Salt and health in which it was recommended that population average salt intakes should be reduced to 6 g/d to reduce the risk of high blood pressure, a major risk factor for CVD(9). A structured salt reduction programme was designed to achieve a gradual reduction in the salt content of food by setting the food industry a series of targets. A series of progress reports has since then been published in 2006, 2009, 2011, 2014 and 2018.
The sixty-six foods covered by the 2014 salt targets were the main contributors to dietary salt intakes in adults in the UK and provided about 54 % of salt in the diet(32). An additional twenty-four targets were set specifically for the eating out-of-home sector (such as quick service restaurants, takeaway and meal delivery businesses) on a maximum per serving basis. The analysis shows that for foods consumed in-home, just over half of the average salt reduction targets have been met. However, where maximum targets were set, 81 % of products overall had salt levels at or below their targets. For the out-of-home sector, 71 % of products overall were at or below maximum per serving targets, although it should be noted that the out-of-home targets were generally set at a higher level than the main salt targets to take into account their generally higher levels of salt(32).
Overall, the available evidence shows that since the programme began in 2004 there has been clear progress. Along with consumer campaigning and a range of other interventions, the stepwise lowering of salt targets for foods by up to 54 % between 2006 (when targets were first set) and 2014 (when the 2017 targets were published) is linked to a reduction in average population salt intake of 11 % between 2005–2006 and 2014(32).
The sugar reduction programme
In its Carbohydrates and health report published in 2015, SACN concluded that the recommended average population maximum intake of sugar should be halved and should not exceed 5 % of total dietary energy. SACN also recommended that consumption of sugar-sweetened drinks should be minimised by both adults and children(12). By meeting these recommendations within 10 years, not only would an individual's quality of life be improved but the National Health Sevice could save about £500 million every year (based on a conservative assessment).
SACN recommendations were accepted by the government and integrated into official UK dietary advice and key nutrition policy instruments, such as the Eatwell Guide (Fig. 2), and advice on institutional catering. More recently, a Change4Life campaign was launched to encourage parents to ‘Make a swap when you next shop’ to halve children's sugar intake. Local authorities, National Health Service and non-governmental organisation partners have been provided with a range of material and digital resources to support the campaign. Schools are also involved, with 3·6 million activity packs distributed to primary schools and free teaching resources available for teachers. The launch of this campaign received extensive coverage in the media and is expected to have a positive impact on children's diets.
In addition to consumer campaigning, a sugar reduction programme was implemented to challenge all sectors of the food industry to reduce by 20 % by 2020 the level of sugar in the ten categories that contribute most to the intakes of children up to 18 years (i.e. yoghurts and fromage frais; biscuits; cakes; morning goods; puddings; ice cream, lollies and sorbets; breakfast cereals; chocolate confectionery; sweet confectionery; and sweet spreads and sauces). As detailed in the technical guidance published in 2017(33), the reductions in sugar have to be accompanied by reductions in energy (where possible), no increases in saturated fat and the achievement of current salt targets.
The industry was challenged to achieve a 5 % reduction in the first year of the programme and the corresponding report on progress was published in 2018(34). Cakes and morning goods being excluded from this first report due to a lack of data, progress was measured in eight categories out of the ten, showing reductions in sugar levels in five of them: yoghurts and fromage frais (−6 %), breakfast cereals (−5 %), sweet spreads and sauces (−5 %), ice cream, lollies and sorbets (−2 %) and sweet confectionery (−1 %). However, no change was seen for chocolate confectionery or biscuits (0 %) and an increase of 1 % was even measured for puddings. Overall, there has been a 2 % reduction in total sugar per 100 g for retailers own brand and manufacturer branded products(34).
These results are an early assessment of the progress of sugar reduction by industry and it has to be acknowledged that reformulated products take time to appear in stores and in shopping baskets. A clearer indication of progress should be available in the next progress report to be published in 2019, including data on cakes and morning goods. An overall figure for the volume of sugar removed from the market is also expected to be included in this report.
The calorie reduction programme
Following the sugar reduction programme, the scope and ambition of a calorie reduction programme was published in 2018(16). The evidence set out in this report was based on the recommended levels of energy intake published by SACN in 2011(35) with the aim to set the ambition, scope and timeline for extending the reformulation programme to cover the foods that contribute significantly to children's energy intakes. As seen in Table 2, overweight and obese children consume, on average, substantial amounts of excess calories every day compared with those with ideal body weights. This excess energy consumption increases the chances of becoming overweight and obese, which is a leading cause of poor health and premature death, including from CVD.
In this context, the calorie reduction programme challenges the food industry to achieve a 20 % reduction in energy by 2024 in product categories that contribute significantly to children's energy intakes (up to age 18 years) and where there is scope for substantial reformulation and/or portion size reduction. The products covered by the programme include ready meals, pizzas, meat products, savoury snack products, sauces and dressings, prepared sandwiches, composite salads and other ‘on the go’ foods including meal deals(16). It does not cover foods included in the sugar reduction programme as energy reduction guidelines were already included in this programme(33). The guidelines for the calorie reduction programme are expected to be published in 2019, alongside a detailed analysis of baseline levels of energy in different food categories for different sectors of the food industry. The first progress report is expected for 2021(16).
The health and economic benefits of reducing the energy content of these foods and excess energy consumption are significant. A 20 % reduction in energy from everyday foods that contribute to intakes, if achieved over 5 years, would prevent 35 370 premature deaths, save the National Health Service £4·5 billion healthcare costs and save social care costs of about £4·48 billion, over a 25-year period. This programme should also help to address health inequalities, as rates of obesity in children tend to be highest in the most deprived(16). PHE will therefore seek to gather evidence of the impact of the programme across all economic and geographic groups.
Childhood obesity: a plan for action – chapters 1 and 2
Obesity is a complex problem with many drivers, including individual behaviour, environment, genetics and culture. Long-term, sustainable change will only be achieved through the active engagement of schools, communities, families and individuals. In this context, the government published the first chapter of Childhood obesity: A plan for action in August 2016(36). Even though the government's journey on obesity has been going on for many years, this was the first cross-government programme that aims to significantly reduce England's rate of childhood obesity within the next 10 years, meaning that all government departments are taking responsibility for it.
This programme includes thirteen deliverables that encourage (i) industry to cut the amount of sugar in food and drinks and (ii) primary school children to eat more healthy food and stay active. The deliverable related to the industry includes the sugar and calorie reduction programmes afore-mentioned as well as the Soft Drinks Industry Levy that came into effects in April 2018(37). The most recent PHE analysis has shown that there has been an 11 % reduction of sugar levels in drinks subject to the levy(34). Although this is an early assessment, it does suggest that fiscal measures on foods can be successful in a UK context.
The second chapter of the childhood obesity plan was published in June 2018(38). This builds on the 2016 plan to cement the action already taken, and to expand focus into other areas. The report sets out further work on five main areas: (1) Sugar reduction, including the government's intention to introduce legislation to end the sale of energy drinks to children; (2) Calorie reduction, including introducing legislation to mandate consistent calorie labelling in England for the out-of-home sector; (3) Advertising and promotions, including consulting on introducing a 21.00 hours watershed on television for advertising high fat, salt and sugar products and banning price promotion and promotion by location (e.g. at the checkout) of unhealthy foods; (4) Local areas, including ensuring places children live, learn and play are promoting a healthy lifestyle; (5) Schools, including work on updating the school food standards, consideration of healthy start vouchers and how to provide additional support to children form lower income families, and increasing physical activity in schools to meet the government target.
The evidence-based actions outlined in the report will work towards the government's ambition of halving childhood obesity and significantly reducing the gap in obesity between children from the most and least deprived areas by 2030. The government remains committed to reviewing what more can be done to meet the ambition of halving obesity and will continue to monitor progress and review emerging evidence.
Conclusions
In practice, there is no magic bullet to achieve population-level dietary change and a matrix of approaches is likely to be most effective to address poor diets in England; actions will be needed by individuals and by society including government. Over the past 3 years, policy interventions on diet have stepped up with the publication of chapters 1 and 2 of the childhood obesity plan. In these documents, the government has been clear that more actions are likely to follow so these interventions are the start rather than the end of the policy journey. The government has also stated that if the current voluntary reformulation programmes do not lead to improvements, other fiscal actions will then be considered. PHE is committed to continuing to monitor the nation's diet, to developing and monitoring the food reformulation programmes, and to being clear where further intervention is needed. Commitments also include the provision of expert advice on diet which builds on the research produced by the UK and worldwide academic community on diet and CVD interactions. PHE encourages research gaps to be addressed to provide the evidence base for policy development.
Acknowledgement
The authors thank John Lomas and Catherine Bray from PHE for producing the graphs on CVD inequalities and on fast food density, respectively.
Financial Support
None
Conflict of Interest
None.
Authorship
The authors were jointly responsible for all aspects of preparation of this paper.


