


Introduction
Weed management is one of the most significant challenges of any agricultural system and, over time, has become even more difficult. With the continuous increase of the human population and the continually expanding demands for more efficient agriculture, minimizing yield losses through weed competition is ever more critical (Zahid et al. Reference Zahid, Robinson and Kelly2016). These high-yield demands have culminated in intensive use of herbicides that have selected herbicide-resistance traits in weed populations, which makes management more challenging and complicated (Bararpour et al. Reference Bararpour, Norsworthy, Burgos, Korres and Gbur2017). More than 500 unique cases of herbicide resistance have been documented worldwide within 262 species (Heap Reference Heap2020). Italian ryegrass [Lolium perenne L. spp. multiflorum (Lam.) Husnot] is one of the most troublesome weeds worldwide, with resistance documented to eight different mechanisms of action (Heap Reference Heap2020). Traits such as obligate outcrossing and large seed production make L. multiflorum an excellent candidate species for the evolution of herbicide resistance (Bararpour et al. Reference Bararpour, Norsworthy, Burgos, Korres and Gbur2017; Brunharo and Hanson Reference Brunharo and Hanson2018; Busi et al. Reference Busi, Gaines, Walsh and Powles2012).
The state of Oregon, USA, is the central grass seed production area in the world (USDA-NASS 2017), which makes Oregon a unique place to study L. multiflorum weed management. The major grass seed species grown in Oregon are annual ryegrass [Lolium perenne L. ssp. multiflorum (Lam.) Husnot], perennial ryegrass (Lolium perenne L. ssp. perenne), and tall fescue [Schedonorus arundinaceus (Schreb.) Dumort.] (Anderson Reference Anderson2018). These seed crops require high seed purity in the final product, making weed management vital. An important factor in L. multiflorum management in Oregon is the fact that this species is cultivated as a crop, often referred to as annual ryegrass, and is also one of the major weeds in the state. For this work, we will refer to the species as L. multiflorum since the names annual ryegrass and Italian ryegrass both refer to the same species.
Because L. multiflorum weed and crop are the same species, crosses may occur. This compatibility could serve as a bridge for the introduction of herbicide resistance into the crop and cause undesirable gene flow scenarios. (Ellstrand Reference Ellstrand2003; Ellstrand et al. Reference Ellstrand, Prentice and Hancock1999; Martins et al. Reference Martins, Sánchez-Olguín, Perez-Jones, Hulting and Mallory-Smith2014; Sarangi et al. Reference Sarangi, Tyre, Patterson, Gaines, Irmak, Knezevic, Lindquist and Jhala2017; Zapiola et al. Reference Zapiola, Campbell, Butler and Mallory-Smith2008).
Oregon L. multiflorum production includes two types of cultivars: diploids (2n = 2x = 14) (Kew 2020) and tetraploids (2n = 4x = 28) (Lamote et al. Reference Lamote, Baert, Roldán-Ruiz, De Loose and Van Bockstaele2002). No studies have been conducted to document the ploidy diversity of L. multiflorum weed populations to assess whether only diploid populations are weedy.
Understanding the distribution and the frequency of herbicide resistance in a region is the first step in gathering information for farmers, agronomists, and the industry about the best approaches to minimize resistance (Culpepper et al. Reference Culpepper, Whitaker, MacRae and York2008; Hanson et al. Reference Hanson, Shrestha and Shaner2009; Hanzlik and Gerowitt Reference Hanzlik and Gerowitt2016; Hicks et al. Reference Hicks, Comont, Coutts, Crook, Hull, Norris, Neve, Childs and Freckleton2018; Jasieniuk et al. Reference Jasieniuk, Ahmad, Sherwood, Firestone, Perez-Jones, Lanini, Mallory-Smith and Stednick2008; Keshtkar et al. Reference Keshtkar, Mathiassen, Moss and Kudsk2015; Owen and Powles Reference Owen and Powles2009). Surveys in northern Idaho and eastern Washington have been conducted to understand the spread and frequency of herbicide-resistant L. multiflorum (Rauch et al. Reference Rauch, Thill, Gersdorf and Price2010). Despite well-documented cases of herbicide-resistant L. multiflorum in Oregon (Avila-Garcia and Mallory-Smith Reference Avila-Garcia and Mallory-Smith2011; Betts et al. Reference Betts, Ehlke, Wyse, Gronwald and Somers1992; Liu et al. Reference Liu, Hulting and Mallory-Smith2014, Reference Liu, Hulting and Mallory-Smith2016; Martins et al. Reference Martins, Sánchez-Olguín, Perez-Jones, Hulting and Mallory-Smith2014; Perez-Jones et al. Reference Perez-Jones, Park, Colquhoun, Mallory-Smith and Shaner2005), no survey has been conducted to assess the presence of herbicide resistance in the Willamette Valley. The objectives of this study were to measure the frequency and distribution of L. multiflorum, evaluate resistance to common herbicides used in grass seed and wheat (Triticum aestivum L.) production, and assess the ploidy levels of L. multiflorum weed populations in the Willamette Valley of Oregon.
Materials and Methods
Survey and Sampling Design
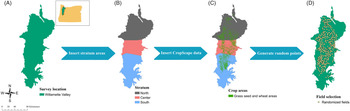
A 2-yr survey was conducted in 2017 and 2018 using a stratified design in which the Willamette Valley was divided into three strata (North, Center, and South) according to agricultural land acreage of the crops of interest (Figure 1). The surveyed sites were randomly selected using available data from the USDA’s CropScape data layer program regarding crop geospatial location (Boryan et al. Reference Boryan, Yang, Mueller and Craig2011) to generate location data of grass seed crops and wheat fields in the Willamette Valley. Random selection of fields was made using a fishnet of rectangular cells in ArcMap (ArcGIS Desktop 2019 v. 10.8, Environmental Systems Research Institute, Redlands, CA 92373). The center of each cell was used to create a point, and those that fell inside a field of at least 8 ha were selected, because fields with less than 8 ha are likely to be errors from CropScape and not an agricultural field, and 225 fields were randomly selected for each year. From these fields, 75 fields were randomly selected and surveyed. The focus of the survey was on wheat and tall fescue fields, because these crops represent a large portion of Willamette Valley agriculture. These are the crops most affected by herbicide-resistant L. multiflorum, according to grower reports from the region; however, CropScape data did not differentiate between grass species grown for seed species; thus, many of the randomized points were grass seed species other than tall fescue. Fields of other crops were surveyed, except where the crop was annual or perennial ryegrass (98 fields in 2017 and 105 fields in 2018). Ryegrass fields were not included in the survey due to the difficulty of differentiation between crop and weed. Lolium multiflorum was evaluated as present or absent.

Figure 1. Survey design. Stratified sampling design: (A) Willamette Valley in western Oregon as the survey area; (B) stratification in three areas according to acreage (North in brown, Center in pink, and South in blue); (C) spatial data from CropScape added to the map; (D) survey locations selected by ArcMap algorithm.
Survey and sampling were conducted during the summer close to grass seed maturity of each year (June and July) to ensure that L. multiflorum was present and seeds could be harvested. A visual estimate of weed count was made in a 60-m2 area in each field by walking in a “W” formation to estimate plant density. Variables collected in each field were crop species, L. multiflorum presence and density, elevation, and GPS coordinates. Lolium multiflorum plant counts were grouped in three density levels designated as low (1 to 9 plants m−2), medium (10 to 19 plants m−2), and high (20 or more plants m−2). Crop types were wheat, tall fescue, clover (Trifolium spp.), orchardgrass (Dactylis glomerata L.), or tree crops represented by hazelnut (Corylus avellana L.) and plum (Prunus subg. prunus) orchards.
Herbicide-Resistance Screening
Whole-Plant Screening
Whole plant screening for resistance to eight POST herbicides (Table 1) was conducted in a greenhouse trial using a completely randomized design with four replications. The study was performed twice. Ten-day-old seedlings of each population were transplanted into four 24 by 24 cm square plastic trays (16 seedlings per tray) filled with commercial potting mix (Sunshine® Mix 1 potting mix, Sun Gro Horticulture, 110th Avenue NE, Suite 490, Bellevue, WA 98004). Each tray was a replication. Plants were watered daily and treated once a week with a standard 20-20-20 fertilizer (Miracle-Gro® water-soluble, Scotts Company, Marysville, OH 43040).
Table 1. POST and PRE herbicides’ active ingredients, trade names, WSSA groups, and rates used for of Lolium multiflorum herbicide resistance screening tests.

a POST treatments were sprayed using an air cabinet sprayer; PRE treatments utilized a seed germination assay using an agar medium solution with herbicide.
b Corteva Agriscience, Wilmington, DE, USA; https://www.corteva.com.
c Valent U.S.A LLC, Walnut Creek, CA – USA; https://www.valent.com.
d Syngenta Crop Protection, LLC, Greensboro, NC, USA; https://www.syngenta-us.com.
e Bayer CropScience, St. Louis, MO, USA; https://www.cropscience.bayer.com.
f Loveland Products, Inc. Loveland, CO, USA; https://www.lovelandproducts.com.
g BASF Corporation, 26 Davis Drive, Research Triangle Park, NC; https://agriculture.basf.com.
h Sprayed with NIS (nonionic surfactant) 0.25 % v/v.
i Sprayed with NIS 0.25 % v/v + AMS (ammonium sulfate) 3.36 kg ha−1.
When plants reached the 2-leaf stage and were 10 to 16 cm in height, herbicides were applied at the manufacturers’ recommended rates for L. multiflorum control. Herbicides were applied using an air cabinet sprayer (Generation III Spray Chamber, De Vries Manufacturing, 86956 State Hwy 251, Hollandale, MN 56054) with an even flat-fan spray TeeJet® nozzle 8004 (Spraying Systems, 200 W. North Avenue, Glendale Heights, IL 60139) at 275 kPa set to deliver 187 L ha−1.
Survival counts and image analysis to measure green area reduction using ImageJ software (Ali et al. Reference Ali, Streibig, Duus and Andreasen2013) were collected 21 d after treatment. For the image analysis, trays were placed over a black background, and a Fujifilm Xpro-2 camera with a 23-mm 2.0 Fujifilm (FUJIFILM Manufacturing USA, Inc., 211 Pucketts Ferry Road, Greenwood, SC 29649) lens was set into a tripod with the lens 64 cm from the soil surface; a 30-cm ruler was placed in the tray, and a photo was taken to calibrate and standardize the software global scale. The camera was set to capture raw files with 4,000 by 6,000 pixel resolution, and images were converted to TIFF files. The color threshold method ISOdata (Ridler and Calvard Reference Ridler and Calvard1978) using a Lab color space (Tomasi and Manduchi Reference Tomasi and Manduchi1998) with a coloring space of L (lightness from black to white) ranging between 80 and 255, a (lightness from green to red) ranging from 0 to 132, and b (lightness from blue to yellow) ranging from 132 to 255 was used to measure the green area of each file. A macro was written to loop the analysis over multiple images simultaneously. Due to the negative correlation between survival and green area reduction, both measurements were used to classify the resistance level (Supplemental Figure 1).
Populations were classified as having one of three resistance levels to each herbicide tested (Owen and Powles Reference Owen and Powles2009): resistant (20% or more of survival and less than 70% green area reduction), mixed (2% to 19% survival and green area reduction between 70% and 90%), and susceptible (less than 2% survival and green area reduction at least 90%). The resistance level refers to a population that has resistance already well established, the mixed level refers to the presence of both resistant plants and susceptible plants in the tested population, and the susceptible level refers to a population for which the herbicide controlled almost all or all plants. Plants were considered alive if they showed signs of heading by 35 d after treatments and could complete their life cycle (i.e., produce seeds). Populations were also classified according to the resistance patterns: multiple resistance if the population was resistant to more than one mechanism of action; or cross-resistance if the population had resistance to more than one herbicide from different chemical families with the same mechanism of action.
Seed germination and seedling growth bioassays were conducted to screen for resistance by measuring seed germination and seedling growth in a medium containing a discriminant herbicide dose of PRE herbicides (Table 1). This methodology was used to isolate the plant response to only the herbicide, remove the soil influence, avoid environmental variation, and facilitate germination counts. This assay was developed based on previous research using this method to detect grass weed species biotypes resistant to acetyl-CoA carboxylase (ACCase) inhibitors (Beckie et al. Reference Beckie, Heap, Smeda and Hall2000; Murray et al. Reference Murray, Friesen, Beaulieu and Morrison1996; Tal et al. Reference Tal, Kotoula-Syka and Rubin2000). Herbicide rates were defined by a seed dose–response bioassay (Supplemental Figure 2) using a four-parameter log-logistic dose–response model for multiple susceptible and resistant L. multiflorum populations. A completely randomized block design with four replications was used, and the study was repeated. Fifty seeds of each population were placed in 11 by 11 by 2.8 cm germination boxes (156C container, Hoffman Manufacturing, Corvallis, OR 97330) containing the gel medium with herbicide. The gel medium consisted of 100 ml of a 10% agar solution using distilled water. The agar solution was microwaved for 2 min and placed in a water bath set for 50 C. Herbicides were only added and mixed into the solution once it reached 50 C to avoid degradation due to heat. Seedling damage and germination were visually assessed. Seedling area image analysis was made 10 d after the start of the trial to measure seedling area and growth as previously described. Seeds were considered to be germinated if both radicle and coleoptile were visible and were each at least 3 mm in length. Populations were classified in the three resistance levels, as previously described, based on seedling area and damage and germination.

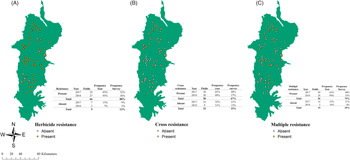
Figure 2. Distribution of herbicide resistance (A), cross-resistance (B), and multiple resistance (c) in the Willamette Valley, OR. Yellow dots represent presence of the resistance pattern, while white dots represent its absence. Each map table shows the number of fields per year and the frequency of absence and presence per year and in the years combined.
Ploidy-Level Screening
DNA amount and ploidy level of each collected population were measured using an indirect approach by measuring the holoploid (2C) (Greilhuber et al. Reference Greilhuber, Doležel, Lysák and Bennett2005) relative genome with a flow cytometer (Contreras and Shearer Reference Contreras and Shearer2018; Doležel et al. Reference Doležel, Greilhuber and Suda2007; Lattier et al. Reference Lattier, Chen and Contreras2019; Rothleutner et al. Reference Rothleutner, Friddle and Contreras2016). Fifty seeds of each population were placed in 24 by 24 cm plastic trays and germinated in growth chambers set for 12 h of light with a temperature regime of 23/15 C. Plants were watered daily and fertilized once a week with a standard 20-20-20 fertilizer (Miracle-Gro® water-soluble, Scotts Company). At 18 d after germination, six plants (replications) from each population were selected randomly. Two expanded leaves were selected, and approximately 1.5 cm2 was sampled from each leaf. For each sample, leaves from a reference genome, tomato (Solanum lycopersicum L.), which has a 2C value of 1.96 pg, were added to each sample. This species was chosen as a reference because it has a 2C value smaller than diploid L. multiflorum, allowing for the differentiation of peaks between tetraploid and diploid L. multiflorum and the calculation of holoploid relative genome size (Supplemental Figure 3). Each leaf sample was chopped using a razor blade in the presence of 400 ml of a buffer solution (CyStain Ultraviolet Precise P Nuclei Extraction Buffer, Sysmex, Gorlitz, Germany). The chopped leaf plus buffer solution was passed through a gauze filter (30-mm pore size) and then placed in a 3.5-ml plastic tube. A fluorochrome stain (4′,6-diamidino-2-phenylindole [DAPI]) was added to the solution (CyStain Ultraviolet Precise P Staining Buffer, Partec, Sysmex America, 577 Aptakisic Road, Lincolnshire, IL 60069). A flow cytometer (CyFlow Ploidy Analyzer, Partec) calibrated to analyze at least 3,000 nuclei per sample was used to analyze the samples. A DNA picogram equation (Equation 1) was used to calculate the 2C value. The results were compared with the 2C mean values from two reference cultivars of L. multiflorum, diploid ‘Gulf’ (Weihing Reference Weihing1963) and tetraploid ‘TAMTBO’ (Nelson et al. Reference Nelson, Crowder, Turner, Evers and Rouquette2007).
 $$2{\rm{C}}\ {\rm{value}}\left( {{\rm{DNA}}\ {\rm{pg}}} \right) = {\rm{Reference}}\ {\rm{2C}}\ {\rm{value}} \times {{{\rm{sample}}\ {\rm{2C}}\ {\rm{mean}}\ {\rm{peak}}\ {\rm{position}}} \over {{\rm{reference}}\ {\rm{2C}}\ {\rm{mean}}\ {\rm{peak}}\ {\rm{position}}}}$$

Figure 3. Frequency of resistant in tested populations for the most common mechanisms of action (MOA) and combinations thereof. Mechanisms of action include acetolactate synthase (ALS), acetyl CoA carboxylase (ACCase), 5-enolpyruvylshikimate-3-phosphate (EPSPS), and very-long-chain fatty-acid (VLCFA) and photosystem II (PSII) inhibitors.
Data Analysis
Maps were constructed using ArcGIS v. 2.3 and Oregon spatial data (Oregon Spatial Data Library n.d.). Field points and shapefiles were projected to World Geodetic System 84 (WGS 84). Data were analyzed and organized using the package collection Tidyverse (Wickham et al. Reference Wickham, Averick, Bryan, Chang, McGowan, François, Grolemund, Hayes, Henry and Hester2019) and the package Survey (Lumley Reference Lumley2004) in R software v. 3.6 (R Software Project Reference Software Project2018) for the inclusion of survey design and study area for frequency calculation, respectively. A binomial logit regression was fit to the model for the odds ratio of L. multiflorum, herbicide resistance, multiple resistance, and cross-resistance for elevation, plant density, and crop type. The model was subjected to a Wald test to check the overall effects of each response variable. The packages aod (Lesnoff and Lancelot Reference Lesnoff and Lancelot2012) and stats (R Software Project Reference Software Project2018) were used for model fitting. A nearest neighbor analysis was conducted using the ArcGIS toolbox to test for cluster patterns of L. multiflorum and resistance presence. The cluster patterns were classified by the algorithm as random, clustered, or dispersed. The distance between fields was measured using Euclidian distance and a study area of 50,000 ha (grass and wheat areas combined in the surveyed area) according to USDA-NASS spatial data (Boryan et al. Reference Boryan, Yang, Mueller and Craig2011) using Equation 2 to calculate the z-statistic value:
 $$z = \left[ {{{\overline d - \sum ({d_i})} \over {\sqrt {0.0683 \times {A \over {{N^2}}}} }}} \right]$$
where d refers to the nearest neighbor distance, A refers to the study area, and N to the number of points.
Results and Discussion
Lolium multiflorum Presence
Of the 150 fields surveyed in 2017 and 2018, L. multiflorum was present in 50% (75 fields), with a larger percentage in fields surveyed in 2017 (Supplemental Table 1). Lolium multiflorum presence was similar over the strata (North, Center, and South) (Table 2). It was present in 40% of the tall fescue fields and 69% of the wheat fields. Lolium multiflorum presence was affected by crop (P-value = 0.029). For instance, L. multiflorum was 3.12 and 4.93 times more likely to be found in a wheat field and orchardgrass than in tall fescue, respectively (Table 2 ). Lolium multiflorum infestations in wheat fields were greater compared with tall fescue fields, suggesting a stronger selection pressure in wheat may be due to the greater reliance on ALS and ACCase herbicides.
Table 2. The chances of finding Lolium multiflorum according to elevation, type of crop, and location based on odds ratio using a binomial-logit regression analysis. a

a Lower, 95% confidence interval; Upper, 95% confidence interval.
b Crops and strata were compared using tall fescue and the North stratum as references, respectively.
c 0.05 alpha level of P-value significance. NS, not significant.
Lolium multiflorum populations were evenly distributed across the surveyed area. These results also point to a lack of effectiveness of control that increases the soil seedbank. Previous studies report that if L. multiflorum is properly controlled, the seedbank is drastically reduced after 2 yr (Brewster et al. Reference Brewster, Donaldson and Mallory-Smith1995; Rampton and Ching Reference Rampton and Ching1966). In this survey, the frequency of L. multiflorum in the surveyed fields probably is a result of poor control followed by increase in the seedbank. Thus, new studies should focus on examining L. multiflorum seedbanks and quantifying the seeds present to determine the factors contributing to the observed large L. multiflorum presence (Buhler et al. Reference Buhler, Hartzler and Forcella1997; Davis Reference Davis2006).
Lolium multiflorum Density
In the fields where L. multiflorum was present, approximately 42% had a high plant density (more than 20 plants m−2), and 36% of the surveyed fields had a low plant density (9 or fewer plants m−2). The frequency of high-density sites was equally distributed among the North, Center, and South strata. Low and medium densities were less prevalent in the South stratum. In most of the crops, the predominant density level was high, except in tall fescue fields, with 48% of the fields in the low-density category. This low density observed in tall fescue fields is likely due to the purity requirements for tall fescue seed production. Oregon seed certification does not certify seeds with less than 98% purity. Tall fescue seed producers are more likely to scout and control weed escapes after an herbicide application.
High L. multiflorum density in the surveyed fields could be a result of the difficulty of controlling resistant populations. The results of this survey indicate that multiple resistance is more likely to be present where high plant densities are observed. These findings agree with previous research reporting that weed densities were correlated with an increase in weed abundance due to the presence of multiple resistance (Hicks et al. Reference Hicks, Comont, Coutts, Crook, Hull, Norris, Neve, Childs and Freckleton2018).
Herbicide-Resistance Presence
Resistant and mixed populations were distributed throughout the Willamette Valley, which indicates that previously characterized populations are not unique to particular regions (Liu et al. Reference Liu, Hulting and Mallory-Smith2014, Reference Liu, Hulting and Mallory-Smith2016). Similar frequencies of resistance in other locations were documented, especially when compared with adjacent states (Jasieniuk et al. Reference Jasieniuk, Ahmad, Sherwood, Firestone, Perez-Jones, Lanini, Mallory-Smith and Stednick2008; Rauch et al. Reference Rauch, Thill, Gersdorf and Price2010).
Herbicide-resistance screening showed that the overall frequency of populations with herbicide resistance was 88% (66 populations) (Figure 2). Frequency of populations of L. multiflorum with multiple resistance was 75% (56 populations) with no differences in frequency between the years. Cross-resistance frequency was 67% (50 populations) with similar percentages between the years (Figure 2). Binomial logit regression for overall herbicide-resistance presence did not indicate any interaction with the crop, density, location, or elevation.
Sixty-one percent (46 populations) of the populations exhibited both cross-resistance and multiple resistance. Twenty-nine percent (22 populations) of the cross- and multiple-resistant populations were located in the North stratum, 20% (15 populations) in the Center stratum, and 8% (9 populations) in the South stratum. Fifty percent of tall fescue fields had multiple and cross-resistance present (22 fields). In wheat, 88% (16 fields) of the fields had both multiple and cross-resistance (Supplemental Table 2).
Multiple resistance was correlated with plant density (P-value < 0.01). Multiple resistance was 5.2 and 7.5 times more likely to be found in populations with medium and high densities compared with low density. No effect of stratum was observed. Multiple resistance and cross-resistance were 3.9 and 10.34 times more likely to be found, respectively, in wheat fields compared with tall fescue fields (Supplemental Table 3). However, the Wald test did not indicate any relationship between crop type and cross-resistance.
Table 3. Nearest neighbor cluster analysis results for types of resistance and the most frequent mechanism of action.

a Abbreviations: ACCase, acetyl CoA carboxylase; EPSPS, 5-enolpyruvylshikimate-3-phosphate synthase; ALS, acetolactate synthase.
b Clustering patterns represent resistant population distribution over the surveyed area.
* 0.05 alpha level of P-value significance.
Only multiple resistance had a clustered distribution, possibly because it was found mostly in the wheat fields that are primarily located in the North stratum (Table 3). Random distribution was found for ACCase, ALS, and 5-enolpyruvylshikimate-3-phosphate synthase (EPSPS) mechanisms of action. The analysis for the resistance present for each tested herbicide showed a cluster pattern for mesosulfuron-resistant populations in the surveyed area. In contrast, all the other herbicides had random or dispersed patterns for all levels of resistance (Table 4).
Table 4. Nearest neighbor cluster analysis results for resistant populations for each herbicide tested.

a Fluf + Metr, flufenacet + metribuzin.
b Clustering patterns represent resistant population distribution over the surveyed area.
* 0.05 alpha level of P-value significance.
** 0.10 alpha level of P-value significance.
POST-Herbicide Resistance
Cases of multiple and cross-resistance were the most frequent patterns of resistance observed (Figure 2). Many of those cases were located in the North stratum, where most of the wheat fields were located. This large frequency of resistance in wheat fields is probably due to the dependency on ALS- and ACCase-inhibiting herbicides in this crop, which would create a high selection pressure on this species. Previous research in different areas showed similar results. (Hicks et al. Reference Hicks, Comont, Coutts, Crook, Hull, Norris, Neve, Childs and Freckleton2018; Llewellyn and Powles Reference Llewellyn and Powles2001; Owen and Powles Reference Owen and Powles2009; Owen et al. Reference Owen, Martinez and Powles2014). The survey results also pointed to a strong relationship between ALS- and ACCase-inhibitor resistance being present, as most populations tested were resistant to both mechanisms of action.
The most frequent mechanisms of action were resistance to ACCase, ALS, and EPSPS inhibitors and combinations thereof. Thirty-three percent of the populations had resistance to both ALS and ACCase inhibitors. The most common combinations of multiple resistance were ALS + ACCase inhibitors, very-long-chain fatty-acid (VLCFA) inhibitors + ALS + ACCase inhibitors, EPSPS + ALS + ACCase inhibitors, and EPSPS + ALS inhibitors (Figure 3).
Resistance to the ACCase inhibitors pinoxaden, quizalofop, and clethodim was confirmed (Figure 4). Resistance was prevalent to pinoxaden (37%) and quizalofop (40%) and occurred uniformly within the surveyed area. For clethodim, 11% of populations (8 populations) were resistant, and 21% (16 populations) were mixed. For crop type, 28% (5 fields) of the wheat fields had clethodim-resistant populations (Supplemental Tables 4–6).

Figure 4. Resistance level frequency (%) within 75 populations for each herbicide tested in the 2-yr survey in western Oregon. Level of resistance: resistant (20% or more survival and less than 70% green area reduction), mixed (2% to 19% survival and green area reduction between 70% and 90%), and susceptible (less than 2% survival and green area reduction of at least 90%).
The frequency of resistance to ALS-inhibiting herbicides was similar to results for ACCase inhibitors. For the two ALS-inhibiting herbicides tested, 84% of the populations were resistant to mesosulfuron and 61% to pyroxsulam. Mesosulfuron and pyroxsulam cases of resistance were distributed over the survey area. Most of the ALS-inhibitor resistance cases were cross-resistant (48 populations). The North stratum had more resistance present compared with the South and Center strata. Mesosulfuron-resistant populations were found in 36% of the populations from the North stratum, while pyroxsulam resistance was present in 24% (Supplemental Table 4). Tall fescue fields had a frequency of 33% (13 fields) with populations resistant to mesosulfuron and 45% (18 fields) with mixed populations; the frequency for tall fescue fields with populations resistant to pyroxsulam was 18% (7 fields), and 33% (13 fields) had mixed populations (Supplemental Tables 5 and 6).
Glyphosate-resistant L. multiflorum populations were spread throughout the Willamette Valley. The overall frequency (resistant and mixed populations) was 43%, with 28% (21 populations) resistant and 15% (11 populations) mixed (Figure 4). Resistant populations were found in all three levels of plant density. A greater number of cases of resistance were found in the North stratum, where 20% (15 populations) of the populations were classified as resistant to glyphosate.
Glufosinate resistance was not commonly found in this survey. Two populations in the North stratum were classified as mixed populations. One population was located in a hazelnut field and the other in an orchardgrass field. Paraquat resistance was observed in six populations. All cases were located in the North stratum with high plant density and in tree crops (hazelnuts and plums). This survey is the first to report paraquat-resistant L. multiflorum in Oregon.
A random distribution pattern was observed for populations with mixed resistance across all herbicides tested. In wheat fields, no mesosulfuron-susceptible populations were found, with 83% of the fields having resistance present. The other surveyed crops had similar frequencies of resistance to mesosulfuron and pyroxsulam. Even in crops such as clover, for which the tested ALS inhibitors are not registered for use, resistance is likely, because clover is rotated with crops in which the ALS herbicides are used. Another potential explanation could be gene flow between L. multiflorum in neighboring fields (Beckie et al. Reference Beckie, Busi, Bagavathiannan and Martin2019).
The common presence of multiple and cross-resistance is a result of overreliance on herbicides, highlighting the necessity of new management approaches that integrate multiple tactics to reduce the selection and spread of herbicide resistance, such as the increase of crop rotation or the use of mechanical control. Despite the high frequency of resistance to multiple herbicides, some of the herbicides tested are still providing good control, for example, glufosinate. Because glufosinate is not registered for use in wheat, it is not an option for controlling L. multiflorum. However, Oregon already has documented cases of glufosinate-resistant L. multiflorum (Avila-Garcia and Mallory-Smith Reference Avila-Garcia and Mallory-Smith2011).
PRE-Herbicide Resistance
For the PRE herbicides flufenacet + metribuzin, pronamide, and pyroxasulfone, only resistance to flufenacet + metribuzin was found (Figure 4). Only one population was classified as mixed for pyroxasulfone resistance, while 13% (10 populations) of the tested populations were classified as mixed for pronamide. Populations resistant to flufenacet + metribuzin had a similar distribution among the levels of plant density. Populations resistant to flufenacet + metribuzin were mostly found in the North and South strata; 6% of the populations tested from the Center stratum were flufenacet + metribuzin resistant. Twenty percent of the tall fescue fields had resistant populations, and 18% had mixed populations for flufenacet + metribuzin; pronamide and pyroxasulfone controlled most populations tested. In the wheat fields, 17% of the tested populations were resistant to flufenacet + metribuzin, and 33% were classified as mixed; the only case of mixed resistance to pyroxasulfone was found in a wheat field. Populations resistant to flufenacet + metribuzin were documented in a hazelnut orchard and oat (Avena sativa L.) fields, but not in clover fields. The numerous cases of resistance to flufenacet + metribuzin indicate the need for a better understanding of the mechanism of resistance, which was recently characterized as metabolism-based in some populations (Dücker et al. Reference Dücker, Zöllner, Lümmen, Ries, Collavo and Beffa2019).
No pyroxasulfone-resistant populations were identified; however, one mixed population was documented. This herbicide provided excellent control of most L. multiflorum populations, and it is registered in wheat and grass seed crops. Only a single plant in a single population germinated in the presence of the herbicide; however, evolution and selection of biotypes resistant to pyroxasulfone can occur in Lolium spp. (Brunton et al. Reference Brunton, Boutsalis, Gill and Preston2018; Busi et al. Reference Busi, Gaines, Walsh and Powles2012, Reference Busi, Porri, Gaines and Powles2018; Tanetani et al. Reference Tanetani, Kaku, Kawai, Fujioka and Shimizu2009).
The large number of populations classified as having a mixed response to most of the tested herbicides should receive the greatest attention; due to the low number of individuals carrying the resistance, these populations could still be managed. Previous research shows that to control and suppress the spread of resistance, action needs to be taken before the number of individuals carrying the trait in the population increases (Evans et al. Reference Evans, Tranel, Hager, Schutte, Wu, Chatham and Davis2016; Hurley and Frisvold Reference Hurley and Frisvold2016). A combined effort involving industry, farmers, and academia is needed to define a better management approach and reduce the spread and evolution of these populations. Future studies should continue this survey to expand data in this area and create evaluation by year comparisons of herbicide-resistance evolution and spread.
Ploidy-Level Screening
Five populations (6.67%) had tetraploid plants. Four populations were in tall fescue fields, and one population was in a wheat field. The average 2C in picograms from the diploid populations was 5.30, while the average size for tetraploid was 10.28 (Supplemental Table 1; Supplemental Figure 2). None of the tetraploid populations were resistant to the tested herbicides.
Because no resistance was documented in tetraploid Lolium plants, the use of tetraploid cultivars could provide a way to mitigate the spread of herbicide resistance in cover crop seeds. Furthermore, incompatibility between tetraploids and diploids occurs because the progeny of this cross is a sterile triploid (Gill and Bajaj Reference Gill and Bajaj1987; Nichiyama and Inomata Reference Nichiyama and Inomata1966; Watkins Reference Watkins1932). These compatibility issues were documented in previous studies with diploid and tetraploid L. perenne, in which no barrier for fertilization was found; however, triploid seeds with low vigor and germination rates were produced (Griffiths et al. Reference Griffiths, Pegler and Tonguthaisri1971). Other studies suggest that the formation of 2n eggs from the crosses between diploid and tetraploid L. perenne can occur when diploid plants are fertilized with tetraploid pollen, producing rare cases of triploid descendants. However, the tetraploid offspring were likely formed by the fertilization of unreduced eggs of the diploid plant comprising meiotic polyploids (Lamote et al. Reference Lamote, Baert, Roldán-Ruiz, De Loose and Van Bockstaele2002). These studies only reported results about the fertilization of diploid plants by 2n pollen and did not test reciprocal crosses.
Even though the coexistence between diploid and tetraploid is possible, the increased adoption of tetraploid L. multiflorum in Oregon could be a way to prevent crosses between diploid L. multiflorum weeds and crop cultivars. This hypothesis remains to be tested. Increasing the adoption of tetraploid cultivars could also help in the identification of seed contamination by using flow cytometry to identify diploid L. multiflorum weed seeds in harvested crops (Griffiths et al. Reference Griffiths, Pegler and Tonguthaisri1971; Lamote et al. Reference Lamote, Baert, Roldán-Ruiz, De Loose and Van Bockstaele2002).
This study is the first survey on herbicide resistance and ploidy diversity in L. multiflorum in western Oregon and it will serve as a base for future studies aimed at understanding the spread and evolution of resistance and how to minimize it with potential alternative management approaches. This research did not determine the mechanisms involved in the tested populations; therefore, studies should be initiated to investigate the mechanisms, especially in populations with multiple resistance. Future studies should continue this survey to increase the data and increase the power to predict herbicide-resistance evolution over time in western Oregon. Establishing gene flow studies is paramount to understanding the rate and distance of resistant gene movement and their impact on multiple resistance.
Acknowledgments
Funding for this project was provided in part by the Oregon Grass Seed Council (494 State Street, No. 220, Salem, OR 97301). No conflicts of interest have been declared. We thank all Oregon growers for allowing us access to their properties.
Supplementary material
To view supplementary material for this article, please visit https://doi.org/10.1017/wsc.2021.2


 Open access