


The metabolic syndrome (MetS) is a common multi-component disorder including abdominal obesity, dyslipidaemia, hypertension and hyperglycaemia, which is known to be associated with an increased risk of CVD and type 2 diabetes( Reference Teran-Garcia and Bouchard 1 ). Development of the MetS represents an intricate interaction between genetic susceptibilities and environmental exposures( Reference Joy, Lahiry and Pollex 2 ). Several polymorphisms in APOA1 and APOC3 have been described and associated with metabolic diseases. ApoA1, a major component of HDL-cholesterol (HDL-C), is involved in the activation of lecithin cholesterol acyltransferase, which mediates the reverse cholesterol transport from peripheral tissues to the liver, and the inverse relationship between plasma HDL-C levels and CVD has been attributed to this function. ApoC3, a major component of TAG-rich lipoproteins and a minor component of HDL-C, is a non-competitive inhibitor of lipoprotein lipase, suggesting its important role in the catabolism of TAG-rich lipoproteins. The G allele of the APOC3 3238C>G rs5128 variant has been shown to be associated with increased concentrations of apoC3, apoB, LDL-cholesterol and plasma TAG, as well as high blood pressure (BP) and hence possibly the development of CHD. Common polymorphisms, such as − 75G/A and +83C/T, have been identified, respectively, in the promoter region and first intron of the APOA1 gene located at 11q23. The A allele is known to be associated with higher APOA1 and HDL-C levels in some populations, whereas the C allele is associated with higher BMI and waist:hip ratio in type 2 diabetic subjects; however, these associations were not confirmed in other studies( Reference Albahrani, Usher and Alkindi 3 – Reference Olivieri, Bassi and Stranieri 6 ). These inconsistencies could be the result of interactions with environmental factors that modulate the effect of this genetic polymorphism. It is well known that all people are not affected equally by unhealthy lifestyles, with some being more sensitive to deleterious effects than others, heterogeneity which may reflect complex interactions between genetic susceptibilities and environmental factors, particularly diet( Reference Ordovas, Corella and Cupples 7 ). To date, most studies have focused on the interaction of dietary fat exposure and genetic background with the risk of the MetS and its phenotypes( Reference Phillips, Tierney and Roche 8 ). MetS risk has been shown to increase among GG homozygote individuals for APOA1 rs670, who had high intakes of fat (>35 % energy) and monounsaturated fat (>14 % energy)( Reference Phillips, Goumidi and Bertrais 9 ). Extracting and defining dietary patterns by evaluating the in-depth associations between nutrients rather than just selecting individual dietary components need to be developed to advance gene–nutrition interaction studies( Reference Phillips 10 , Reference Martinez-Gonzalez and Martin-Calvo 11 ). Therefore, we aimed to examine the interaction of dietary patterns and three genetic variants of APOA1 (rs670 and rs5069) and APOC3 (rs5128), both independently and in combination, in relation to MetS risk in a nested case–control study of Tehranian adults.
Materials and methods
Study population
The present nested case–control study is part of the Tehran Lipid and Glucose Study, an ongoing population-based cohort study conducted to determine the risk factors of non-communicable diseases in a sample of residents of district no. 13 of Tehran, the capital of Iran. A baseline examination survey was conducted from 1999 to 2001 in 15 005 subjects, aged ≥ 3 years, and follow-up examinations were conducted every 3 years (2002–5, 2006–8 and 2008-11) to update health-related measurements of baseline characteristics and to identify any newly developed diseases( Reference Azizi, Ghanbarian and Momenan 12 ).
Of the initial group, 11 001 and 9807 individuals, aged ≥ 18 years, participated in baseline and second follow-up surveys, respectively; of which, 5280 individuals were excluded because of having the MetS either at baseline or in the second follow-up survey. In the present study, 503 cases were randomly selected from the participants who developed the MetS at the third (n 918) and fourth (n 827) follow-up surveys. After excluding individuals with a history of cardiovascular events, weight loss or gain >5 kg in the last 6 months, pregnancy and lactating, or those taking any CVD/anti-coagulant/steroid or hormonal medication (n 20), 483 cases were included in the present study. Controls were defined as participants with ≤ 1 MetS components at the time the corresponding case developed the MetS. Each case was individually pair-matched with a control randomly by age ( ± 5 years) and sex. After excluding cases/controls lacking DNA purification in the range of 1·7 < A260/A280 < 2 (n 108), and also those whose reported energy intake divided by the predicted energy intake did not qualify for the 3 sd range (n 30), finally 828 subjects (414 pairs) with the MetS and matched controls remained for the analysis. The study protocol was approved by the ethics committee of the Research Institute for Endocrine Sciences, Shahid Beheshti University of Medical Sciences (SBMU), Tehran, Iran. Written informed consent was obtained from each participant.
Dietary intakes
Dietary intake was assessed using a valid and reliable 168-item semi-quantitative FFQ, which included a list of foods with standard serving sizes. Validity correlation coefficients ranged from 0·03 (liquid oil) to 0·77 (simple sugars) in men (median 0·44) and from 0·12 (snacks) to 0·79 (simple sugars) in women (median 0·37)( Reference Esfahani, Asghari and Mirmiran 13 , Reference Mirmiran, Esfahani and Mehrabi 14 ). Based on the macronutrient composition and using the available literature, twenty-five food groups were categorised( Reference Hosseini-Esfahani, Djazaieri and Mirmiran 15 ).
Anthropometric and blood pressure measurements
Weight was measured using digital scales (Seca 707), while the subjects were minimally clothed and without shoes, and recorded to the nearest 100 g. Height was measured using a tape measure (Model 208 Portable Body Meter Measuring Device; Seca) while the subjects were standing, had the shoulders in a normal position and not wearing shoes. BMI was calculated. Waist circumference was measured at the umbilical level using an unstretched tape measure without any pressure to the body surface. Measurements were recorded to the nearest 0·1 cm. BP was measured twice, with at least a 30 s interval, after the participants rested for 15 min. Finally, the mean BP of the two measurements recorded was reported as the BP of the subjects.
Physical activity
Physical activity level was assessed in Tehranian adults using the Persian-translated modifiable activity questionnaire, whose reliability and relative validity was high as reported previously. Data on the frequency and time spent on light, moderate, hard and very hard intensity activities according to the list of common activities of daily life over the past year were obtained. Physical activity levels are expressed as metabolic equivalent-h/week( Reference Ainsworth, Haskell and Whitt 16 – Reference Momenan, Delshad and Sarbazi 18 ).
Laboratory assays
After 12–14 h of overnight fasting, blood samples were drawn into vacutainer tubes between 07·00 and 09·00 hours from all participants in a sitting position( Reference Azizi, Ghanbarian and Momenan 12 ). The samples were centrifuged within 30–45 min of collection according to standard protocols. All biochemical analyses were carried out at the research laboratory of the Tehran Lipid and Glucose Study on the same day of blood collection, using a Selectra 2 autoanalyser (Vital Scientific). Fasting blood glucose level was measured by the enzymatic colorimetric method using glucose oxidase. TAG level was measured by enzymatic colorimetric tests using TAG kits (Pars Azmoon) and glycerol phosphate oxidase. HDL-C level was measured after precipitation of apoB containing lipoproteins with phosphotungstic acid. Assay performance was monitored once every twenty tests using lipid control serum, Percinorm (reference range) and Percipath (pathological range), wherever applicable (Boehringer Mannheim; catalogue no. 1446070 for Percinorm and 171778 for Percipath). Lipid standard (Cfas, Boehringer Mannheim; catalogue no. 759350) was used to calibrate the Selectra 2 autoanalyser on each day of the laboratory analyses, and all samples were analysed only when internal quality control met the standard criteria. Inter- and intra-assay CV were both 2·2 % for serum glucose and 1·6 and 0·6 % for TAG, respectively.
Genetic analysis
For genotyping the APOA1/APOC3 polymorphisms, buffy coats were separated from non-coagulated whole-blood samples and stored at − 70°C until processing. Genomic DNA was extracted by the proteinase K/salting-out method. The PCR followed by the restriction fragment length polymorphism (PCR-RFLP) technique was employed to investigate polymorphisms in gene fragments( Reference Daneshpour, Faam and Mansournia 19 , Reference Truett, Heeger and Mynatt 20 ).
The PCR was performed using the following primers: APOA1 (rs670, − 75G>A and rs5069,+83C>T) (forward: 5′-AGG GAC AGA GCT GAT CCT TGA ACT CTT AAG-3′; reverse: 5′-TTA GGG GCA CCT AGC CCT CAG GAA GAG AGC A-3′); APOC3 (rs5128, C3238>G) (forward: 5′-GGT GAC CGA TGG CTT CAG TT-3′; reverse: 5′-CAGAAG GTG GAT AGA GCG CT-3′). Hybridisation was carried out in a DNA thermal cycler (Corbett Life Science). Amplified DNA was digested with MspI(HpaII) and SacI restriction enzymes (Fermentas) at 37°C overnight( Reference Zou, Hu and Yang 21 ). Fragments were separated by electrophoresis on 2 % agarose gels. DNA fragments were visualised by the gel documentation system (OptiGo; Isogen Life Science); 5 % of all the samples were randomly replicated and genotyped with ≥ 99 % concordance. To confirm the PCR-RFLP results, 5 % of the PCR samples were directly sequenced.
Definitions
The MetS was defined as participants with three or more of the following conditions based on the modified National Cholesterol Education Program/Adult Treatment Panel III ( Reference Azizi, Hadaegh and Khalili 22 , Reference Grundy, Hansen and Smith 23 ): (1) TAG ≥ 1·70 mmol/l ( ≥ 150 mg/dl) or drug treatment; (2) HDL-C < 1·04 mmol/l ( < 40 mg/dl) in men and < 1·30 mmol/l ( < 50 mg/dl) in women or drug treatment; (3) elevated BP ≥ 130/85 mmHg or drug treatment for a previous diagnosis of hypertension; (4) fasting blood glucose ≥ 6·11 mmol/l ( ≥ 110 mg/dl) or drug treatment of hyperglycaemia; (5) waist circumference was coded according to the newly introduced cut-off points for Iranian adults, i.e. ≥ 95 cm for both sexes( Reference Azizi, Hadaegh and Khalili 22 ).
The healthy dietary pattern (HDP) was characterised by a high consumption of different kinds of vegetables, fruits, nuts and seeds, liquid oils, legumes, low-fat dairy products, and whole grains. The Western dietary pattern (WDP) was characterised by a high consumption of fast foods, soft drinks, salty snacks, organ meats, sweets, fish and sweetened fruit juices. The fat–sweet dietary pattern (FSDP) was characterised by a high consumption of sugar, tea and coffee, red meat, solid oils, high-fat dairy products, sweets and green vegetables.
Statistical analyses
Statistical analyses were performed using the Statistical Package for Social Sciences (version 16·0; SPSS) and STATA (Statistics/Data analysis 12·0). A two-sided P value < 0·05 was considered significant. Pearson's χ2 statistic was used to test Hardy–Weinberg equilibrium for SNP and to test the differences in percentages using PowerMarker software. Dietary patterns were identified using factor analysis with varimax rotation based on twenty-five regression residual energy-adjusted food groups (g/d). A total of three factors were retained based on eigenvalues >1, the screen plot and interpretability of the factors. Factor loadings represented the correlation between a factor (dietary pattern) and a variable (food group). In the present study, factor loadings below ± 0·2 are not presented because of the low correlations or low proportions of their food groups explained by the factor, and for easy interpretation of the dietary patterns. Factor scores of each participant were calculated by the sum of multiplying the intake of standardised food groups by their respective factor loadings on each pattern. When the participants had higher scores on a particular factor, they had higher relative adherence to this pattern, compared with others. To compare the characteristics of cases and controls, χ2 and Student's t tests were used for qualitative and quantitative variables, respectively. TAG concentration was log-transformed for statistical analysis. The relationship between characteristics and dietary intakes of the study population across the quartiles of dietary pattern scores was evaluated using the ANCOVA, and the adjusted means were estimated after controlling for age, sex, smoking (current smoker, ex-smoker and never smoked), physical activity (low, moderate and high) and education levels ( ≤ 14 and >14 years). Multiplicative interactions between quartiles of dietary pattern scores and polymorphisms (dominant model) in relation to the risk of the MetS were examined in the whole population and by sex, using conditional logistic regression analysis after adjustment for baseline BMI and using the likelihood ratio test, which is a comparison of the likelihood scores of the two models with and without the interaction terms. Conditional logistic regression analysis was used to examine the combined role of quartiles of dietary pattern scores and genotypes of rs5128 (CC/CG+GG), rs670 (GG/GA+AA) and rs5069 (CC/CT+TT) in predicting MetS risk, using the lowest quartile of dietary pattern scores and the homozygote group with major allele as the reference category both in the whole population and in men and women separately. For diplotype combined analyses, rs670 (GA+AA) and rs5069 (CT+TT) were included in the analysis, compared with other genotype combinations (GG+CC). When APOC3 rs5128 was included in the analysis, the genotype combination comprised rs670 (GA+AA), rs5069 (CT+TT) and rs5128 (CC), compared with other combinations. Conditional logistic regression analysis was used to examine the combined role of quartiles of dietary pattern scores and genotype combinations in predicting MetS risk, which were adjusted for baseline BMI. To determine the P value for trend across the quartiles of dietary pattern scores, logistic regression analysis was used with the median of each quartile of dietary pattern scores as a continuous variable.
Results
The mean age at baseline was 40·7 (sd13) and 41·2 (sd13) years in male cases and controls and 44·0 (sd11) and 44·0 (sd12) years in female cases and controls, respectively. The cases had a higher mean BMI than the controls (26·1 (sd4) v. 22·9 (sd4) kg/m2; P< 0·05) at baseline. In subjects with the MetS, the highest prevalence of MetS risk factors was low HDL-C concentration (78·5 %) and abdominal obesity (74·6 %) (Table 1).
Table 1 Characteristics of the subjects with the metabolic syndrome (with MetS) and the controls (without MetS) of the Tehran Lipid and Glucose Study (Mean values and standard deviations; n 828)

WC, waist circumference; BP, blood pressure; HDL-C, HDL-cholesterol; FBG, fasting blood glucose.
* Mean value was significantly different from that of the control group (P< 0·05).
† BMI ≥ 30 kg/m2, WC ≥ 95 cm for both sexes, elevated BP ≥ 130/85 mmHg, HDL-C < 1·04 mmol/l in men and < 1·30 mmol/l in women, TAG ≥ 1·70 mmol/l, and high FBG ≥ 6·11 mmol/l.
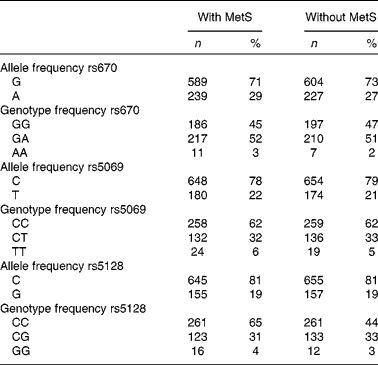
Genotype frequency did not deviate from Hardy–Weinberg equilibrium expectations, except for rs670 (Table 2).
Table 2 Genotype and allele frequency of APOA1 and APOC3 polymorphisms in subjects with the metabolic syndrome (with MetS) and controls (without MetS) of the Tehran Lipid and Glucose Study (Number of alleles and genotype frequencies and percentages; n 828)
Factor loadings of the three major dietary patterns are presented in Table 3.
Table 3 Factor loadings for the three identified dietary patterns in the study participants of the Tehran Lipid and Glucose Study
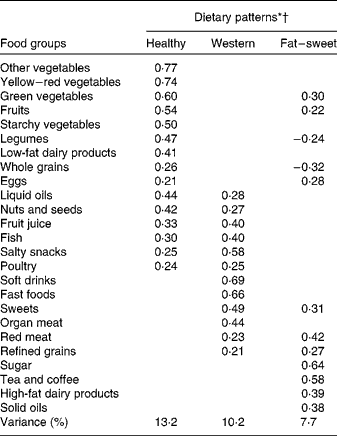
* Values are factor loadings of dietary patterns measured by factor analysis (n 828). Factor loadings below ± 0·2 are not shown in the table for simplicity.
† Eigenvalues >1, Kaiser-Meyer-Olkin (KMO) index: 0·76.
Individuals with higher HDP scores were older and consumed less fat, sweets and sugar, and MUFA than those with lower HDP scores. A higher intake of fat, sweets and sugar was associated with higher WDP scores. The FSDP score was positively associated with the intake of total fat, SFA and MUFA, and inversely associated with the PUFA:SFA ratio (Table 4).
Table 4 Dietary intakes of the participants by quartiles (Q) of dietary pattern scores* (Mean values with their standard errors)

DP, dietary pattern; CHO, carbohydrate.
* Values were adjusted for age, sex, smoking (current smoker, ex-smoker and never smoked), physical activity (low, moderate and high) and education levels ( ≤ 14 and >14 years).
Adjusted OR for MetS risk according to quartile classification of dietary pattern scores by the dominant model of APOA1/APOC3 genotypes are presented in Table 5. The risk of the MetS was not homogeneous in the two APOA1 genotypes across the quartiles of FSDP scores; the A allele carriers of rs670 and the T allele carriers of rs5069 had a lower odds of the MetS in the higher quartiles of FSDP scores compared with GG and CC genotypes of rs670 (P interaction= 0·01) and rs5069 (P interaction= 0·05), respectively. After conducting this analysis separately by sex, the A allele carriers of rs670 had a lower odds of the MetS in the higher quartiles of FSDP scores compared with GG genotypes (men: GG genotype (n 204), OR 1, 7·36, 1·60, 2·94, P trend= 0·17 and GA+AA genotype (n 266), OR 6·82, 5·95, 4·42, 2·26, P trend= 0·02, P interaction= 0·01; women: GG genotype (n 179), OR 1, 0·87, 0·50, 1·84, P trend= 0·71 and GA+AA genotype (n 179), OR 1·47, 1·53, 0·73, 0·35, P trend= 0·02, P interaction= 0·06). In women, the T allele carriers of rs5069 had a lower odds of the MetS in the higher quartiles of FSDP scores compared with CC genotypes (CC genotype (n 235), OR 1, 1·16, 0·54, 0·98, P trend= 0·74 and CT+TT genotype (n 123), OR 2·29, 1·36, 1·08, 0·53, P trend= 0·05, P interaction= 0·34; data not shown).
Table 5 Adjusted OR for the metabolic syndrome according to quartile (Q) classification of dietary pattern (DP) scores by the dominant model of APOA1/APOC3 genotypes* (Odds ratios and 95 % confidence intervals)

APOA1, rs670 (–75G>A), rs5069 (+83C>T); Ref, reference; APOC3, rs5128 (3238C>G).
* OR were calculated using the conditional logistic regression model, adjusted for baseline BMI and the interaction term (SNP × DP scores). Participants were jointly classified (eight groups) according to quartiles of DP scores and dominant model of the rs5128, rs670 and rs5069 genotypes. The lowest quartile of DP scores and homozygote genotype with major allele were used as the reference group.
The examination of the individual WDP scores did not identify an interaction between dietary patterns and genetic variants of APOA1 and APOC3 genotypes. MetS risk appeared to increase significantly in the higher quartiles of WDP scores in the CC homozygote of APOC3 (P trend= 0·04) and in the A (P trend= 0·008) and T (P trend= 0·03) allele carriers of APOA1 rs670 and rs5069, respectively. Also, the conditional logistic regression analysis conducted separately in men and women showed that this trend remains significant in men for the APOA1 SNP. MetS risk increased in the higher quartiles of WDP scores and in the A allele carriers of APOA1 rs670 (GG genotype (n 204), OR 1, 2·24, 1·98, 1·11, P trend= 0·22 and GA+AA genotype (n 266), OR 1·44, 1·35, 2·62, 4·57, P trend= 0·001, P interaction= 0·08) and the T allele carriers of APOA1 rs5069 (CC genotype (n 282), OR 1, 1·50, 1·04, 1·22, P trend= 0·13 and CT+TT genotype (n 188), OR 0·37, 0·44, 1·13, 1·71, P trend< 0·001, P interaction= 0·11). MetS risk increased in the higher quartiles of WDP scores in all the genotypes of APOC3 rs5128 in men (CC genotype (n 304), OR 1, 1·98, 2·53, 2·32, P trend= 0·009 and CG+GG genotype (n 154), OR 1·40, 0·85, 1·71, 3·15, P trend= 0·02, P interaction= 0·56; data not shown).
Adherence to the HDP was associated with MetS risk in GG homozygote individuals of rs670 (P trend= 0·008), an association that did not, however, remain significant after conducting this analysis separately in men and women. MetS risk decreased in the higher quartiles of HDP scores in the CC genotype of APOA1 rs5069 in women (CC genotype (n 235), OR 1, 1·21, 0·78, 0·67, P trend= 0·50 and CT+TT genotype (n 123), OR 0·29, 0·66, 1·36, 1·96, P trend= 0·11, P interaction= 0·03; data not shown).
HDP scores did not modulate the association of the combined genotype carriers of APOA1 and APOA1/APOC3 (Table 6). The diplotype combination genotype of the APOA1 SNP (rs670/rs5069) interacted with adherence to WDP scores in determining the risk of developing the MetS (P interaction= 0·03). The genotype carriers (GA+AA/CT+TT) in the highest quartile of WDP scores had a greater risk of the MetS (OR 3·22, 95 % CI 1·21, 8·58) than those in the first quartile. The combined effect of the major homozygote genotype of APOC3 and the minor allele carriers of APOA1 showed a further increase in the risk of the MetS in the higher quartiles of WDP scores (OR 1, 2·49, 8·73, 6·32, P trend< 0·001) compared with the other combinations (P interaction= 0·003). A significant interaction was found between the quartiles of FSDP scores and the APOA1 diplotype combination genotype (GA+AA/CT+TT). OR for the genotype carriers were 1, 0·65, 0·57 and 0·22 (P trend= 0·006) in the highest to lowest quartiles of FSDP scores, compared with the other combined genotypes (P interaction= 0·03). In the genotype combination of GA+AA/CT+TT/CC, MetS risk was decreased in the higher quartiles of FSDP scores compared with the lower quartiles (P trend= 0·03).
Table 6 Adjusted OR for the metabolic syndrome and combined APOA1/APOC3 genotypes according to quartile (Q) classification of dietary pattern (DP) scores* (Odds ratios and 95 % confidence intervals)

APOA1, rs670 (–75G>A), rs5069 (+83C>T); APOC3, rs5128 (3238C>G).
* OR were calculated using the conditional logistic regression model, adjusted for baseline BMI and the interaction term (SNP × DP scores). Participants were jointly classified (eight groups) according to quartiles of DP scores and risk genotype carriers of rs670 (GA+AA) and rs5069 (CT+TT). The lowest quartile of DP scores and risk genotype carriers were used as the reference group. When APOC3 rs5128 was included in the analysis, the risk genotype combination comprised rs670 (GA+AA), rs5069 (CT+TT) and rs5128 (CC).
Analyses were carried out separately in men and women. In men, MetS risk was increased in the higher quartiles of WDP scores and the diplotype combination genotype of the APOA1 SNP (rs670/rs5069) (GA+AA/CT+TT (n 143), OR 1, 1·29, 4·48, 5·37, P trend= 0·001 and other genotypes (n 327), OR 2·61, 4·18, 3·14, 3·61, P trend= 0·06, P interaction = 0·06). In women, the genotype carriers GA+AA/CT+TT in the highest quartile of FSDP scores had a lower risk of the MetS (GA+AA/CT+TT (n 86), OR 1, 0·89, 0·55, 0·08, P trend= 0·03 and other genotypes (n 272), OR 0·59, 0·55, 0·28, 0·61, P trend= 0·77, P interaction = 0·04; data not shown).
Discussion
In the present nested case–control study of Tehranian adults, we assessed the interactions between dietary patterns and genetic variants of APOA1/APOC3 SNP (rs670, rs5069/rs5128) in relation to MetS risk. The WDP interacted with combined APOA1/APOC3 genotypes in relation to the risk of the MetS. Intakes of the WDP were associated with a higher risk of the MetS among individuals having the major homozygote genotype of APOC3 and the minor allele carriers of APOA1. When sexes were analysed separately, differences in MetS risk became more obvious in men than in women. A significant interaction was also found between the FSDP and the APOA1 diplotypic variable in relation to the risk of the MetS. Decreased MetS risk was observed in individuals with both minor allele carriers of the APOA1 SNP and higher FSDP scores. When sexes were analysed separately, differences in MetS risk became more obvious in women than in men.
Participants with a higher adherence to the HDP had a high risk of the MetS if they were the carriers of the GG genotype or rs670. This may be due to the subjects with the GG genotype being more susceptible to higher energy and cholesterol intakes. In the present study, adherence to the HDP was positively associated with energy intake. Thus, the beneficial effects of the HDP in the prevention of the MetS might be seen more in A allele carriers than in GG genotype subjects. Previous studies have shown that the relationship between energy intake and obesity differed among subjects with different genotypes of the IL-6 receptor (IL6R) gene Asp358Ala (T/G) polymorphism in Japanese men( Reference Song, Miyaki and Araki 24 ) and the Trp64Arg polymorphism of the β3-adrenergic receptor (ADRB3) gene( Reference Miyaki, Sutani and Kikuchi 25 ). This observation can be explained by the fact that total energy intake is more relevant than dietary fat intake, and people merely replace energy from fat with energy from carbohydrates( Reference Sanchez-Moreno, Ordovas and Smith 26 ). Although the mean cholesterol intakes in all the quartiles of HDP scores were in accordance with the recommended guidelines, higher intakes of cholesterol in the higher quartiles of HDP scores may increase the risk of the MetS in the GG genotype of rs670 subjects, an association which might be dependent on cholesterol intake.
In women with the major homozygote of APOA1 rs5069, higher quartiles of HDP scores were associated with a lower risk of the MetS, compared with minor allele carriers who had an increased risk of the MetS.
In all the participants, higher intakes of the WDP were found to be related to an increased risk of the MetS in A and T allele carriers of the APOA1 polymorphism and the CC homozygote of the APOC3 polymorphism. In addition, these analyses were stratified by sex, and in men, the increasing trends of MetS risk remained significant. The present results on the WDP and the MetS are consistent with those of a previous study, in which intakes of the WDP were associated with the risk of developing diabetes among men with a higher genotype risk score( Reference Qi, Cornelis and Zhang 27 ), a finding that highlights the high variability of MetS risk in individuals with different combined genotypes and may be due to different lifestyles. The effect of the WDP on the risk of the MetS is not homogeneous in individuals with different genetic backgrounds. In the present study, individuals consuming a higher WDP had higher intakes of total fat, MUFA and cholesterol. Consistent with a previous study in this population, fast food consumption was associated with the risk of the MetS, which might be due to poor diet quality, higher energy density and glycaemic index, high Na, trans-fatty acid and refined carbohydrate intakes, and the decrease in dietary phytochemical index and dietary total antioxidant capacity, being the main dietary risk factors of the MetS( Reference Bahadoran, Mirmiran and Hosseini-Esfahani 28 ). In addition, processing of these foods generate toxic chemicals that induce insulin resistance( Reference Hofmann, Dong and Li 29 , Reference Peppa, Goldberg and Cai 30 ). However, the molecular mechanisms underlying these gene–nutrient interactions remain unclear, and functional studies are needed to ascertain biological significance. Previous studies have shown that the genetic association between APOA1 rs670 and MetS risk was modulated by dietary fat intake and composition. These studies have also reported that A allele carriers of APOA1 rs670 were more responsive and susceptible to dietary fat change than the GG homozygote( Reference Lopez-Miranda, Ordovas and Espino 31 , Reference Mata, Lopez-Miranda and Pocovi 32 ). Studies have reported vague results regarding the effects of these polymorphisms on MetS risk in the context of different dietary patterns. The diplotypic combined effect of genotypes exacerbated the interaction with the WDP in relation to MetS risk; however, when A and T alleles were taken into account, the genotype combination GA+AA/CT+TT exhibited higher MetS risk with a higher WDP score. The deleterious effects conferred by the diplotype combination of the APOA1 polymorphism were aggregated among individuals with higher scores of the WDP and GA+AA/CT+TT/CC genotype combination of APOA1 rs670/rs5069/APOC3 rs5128, suggesting that these individuals were more susceptible to the effects of the WDP than others.
Intakes of the FSDP, which were characterised by a high consumption of tea and coffee, sugar and sweets, red meat, high-fat dairy products, and solid oils, showed a significant interaction with APOA1 rs670, rs5069 and their diplotype combination, in relation to MetS risk. The OR for MetS risk was decreased in A and T allele carriers with an increase in FSDP scores; however, when sexes were analysed separately, differences in MetS risk became more obvious in women than in men. Previous studies focusing on the modulation of a specific dietary fat in relation to the association between polymorphisms and MetS risk or blood lipids found that distinguishing these relationships is difficult because of collinearity of different kinds of fat intakes. Dietary pattern analysis examines the multiple dimensions of foods simultaneously relative to a given outcome( Reference Reedy, Wirfalt and Flood 33 ). In the present study, individuals with the highest FSDP score had higher intakes of SFA and MUFA, lower PUFA:SFA ratio, and lower intakes of carbohydrate and energy; these combinations reduced the risk of the MetS in subjects carrying the A and T alleles. Previously, the Framingham offspring study showed a significant interaction between dietary PUFA intake and the rs670 polymorphism in relation to plasma HDL-C concentration. In women carrying the A allele, a higher PUFA intake (>8 % of energy) was associated with a higher concentration of HDL-C; however, a moderate consumption of PUFA, common in most populations, revealed no phenotype–genotype association( Reference Ordovas, Corella and Cupples 7 ). In another study, the total fat intake (>35 % of energy) or high MUFA intake (>14 % of energy) accentuated the risk conferred by the GG genotype, whereas dietary PUFA and SFA did not modulate the risk of the MetS( Reference Phillips, Goumidi and Bertrais 9 ). Based on the present results, it seems that A and T allele carriers of the APOA1 polymorphism may benefit from the protective effect of the intake of dietary fat composition that is approximately in the range of recommended dietary guidelines( 34 ) (e.g. SFA, 10–11 % of energy (4 % from vegetable SFA); MUFA, 10–11 % of energy intake; cholesterol < 300 g/d), although intakes of sweets and sugar increased in the higher quartiles of FSDP scores, but intake of carbohydrate was in the range of 57–60 % and energy intake did not increase in the higher quartiles of FSDP scores.
The mechanism underlying the associations between these genetic variants and the MetS is unknown; however, this dietary pattern could interact differently with the transcriptional apparatus of the APOA1 gene, increasing more transcription in the presence of A and T allele carriers( Reference Gomez, Perez-Martinez and Marin 35 ). Sex differences observed in dietary pattern interactions and the MetS might be related to hormonal effects. Thyroid hormones, glucocorticoids and oestradiol enhance the activity of the APOA1 gene, whereas androgens decrease it. The mechanisms that mediate the effects of the hormones include the direct effects of the ligand and the nuclear receptor complex on gene activity. However, indirect means involving the participation of transcription factors other than the hormone receptors are also possible. The regulation of the APOA1 gene depends not only on the presence of oestrogen receptor-α and 17β-oestradiol, but also on the intracellular balance of oestrogen receptor-α and co-activators used by oestrogen receptor-α and the APOA1 enhancer. The mutation G-A rs670 polymorphism might be in the promoter or enhancer region of the APOA1 gene( Reference Ordovas, Corella and Cupples 7 , Reference Hargrove, Junco and Wong 36 , Reference Lamon-Fava, Ordovas and Schaefer 37 ).
The strengths of the present study include a longitudinal design, large number of cases and matched controls from all demographic strata, and the use of a dietary pattern analysis that better detects the association of the overall diet composition and genetic predisposition with the risk of the MetS. The results of the present study also emphasises the importance of taking into account the gene–diet interaction effect in association studies. Assessing dietary intakes at just one time point is one of the limitations of the present study; however, assessment performed in the present study showed dietary patterns 1 year preceding the development of the MetS. Excluding individuals who had any dietary change due to the presence of MetS components reduces the possibility of any change in dietary behaviour in recent years. Although factor analysis was used to define dietary patterns, it was somewhat subjective; however, our previous study showed reproducibility, validity and stability of the WDP in a subsample of a Tehranian population( Reference Asghari, Rezazadeh and Hosseini-Esfahani 38 ). Insulin sensitivity was not measured; therefore, we did not detect any interactions between dietary patterns and genotypes in relation to it, as a sensitive marker of the MetS. Replication studies carried out in a variety of populations are needed to indicate that this association is not limited to specific populations.
In conclusion, our findings suggest that dietary patterns modulate the effect of APOA1 and APOC3 SNP in relation to the risk of the MetS, with A and T allele carriers of APOA1 (rs670, rs5069) and C allele carriers of APOC3 (rs5128) further increasing the risk of the MetS when individuals adhered to the WDP. Also, A and T alleles of APOA1 appear to be protective against the risk of the MetS in participants with higher scores of the FSDP, which supports current dietary guidelines.
Acknowledgements
The authors acknowledge Ms Nilufar Shiva for critical editing of English grammar and syntax of this manuscript. The present study was conducted as a PhD thesis (Grant No. 407) and supported by the Research Institute for Endocrine Sciences, SBMU, Tehran, Iran.
The authors' contributions are as follows: F. H.-E., M. S. D., M. S., Y. M. and M. H. designed the study, collected and analysed the data, and wrote the manuscript; F. A. and P. M. supervised the research and critically revised the manuscript for important intellectual content.
None of the authors has any conflict of interest to declare.


