


It is well known that obesity is a global public health problem, its prevalence is rising as much as the mortality from CVD, atherosclerosis, type 2 diabetes and some cancer(Reference Bhaskaran, Silva and Leon1). Apart from the genetic contribution, changes in lifestyle, including physical inactivity and nutritional inadequacy, play important roles in obesity development(Reference Swinburn, Sacks and Hall2). Therefore, metabolic and immune derangements occur because overnutritional, energy-dense diets interactively affect the whole-body homoeostasis at cellular and systemic levels(Reference Karalis, Giannogonas and Kodela3).
Among the co-morbidities affecting obese subjects, Fe status disruptions, namely, Fe deficiency, have often been described in overweight or obese children, adolescents and adults(Reference Moschonis, Chrousos and Lionis4–Reference Yanoff, Menzie and Denkinger6). These changes are attributed to dietary Fe inadequacy or increased hepatic production of hepcidin in response to obesity-related low-grade inflammation, which results in impaired intestinal Fe absorption, decreased transferrin-bound Fe and increased Fe in the storage compartments(Reference Zimmermann, Zeder and Muthayya5,Reference Yanoff, Menzie and Denkinger6) . Moreover, in metabolic syndrome cases, when the metabolic status is complicated due to insulin resistance, hypertension and/or dyslipidaemia, liver siderosis and whole-body Fe accumulation have been described as dysmetabolic Fe overload syndrome (DIOS)(Reference Jézéquel, Lainé and Laviolle7,Reference Fernández-Real and Manco8) .
Biokinetic models are useful tools for the identification and validation of biomarkers and body inter-compartmental connections(Reference Charkes9). There is extensive literature about Fe kinetics in normal and disease states(Reference Charkes9–11). However, to our knowledge, a biokinetic model has not yet been used to investigate the influence of high-fat (HF) diets, which is a common experimental model used to evaluate diet-induced obesity(Reference Hariri and Thibault12,Reference Speakman, Hambly and Mitchell13) , on compartmental Fe distribution in rodents. Therefore, the aim of the present study was to evaluate the Fe distribution in its storage compartments by using a biokinetic model in growing Wistar rats fed HF diet.
Significant association of body fat with the Fe pools in different tissues and an observed hepatic Fe accumulation paralleled an inferred increase in the Fe transfer rate from bone marrow to the liver in HF diet-fed animals. According to the biokinetic model, if this feeding condition was to be prolonged, impaired body Fe decompartmentalisation may occur, with features resembling DIOS.
Methods
The experimental protocol was approved by the Commission on Ethics in Animal Experiments of the Faculty of Pharmaceutical Sciences at the University of São Paulo (FCF/USP) (CEEA 250/2009 FCF/USP), according to the guidelines of the Brazilian College on Animal Experimentation.
Animals and experimental diets
Weanling male Wistar rats (Rattus novergicus, var. albinus; n 72) were obtained from a colony at the FCF/USP. Euthanasia was performed under anaesthesia, and all efforts were made to minimise suffering. The rats were maintained in stainless steel wire-mesh cages (acclimatisation period) under a controlled temperature (22 (sd 2)°C) and relative humidity (55 (sd 10) %), with a 12 h dark–12 h light cycle (lights on 23.00–11.00 hours). During the 3 d of mineral balance, the rats were transferred to metabolism cages (no. 3M12D900; Instrulab) for total stool sampling.
Semipurified and pelleted AIN-93G-based diets(Reference Reeves and Nielsen14) were purchased from Harlan Teklad Laboratories. The control (CT) diet (TD.110294) was prepared with 7 % lipids (soyabean oil; 13 % energy from fat), and the HF diet (TD.110297) was prepared with 32 % lipids (a mix of soyabean and lard; 52 % energy from fat). The additional amount of lipids present in the HF diet was subtracted from that of starch. The diets were formulated in order to provide a 35-mg Fe/kg diet in the form of ferrous sulphate (FeSO4) (online Supplementary Table S1). The energy values of the diets were 18 and 23 kJ/g (4 and 5·5 kcal/g) in the CT and HF diets, respectively.
Experimental design
During the 5 d of the acclimatisation period, all animals were fed the same CT diet, and thereafter, either the CT or the HF diet for 2, 4 or 8 weeks (week 2, week 4 and week 8, respectively; n 10 for HF and n 7 for CT, in each time period). Food intake was determined daily, and body weight was recorded every 2 d. Food and demineralised water were offered ad libitum to the CT and HF diet-fed animals. However, since rats receiving an HF diet tend to reduce diet consumption(Reference Hariri and Thibault12), we included another group that was offered the CT diet but with an equivalent amount of Fe as that consumed by the HF group (pair-feeding (PF) group; n 7/time period), considering the analytical Fe values in the diets. Faeces were quantitatively measured during the last 3 d of week 8. Dry pooled stools (105°C, 15 h) were further milled, and the powdered samples were used for mineral and lipid analyses.
At the end of each period, the rats were weighed and anaesthetised through an intraperitoneal route with a 1:2 (v/v) mixture of ketamine (10 mg/kg body weight; Fort Dodge) and xylazine (25 mg/kg body weight; Bayer). The animals were then euthanised by exsanguination, and the liver, spleen, epididymal and retroperitoneal fat pads, and caecum with its contents were then removed and weighed. The adiposity index was calculated as 100 times the quotient of the sum of the epididymal and retroperitoneal fat pads (g) by the final body weight of the animal (g). Epididymal adipose tissue and liver fragments were fixed in neutral-buffered 10 % formalin for 24 h and used for histopathological analyses. The duodenal mucosa was scraped off with a glass slide before being snap-frozen in liquid N2 and stored at −80°C until analysis. Total lipid (in the liver by diethyl ether extraction) and mineral (liver and spleen) analyses were performed in samples previously stored at −20°C. Tissue samples were snap-frozen in liquid N2 for protein or RNA extraction. Whole-blood samples were collected from the inferior vena cava with EDTA (1 mg/ml; Sigma Chemical Co.) for total blood cell counts and Hb and haematocrit analyses, which were performed using an automated haematology analyser (ABX Micros ABC Vet equipment, Horiba). Reticulocyte counts were carried out according to Brecher’s method(Reference Brecher15). Blood samples without an anticoagulant were collected in demineralised tubes for the analysis of Fe concentrations by spectrometry (Labtest Diagnostic S/A), according to the manufacturer’s instructions. Hb concentrations and body weight results were used to determine the erythrocyte Fe pool with the following formula, assuming that the total blood volume was 6·7 % of the body weight and the Fe content in Hb was 0·335 %(Reference Mahoney, Van Orden and Hendricks16):
 $${\rm{Erythrocyte}}\;{\rm{Fe}}\;{\rm{pool}}\;\left( {{\rm{mg}}} \right){\mkern 1mu} = {\mkern 1mu} {\rm{ }}{{{\rm{(body}}\;{\rm{weight}}\;\left( {\rm{g}} \right) \times {\rm{Hb}}\;\left( {{\rm{g/l}}} \right) \times 6\cdot7 \times 0\cdot335)} \over {10000}}$$
Chemical composition of experimental diets
The following components of the diets were determined: moisture and ash by the drying method, total lipids by the diethyl ether extraction method(17) and protein by the micro-Kjeldahl method(18) (conversion factor of 6·25). After wet digestion (HNO3:H2O2, 5:1, v/v), samples were analysed for Fe concentrations by atomic absorption spectrophotometry (AAnalyst 100; Perkin Elmer) by using a hollow cathode lamp with a 283·4 and 0·2 nm slit. Working standard solutions were prepared with FeCl3 (Titrisol; Merck). Flasks and glassware were demineralised prior to all mineral analyses. There were no significant differences in the Fe concentration of CT and HF diets (49 mg Fe/kg in the CT diet). A certified reference material (lyophilised bovine liver, SRM1577c; National Institute of Standards & Technology) was used to check the Fe recovery (Fe value = mean 188 (sd 14) µg/g, n 6) (certified value 197 (sd 6) µg Fe/g).
Body composition assessment
At the end of week 8, whole-body dual-energy X-ray absorptiometry (DXA) measurements were carried-out using a Hologic QDR-4500 densitometer (Discovery-A SN; Hologic) in the high-resolution mode and analysed by the Small Animal Body Composition software (Hologic QDR Software for Windows XP, version 12.3) supplied by the equipment manufacturer. The body scans were performed in anaesthetised animals. The data gathered were fat mass (g), lean mass (g), bone mineral content (BMC) (g/hydroxyapatite) and bone mineral density (BMD) (g/cm2).
Intraperitoneal insulin tolerance test
An intraperitoneal insulin tolerance test (ipITT) was performed in 6-h fasted animals at weeks 4 and 8. Rats were injected with a human recombinant insulin solution (1·5 U/kg) (Humulin R; Eli Lilly) without anaesthesia, and blood samples for glucose determination were collected at 0 (basal), 5, 10, 15, 20, 25 and 30 min after the start of the test from the tail vein performed with a portable glucosimeter (Accu-Chek Performa; Roche Diagnostics). The glucose response during ipITT was computed from the AUC using the trapezoidal method(Reference Lundbaek19).
Tissue and stool iron contents
Total Fe measured in the liver left lateral lobe, spleen and stools was determined as described previously for the mineral analyses of the diets. Mineral analyses in the tissues were not corrected for mineral content in the residual blood. Caecal contents were submitted to a sequential extraction procedure for the analysis of intestinal Fe species distribution, based on the use of extractants with increasing ionic strengths, as previously described(Reference Simpson, Sidhar and Peters20). The analytical precision for each extraction step was evaluated by subjecting ten sub-samples of a caecal content pool to the sequential procedure, as described elsewhere(Reference Lobo, Gaievski and De Carli21). CV of 10·5 % or lower were obtained. A comparison of the sum of Fe concentrations in each fraction was consistent with the total Fe concentration (r 2 0·98; Fe value = mean 13·76 (sd 1·13) v. 13·95 (sd 1·14) µmol/g, respectively).
ELISA
Analyses were performed according to the manufacturer’s instructions for serum insulin (Rat/Mouse Insulin ELISA; Merck Millipore) and leptin (Mouse/Rat Leptin Quantikine; R&D Systems Inc.) concentrations.
Histological analyses of adipose tissue and liver
Epididymal adipose and liver fragments were processed according to the standard techniques for microscopic analysis(Reference Behmer, Tolosa and Freitas Neto22) and embedded in paraffin and then cut into 5 µm sections for adipose and liver analyses and 15 µm sections for counting the number of adipocytes, as described elsewhere(Reference Parlee, Lentz and Mori23). The sections were stained with haematoxylin and eosin for adipose tissue and the liver, and with Perls’ Prussian blue for haemosiderin in the liver, following the standard techniques(Reference Behmer, Tolosa and Freitas Neto22). The sections were studied under light microscopy at 40, 100 and 400× using an optical microscope (Primo Star; Zeiss) coupled to a digital camera (PowerShot G10; Canon), and the software zoomBrowser (EX 6.2 version) was used for capturing images. The histopathological parameters considered were as follows: (1) Adipose tissue: presence and intensity of inflammation (steatitis) as well as the predominant cell types involved, morphology of adipocytes, presence and intensity of circulatory disorders. (2) Liver: reversible hepatocellular injury (cellular swelling, macro- and microvesicular steatosis), hepatocellular death, vascular lesions, inflammatory injury and cell types involved and liver siderosis (haemosiderin).
The volume (size) of adipocytes was determined using the software ImageJ (for Windows) based on the area calculated from the major axis measurements in the perimeter delineation. The number of adipocytes was counted in up to twenty fields at high power (400×). Analyses of adipose sections were based on the methods described by Bourgeois et al.(Reference Bourgeois, Alexiu and Lemonnter24), Cinti et al.(Reference Cinti, Mitchell and Barbatelli25) and Strissel et al.(Reference Strissel, Stancheva and Miyoshi26). Liver injury and hepatocellular siderosis were semi-quantitatively scored on a scale from 0 to 3 where 0 = absence in <5 %; 1 = presence in 5–33 %; 2 = >33–66 % and 3 = >66 % of liver parenchyma, as described by Ishak et al.(Reference Ishak, Baptista and Bianchi27) and Klener et al.(Reference Kleiner, Brunt and Van Natta28).
Immunoblotting
Liver, spleen and duodenal mucosa samples were homogenised (Potter-Elvehjem) in Tissue Protein Extraction Reagent (Pierce Technology) containing protease and phosphatase inhibitors (Pierce Technology). Equal amounts of total protein (50 µg) were then separated by 12·5 % SDS-PAGE (Fisher Scientific) and transferred onto nitrocellulose membranes (Whatman). The blots were incubated with 1:500 (v/v) diluted rabbit polyclonal anti-ferroportin (Fpn)-1 (Abcam Antibodies) followed by 1:50 000 (v/v) diluted peroxidase-labelled anti-rabbit secondary antibodies (Sigma Chemical Co.). Signals of immunoreactive bands were visualised by an enhanced chemiluminescence kit (GE HealthCare). Image Quant 400 equipment (GE Healthcare) and the Quantity One Basic software (BioRad Laboratories) were used for scanning the photo images and for the densitometry analysis, respectively. Each membrane was reprobed with 1:50 000 (v/v) diluted peroxidase-labelled anti-β actin monoclonal antibody (Sigma Chemical Co.). The data for Fpn-1 protein content were normalised with corresponding β-actin values and expressed as arbitrary units.
Extraction of total RNA and quantitative real-time PCR analyses
Liver RNA was extracted using the Qiagen RNeasy Mini kit (Qiagen). For complementary DNA (cDNA) synthesis, 0·5 μg of total RNA was reversely transcribed using a high-capacity cDNA reverse transcription kit (Applied Biosystems). Quantitative real-time PCR analyses were carried out in a StepOne Real-Time PCR System using the following validated TaqMan Gene Expression Assays (Applied Biosystems): Rn00584987_m1 for the hepcidin antimicrobial peptide (Hamp) gene (RefSeq: NM_053469.1) (amplicon length = 95 bp); Rn00820640_g1 for the ferritin, heavy polypeptide 1 (Fth1) gene (RefSeq: NM_012848.1) (amplicon length = 95 bp); Rn00591187_a1 for the solute carrier family 39 (iron-regulated transporter), member 1 (Slc40a1) gene (RefSeq: NM_133315.2) (amplicon length = 84 bp); Rn01474695_a1 for the transferring receptor (Tfrc) gene (RefSeq: NM_022712.1) (amplicon length = 113 bp); Rn99999916_s1 for the internal normalisation gene glyceraldehyde 3 phosphate dehydrogenase 1 (Gapdh) (RefSeq: NM_017008.3) (amplicon length = 87 bp). All quantitative PCRs, in final volumes of 20 µl, were run in triplicate. Relative quantification was performed after determining the comparative threshold values for reference (Gapdh) and target genes (Hamp, Fth1, Slc40a1, Tfrc) in each sample set according to the 2−ΔΔCt method (ΔΔCT, delta–delta comparative threshold)(Reference Livak and Schmittgen29).
Biokinetic model
Body Fe distribution was evaluated by a compartmental analysis(Reference Robertson, Price and Budinger10). The model is shown in Fig. 1. For each compartment (Ci), the Fe content variation is described by the first-order differential function(Reference Berman, Grundy and Howard30):
 $${{{d{C_i}}}\over{{{dt}}}} = \sum\limits_{j\, = \,1,\,j\,\ne \;i}^N {{k_{j,i}}} {C_j} - \sum\limits_{i\; = \;1,i\; \ne \;j}^N {{k_{i,j}}} {C_i}$$
where  $${{d{C_i}} \over {dt}}$$ is the infinitesimal variation over time of the ith Fe compartment (tissue), N is the total number of compartments (N 14), C j are compartments in the system connected to C i and k j,i is the rate constant, which represents the fractional rate of Fe content in compartment C j and is transferred to compartment C i per unit of time (days). Kinetic parameters k i,j and k j,i (day−1) were calculated using the AnaComp software(Reference Mesquita31), which is a computational code for the analysis of kinetic data that allows for the interpretation of the experimental results in a quantitative and kinetic way(11), or inferred by extrapolation using the allometric theory(Reference Boxenbaum and Ronfeld32). According to the allometric theory, it is possible to identify a physiological parameter of an animal from another animal species by a simple formula:
 $${k_{i,\,j}} = a \times {M^b}$$
where M is body mass (g), a is the slope of the allometric relationship and b is the allometric exponent. The allometric parameters a and b were determined by linear regression expressed as Log(k) = b·Log(M) + b, where k was obtained from the data described in Table 1 of the ICRP 69(11), and M was assumed to be 6 kg for children aged 3 months, 10 kg for children aged 1 year, 19 kg for children aged 5 years, 32 kg for children aged 10 years, 56 kg for children aged 15 years and 73 kg for adults(33). For modelling, the blood content of the liver and spleen was assumed to be 10 and 1·5 % of their total volumes, respectively(33).
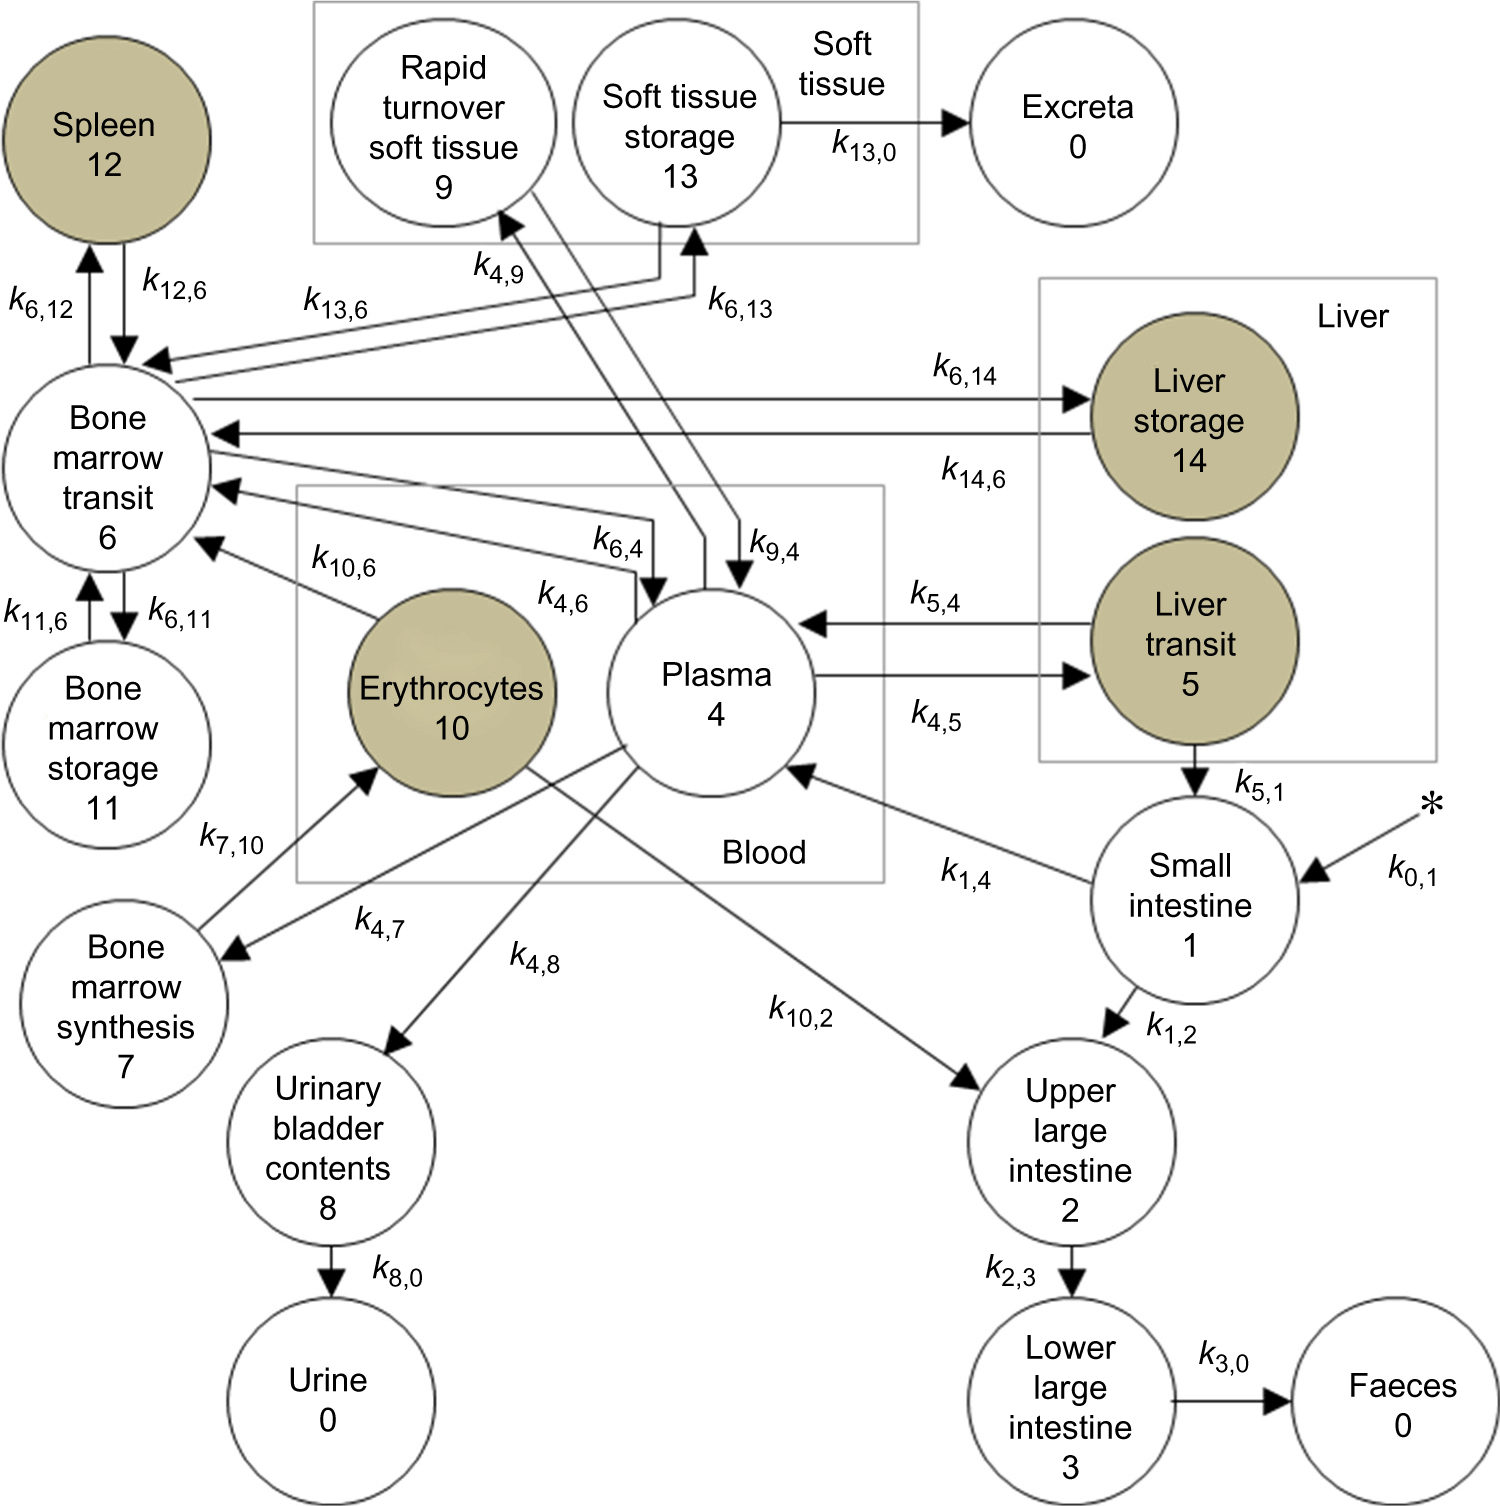
Fig. 1. Biokinetic model for iron. This model was adapted from the International Commission on Radiological Protection (ICRP) 69(Reference Ishak, Baptista and Bianchi27) and includes fourteen compartments and twenty-seven transfer constants (k j,i from tissue ‘i’ to tissue ‘j’).
Table 1. Ingestion, blood (serum and erythrocyte pool) and tissue (liver and spleen) iron levels of growing rats fed control (ad libitum and pair-fed; CT and PF) or high-fat (HF) diets for 2, 4 and 8 weeks (weeks 2, 4 and 8, respectively) (n 7 for CT and PF groups, n 10 for HF group) (Median values and interquartile ranges (25th–75th percentiles))

a,bMedian values within the same row with unlike letters were significantly different according to Kruskal–Wallis or one-way ANOVA tests followed by Dunn’s or Tukey post hoc tests. Differences are considered significantly different at P < 0·05.
Statistical analysis
The results are presented as medians and interquartile ranges (25th–75th percentiles) or as means and standard deviations. The statistical analysis was performed using GraphPad Prism version 5.00 (GraphPad Software Inc.). The tests were performed assuming bilateral hypotheses and a 5 % significance level. Normality and homoscedasticity of the data were assessed using the Shapiro-Wilk and Bartlett tests, respectively. When the hypotheses of normality and homogeneity of variances were accepted, an unpaired t test or one-way ANOVA followed by Tukey’s post hoc test was used to detect significant differences among the groups. Otherwise, a non-parametric Mann–Whitney U test or Kruskal–Wallis followed by Dunn’s post hoc test was used. The observed power was 85–95 % for most tests. Regression analyses were used to compare predicted and experimental (analysed) Fe pool size (mg) data in erythrocytes, the liver and the spleen. Some parameters were evaluated by Pearson’s or Spearman’s correlation tests, depending on whether the hypothesis of normality for both variables under analysis was accepted.
Results and discussion
Obesity results in Fe dyshomeostasis according to human and animal studies(Reference Moschonis, Chrousos and Lionis4,Reference Zimmermann, Zeder and Muthayya5,Reference Bertinato, Aroche and Plouffe34,Reference Sonnweber, Ressa and Nairz35) . Among the factors that likely affect Fe status in obesity are dietary inadequacy, an increased requirement due to a larger body mass and a recognised fat overload-related systemic inflammation(Reference Yanoff, Menzie and Denkinger6,Reference Bertinato, Aroche and Plouffe34) . Here increased body fat due to the consumption of an HF diet over 8 weeks was significantly associated with tissue Fe redistribution in rats. Henceforward, the results will be presented and discussed in three topics: (1) a brief presentation of the rat model used in the study, (2) intestinal Fe excretion and body fat v. tissue Fe status correlations and (3) biokinetic analysis of the body Fe compartmental distribution.
Energy intake, body weight gain, adiposity, blood insulin and leptin levels and insulin sensitivity
Rats with an HF diet had a higher energy intake compared with CT, with more significant contrasting differences after 4 weeks of the experiment (Fig. 2(a)). In turn, the highest energy consumption was reflected in a greater body weight gain after only 8 weeks of HF diet consumption (P < 0·01; Fig. 2(b)), considering that the weight of the animals in the CT and PF groups did not significantly differ at this time period (data not shown). Similarly, in vivo DXA measurements indicated higher whole-body fat acquisition in HF rats in comparison with ad libitum CT rats (P = 0·04; a 23 % difference in body fat between week 4 and week 8; Fig. 2(c) and (d)), whereas lean mass, whole-body BMD and BMC did not differ between the groups (data not shown). Accordingly, retroperitoneal and epididymal fat pad weights increased with the HF feeding (3·2 v. 5·5 g, P = 0·03; 5·7 v. 3·6 g, P = 0·04, respectively) and correlated with the total body fat at this time period (body fat v. adiposity index, r 2 0·83, P < 0·0001). Interestingly, a morphological assessment of epididymal adipose tissue sections did not suggest significant changes in adipocyte size or counts between ad libitum CT and HF animals after 8 weeks (Fig. 2(e)–(g)). In semi-quantitative examinations of HF adipose tissue sections, 50 % of the cases (5/10) showed discrete foci of steatite with a predominance of macrophages, while 30 % (3/10) showed foci of multivacuolised adipocytes. As expected, the HF diet resulted in a higher liver fat content (P = 0·03; Fig. 2(i)), which was corroborated by the histopathological analyses that revealed mild microvesicular steatosis characterised by diffuse vacuolar degeneration in 9/10 cases (P = 0·0001; Fig. 2(j)). No necroinflammatory processes or haemosiderin deposits were observed. Taken together, these data indicate that, in our experimental conditions, the consumption of an HF diet for 8 weeks resulted in moderately obese rats(Reference Hariri and Thibault12).

Fig. 2. Energy intake, body weight gain, adiposity, blood leptin and insulin levels and insulin sensitivity. High-fat diet-fed rats had a higher energy consumption; higher adiposity, leptin and insulin levels; and lower insulin sensitivity. Energy intake (a) and body weight gain (b); body fat at week 4 and week 8 measured as the adiposity index (calculated as 100 times the quotient of the sum of the epididymal and retroperitoneal fat pads (g) and the final body weight of the animal (g)) (c); dual-energy X-ray absorptiometry images showing body fat accumulation in HF v. CT rats at week 8 (d); histopathological analysis of epididymal adipose tissue (adipocyte size and number) at week 8 (e–g); liver weight (h), lipid content (i) and histological photomicrographs (j) showing the centrilobular vein of a CT animal, without histological alterations, and an HF animal with microvesicular steatosis; blood leptin (k) and insulin (l) levels and insulin sensitivity (m) at week 8. CT, control group (n 7); PF, pair-feeding group (n 7); HF, high-fat group (n 10). Values are means and standard deviations (a–c, e, f, h, i, m). The box plots (k, l) show medians and interquartile ranges. Data were analysed using an unpaired t test or Mann–Whitney U test and one-way ANOVA or Kruskal–Wallis test followed by Tukey’s or Dunn’s post hoc test. * Significant differences among the groups (P < 0·05). (a, b, m)  , CT;
, CT;  , PF;
, PF;  , HF. (c)
  , CT;
, CT;  , HF. † To convert glucose in mg/dl to mmol/l, multiply by 0·0555.
As expected, the increased adiposity observed in HF animals was accompanied by higher blood leptin (P = 0·04) and insulin (P = 0·04) levels (Fig. 2(k) and (l)) as well as peripheral and insulin resistance (P = 0·04; Fig. 2(m)), in comparison with ad libitum CT rats. It is well known that an increase in adipose mass resulting from an HF diet influences blood leptin levels(Reference Hariri and Thibault12,Reference MacDougald, Hwang and Fan36) . Leptin, a hormone produced in adipose tissue, regulates food intake and energy expenditure(Reference MacDougald, Hwang and Fan36). In our study, despite the slight but significant reduction in food intake by the HF group after 8 weeks of study (data not shown), which suggests a retention of some central sensitivity to the action of leptin on food intake, the higher acquired adipose mass probably occurred due to a greater feeding efficiency(Reference Lin, Thomas and Storlien37). In addition, increased blood insulin levels and decreased insulin sensitivity are well-documented in experimental models of obesity induced by an HF diet and appear to be directly related to the amount and type of fat in the diet(Reference Hariri and Thibault12,Reference Speakman, Hambly and Mitchell13) . Potential mechanisms include decreased insulin receptor levels, impaired glucose transport and metabolism, decreased glycogen synthase activity in the liver and muscle and decreased cellular responsiveness to insulin by the actions of inflammatory cytokines and growth factors(Reference Hariri and Thibault12,Reference Riccardi, Giacco and Rivellese38) .
Intestinal iron excretion and body fat v. tissue iron status correlations
Ad libitum CT animals had a higher Fe consumption than those in the PF and HF groups over the 8-week experiment (Table 1). Although blood Fe (both serum and erythrocyte compartments) was similar among the groups in the first two experimental periods (weeks 2 and 4), the consumption of an HF diet induced a redistribution of Fe through its blood compartments at week 8. At this time, serum Fe was reduced (P = 0·002), while the erythrocyte Fe pool was increased in HF rats compared with both CT groups (P < 0·0001). Nevertheless, these findings occurred without significant changes in haematological indices at any of the studied periods (online Supplementary Table S1).
To assess the relationship between body adiposity and tissue Fe distribution, correlation analyses were performed among adiposity indices and some compartmental Fe pools (Fig. 3). Although these tests did not reveal significant findings in the two first studied periods (Fig. 3(a) and (b)), a moderate and negative correlation was found between serum Fe and body fat values at week 8 (r −0·54, P = 0·01; Fig. 3(c)). In contrast, positive and increasingly significant correlations between adiposity and erythrocyte Fe pool values were observed over the studied periods (r 0·45, P = 0·04 at week 2; r 0·61, P = 0·002 at week 4 and r 0·79, P < 0·0001 at week 8; Fig. 3(d)–(f)).

Fig. 3. Body iron and fat correlations. Correlations of body adiposity (measured as the adiposity index) and serum iron concentrations (a–c), erythrocyte iron (d–f), liver iron (g–i) and spleen iron (j–l) pools at weeks 2, 4 and 8. Pearson’s test was used, and the statistical significance was set at P < 0·05.  , Control group (n 7);
  , pair-feeding group (n 7);
  , high-fat group (n 10). * To convert iron in μg/dl to μmol/l, multiply by 0·179.
Blood volume is related to body weight, in rodents(Reference Whittaker, Mahoney and Hendricks39) and humans(Reference Cepeda-Lopez, Zimmermann and Wussler40). In addition, increased body size and fat content have been associated with changes in Fe metabolism indices (such as Hb, haematocrit and total Fe binding capacity)(Reference Micozzi, Albanes and Stevens41). Therefore, heavier and fatter animals would have a higher blood volume and higher erythrocyte Fe pool values, considering that the main body Fe compartment is represented by Fe associated with Hb in erythrocytes(11,Reference Bertinato, Aroche and Plouffe34) . Moreover, some authors suggest that hypoferremia (low serum Fe) in HF diet-fed rodents results from mechanisms both dependent and independent of the Fe-regulatory hormonal hepcidin action on the cellular Fe exporter Fpn1(Reference Sonnweber, Ressa and Nairz35,Reference Sonnweber, Ressa and Nairz35) . Hepcidin controls cellular Fe efflux by binding to Fpn1, inducing its endocytosis and degradation(Reference Zimmermann, Zeder and Muthayya5,Reference Yanoff, Menzie and Denkinger6,Reference Cole, Shen and Eisenstein43) . In our study, no differences were observed in the liver expression of hepcidin-encoding mRNA (Hamp) (CT v. HF group; Fig. 4(a)), though a slightly higher Hamp mRNA level was found in the HF group compared with the CT group after correction of the tissue Fe pool values (P = 0·06; data not shown).

Fig. 4. Quantitative real-time PCR analyses of iron metabolism genes (Hamp (a), Tfrc (b), Fth1 (c) and Slc40a1 (d)) in the liver of rats fed an ad libitum control diet (CT, n 6) or high-fat diet (HF, n 6) for 8 weeks. Box plots express medians and interquartile ranges. Data were analysed using an unpaired t test or Mann–Whitney U test. * Significant differences between the groups (P < 0·05).
Hepatic Fe did not differ between the CT and PF groups in any studied period (Table 1). However, the HF diet increased liver Fe at week 4 (P = 0·02; Table 1), with a more pronounced effect at week 8 (P = 0·01; Table 1). Body fat correlated moderately and positively with the liver Fe pool at week 4 (r 0·47, P = 0·02; Fig. 3(h)) and was more pronounced at week 8 (r 0·56, P = 0·008; Fig. 3(i)). Moreover, while the liver expression of transferrin receptor (Tfrc) was not altered (Fig. 4(b)), ferritin heavy-chain 1 (FTh1)-encoding mRNA expression was higher in HF animals compared with CT animals at week 8 (P = 0·03; Fig. 4(c)). Conversely, while liver Fpn (Slc40a1) expression was significantly increased in fatter animals (P = 0·03; Fig. 4(d)), hepatic Fpn1 protein levels remained unchanged (online Supplementary Fig. S1(a)). In this sense, it is worth mentioning that, apart from the control exerted by hepcidin on systemic Fe homeostasis, cells have internal regulating pathways for the expression of Fe metabolism genes. Therefore, at the posttranscriptional level, the Fe regulatory protein (IRP)/Fe responsive element (IRE) system affects mRNA stability and translation from a variety of Fe-related genes(Reference Cole, Shen and Eisenstein43). For example, with a cellular Fe excess, IRP do not bind to IREs, thus increasing the synthesis of ferritin and Fpn(Reference Cole, Shen and Eisenstein43). Notwithstanding, although the synthesis of Fpn1 was expected to be increased, liver Fe excess in HF diet fed animals was not reflected by higher protein levels. In turn, both the mean Fe concentrations in the spleen throughout the study (Table 1) and the spleen Fpn1 protein levels at week 8 (online Supplementary Fig. S1 (b)) were not different among the groups. In addition, the Fpn1 protein levels were also not different between the groups when measured in the duodenal mucosa (online Supplementary Fig. S1(c)).
Considering that fatty diets affect some digestive functions(Reference Park, Kwon and Ahn44) and may therefore influence the absorbability of Fe into the lumen of the small intestine(Reference Johnson, Lukaski and Bowman45), we indirectly evaluated Fe absorption by measuring the Fe species distribution in the caecal contents and faecal excretion after 8 weeks of the experiment (Fig. 5). Although HF animals showed lower Fe concentrations in their caecal contents (P = 0·003; Fig. 5(a)), inter-group differences were also observed in the total faeces (P < 0·0001;Fig. 5(b)) and fat output (P = 0·0004; Fig. 5(c)), so that their absolute faecal Fe excretion was lower than that of ad libitum CT animals (P < 0·0001) but similar to that of PF rats (Fig. 5(d)). Nevertheless, luminal Fe speciation, expressed as a percentage of total Fe in the caecum, indicated a slight increase in exchangeable Fe (P = 0·07; Fig. 5(e)) and a significant decrease in the residual Fe fraction (P = 0·03; Fig. 5(f)) in HF animals, suggesting a possible higher dietary Fe accessibility associated with this feeding condition.

Fig. 5. Changes in iron species distribution in the caecal contents, and faecal excretion of lipids and iron. Total iron in the caecal contents (a), faecal output (b), faecal excretion of lipids (c) and iron (d), and exchangeable (e) and residual (f) iron fractions in the caecal contents of rats fed an ad libitum control diet (CT, n 7), pair-feeding control diet (PF, n 7) or high-fat diet (HF, n 10) for 8 weeks. Values are means and standard deviations. Data were analysed using a one-way ANOVA or Kruskal–Wallis test followed by Tukey’s or Dunn’s post hoc test. * Significant differences among the groups (P < 0·05). , CT;  , PF; , HF.
In rodent models, the effects of an HF diet on Fe status seem to be fundamentally influenced by the (1) rodent model, (2) experiment duration and (3) type and amount of fat used in diets(Reference Bertinato, Aroche and Plouffe34,Reference Sonnweber, Ressa and Nairz35,Reference Gotardo, Santos and Miyashiro42,Reference Orr, Kennedy and Anderson-Baucum46–Reference Buettner, Parhofer and Woenckhaus55) . Thus, some diet-induced obese rodents show a greater responsiveness to dietary fat overload, with a consequent increase in their body weight and fatness(Reference Hariri and Thibault12,Reference Speakman, Hambly and Mitchell13) . In these animals (e.g. C57BL/6 mouse(Reference Surwit, Kuhn and Cochrane56)), the development of chronic and low-grade inflammation occurs in parallel with increased adiposity and greatly affects homoeostasis at the cellular and systemic levels, creating an environment of metabolic dysregulation associated with obesity(Reference Calder, Namanjeet and Fred57). From this perspective, the degree of inflammation produced by excess body fat may, to some extent, impact the production of hepcidin(Reference Zimmermann, Zeder and Muthayya5,Reference Yanoff, Menzie and Denkinger6,Reference Cole, Shen and Eisenstein43,Reference Huang, Constante and Layoun58) , decrease intestinal Fe absorption and favour Fe accumulation in its major storage sites (liver and spleen). In most of the studies using C57BL/6 mice that aimed to evaluate the impact of HF diets on Fe status, the experimental duration ranged from 16 to 30 weeks(Reference Sonnweber, Ressa and Nairz35,Reference Gotardo, Santos and Miyashiro42,Reference Orr, Kennedy and Anderson-Baucum46–Reference Citelli, Fonte-Faria and Nascimento-Silva49) . In these studies, however, excessive fat intake resulted in decreased Fe concentration and hepcidin mRNA expression in the liver. Given the possibility of different stimuli acting on the production of hepcidin(Reference Huang, Constante and Layoun58) (and, in turn, on the tissue Fe distribution), and despite inflammation being a potential stimulus for tissue Fe accumulation in these studies, the reduction in Fe availability for erythropoiesis certainly overcame the inflammatory drive on the hormone production. Conversely, studies using rats (mostly Sprague–Dawley rats) ranged from 5 to 12 weeks(Reference Citelli, Fonte-Faria and Nascimento-Silva49–Reference Dongiovanni, Lanti and Gatti52). Only one study with rats lasted for more than 12 weeks (16 weeks)(Reference Jiang, Yan and Sun53). Outbred Sprague–Dawley rats present heterogeneous responses to HF diets: some animals are more susceptible and others are more resistant to weight and body fat gain(Reference Speakman, Hambly and Mitchell13). Here we used Wistar rats that are considered more susceptible to the metabolic effects produced by the consumption of an HF diet(Reference Marques, Meireles and Norberto59). However, in our experimental conditions, we found a similar body weight and body fat profile as demonstrated in Sprague–Dawley rats by other studies(Reference Citelli, Fonte-Faria and Nascimento-Silva49–Reference Dongiovanni, Lanti and Gatti52).
There is no consensus about the effects of an HF diet on the Fe status in rats: while an accumulation of Fe and an increased production of hepcidin in the liver were found in some studies(Reference Meli, Raso and Irace50,Reference Meli, Raso and Irace50) , no effect(33) and decreased hepatic Fe or hepcidin production were reported by others(Reference Jiang, Yan and Sun53,Reference Le Guenno, Chanséaume and Ruivard54) . Furthermore, it seems that any relationships between these discrepant results would be related to the duration of the experiment. Thus, some points could be highlighted from our results regarding the body Fe status of HF diet-fed young animals: (1) hypoferremia was accompanied by higher adiposity, and we observed (2) higher Fe accessibility in the caecal lumen, (3) increased liver Fe deposition without hepatocellular siderosis and (4) unchanged hepatic hepcidin and transferrin receptor-encoding mRNA expressions as well as Fpn1 protein levels.
Biokinetic analysis of the body iron compartmental distribution
To further elucidate the effects of an HF diet consumption on tissue Fe distribution, experimental data obtained for Fe pools in the erythrocytes, liver and spleen at week 8 were fit to a biokinetic model (Fig. 1), based on a previously published ICRP report(11). The model represents the Fe pool in fourteen different compartments and provides twenty-seven kinetic parameters, which indicate the fractional transfer rate of Fe among its body compartments. Regression analyses for predicted and experimental data obtained from the liver, spleen and erythrocyte Fe pools revealed coefficients of determination (r 2) of 0·95, 0·97 and 0·99, respectively.
The entry of Fe from the diet into the rat body passes through the gut (small and large bowel), and the Fe excretion in faeces is kinetically represented by k 0,1, k 1,2, k 2,3 and k 3,0 (Fig. 1). Because ad libitum feeding resulted in different dietary Fe consumption between the CT and HF groups, the values for Fe intake from the PF group were used to feed the model, so that the fractional transfer coefficients could be appropriately compared. Moreover, liver, spleen and erythrocyte Fe pools did not differ between the CT and PF groups (Table 1). Thus, k 0,1, k 1,2, k 2,3 and k 3,0 were not influenced by dietary fat overload (Fig. 6(a)–(d)). However, the magnitude of Fe excretion via blood loss from erythrocytes and bile, represented by k 10,2 andk 5,1, respectively, was differently influenced by the HF diet consumption. While the HF diet slightly increased the amount of blood loss from erythrocytes (Fig. 6(f)), biliary Fe excretion was significantly increased (P = 0·001; Fig. 6(g)) compared with the CT group. As part of approximately two-thirds of the body’s Fe excretion that occurs apart from urine, sweat and skin, biliary Fe joins the mineral pool eliminated in faeces if it is not reabsorbed by the small intestine into the plasma(11). Although very small, biliary Fe excretion can be increased in situations that promote erythrocyte destruction(Reference Hawkins and Hahn60) or hepatic Fe overload(Reference LeSage, Kost and Barham61). The Fe transfer rate from the lumen of the small intestine to plasma (k 1,4) was similar between the groups (Fig. 6(h)), despite the changes observed in the intestinal Fe speciation of HF diet-fed animals (Fig. 5). Even so, it is worthy to note that we were unable to assess Fe accessibility in the content samples of all the intestinal sections, being confined only to the caecum, whereas the major recognised dietary Fe absorption site is the duodenum(11).

Fig. 6. Iron decompartmentalisation with high-fat diet feeding. Fractional transfer rate of iron between its body compartments (described in Fig. 1) in rats fed a pair-feeding control diet (PF, n 7) or high-fat diet (HF, n 10) for 8 weeks. Values are means and standard deviations. Data were analysed using an unpaired t test or Mann–Whitney U test. * Significant differences between the groups (P < 0·05).
In this model, blood is represented by compartments 4 and 10, that is, plasma (Fe bound to transferrin) and erythrocytes (Fe incorporated into Hb), respectively (Fig. 1). In our experimental conditions, Fe was cleared from plasma to the synthesis compartment of bone marrow (k 4,7) more rapidly in the HF group than in the CT group (P = 0·002; Fig. 6(i)). It would then be expected that Fe incorporated into Hb (k 7,10; Fig. 6(j)) would be higher in the HF group than in the CT group. Although no differences were observed in the blood Hb levels between the groups (online Supplementary Table S2), the HF animals presented higher erythrocyte Fe pool values (Table 1), probably due to the increased body weight, which requires a larger blood volume to support(Reference Bertinato, Aroche and Plouffe34), as already mentioned.
Plasma Fe is also exchanged with parenchymal tissues, the latter represented by liver transit (compartment 5)(11) (Fig. 1). While the dietary treatment did not affect the transfer rate of Fe from plasma to the liver (k 4,5; Fig. 6(k)), the HF diet increased the Fe output from the liver into the plasma (k 5,4) (P = 0·001; Fig. 6(l)). Considering that these predictions were accompanied by the observation of hypoferraemia among HF diet-fed animals, the hypothesis of a higher plasma Fe requirement for erythropoiesis in this condition could be reinforced. Nonetheless, the fraction of transferrin-bound Fe, which is taken by bone marrow without incorporation into erythrocytes and called the ‘wastage Fe of erythropoiesis’(11,Reference Beguin, Stray and Cazzola62) (k 4,6) as well as its exchange with plasma (k 6,4), were both decreased with the HF diet (P = 0·002; Fig. 6(m) and (n)).
Once erythrocytes have matured, these cells remain in circulation an average of 42–56 d in healthy rats(Reference Loeffler, Pantel and Wulff63). The Fe released from erythrocytes at the end of this life span is modelled by the transfer rate from erythrocytes (compartment 10) to the transit pool of bone marrow (compartment 6) (k 10,6) (Fig. 1). As a consequence of erythrophagocytosis, erythrocyte Fe is acquired by the reticuloendothelial system macrophages of the spleen, storage compartments of the liver and bone marrow and other reticuloendothelial cells (storage pool of ‘soft tissue’, compartment 13; i.e. Fe incorporated into myoglobin and additional Fe from that stored by the reticuloendothelial system not associated with the bone marrow, liver or spleen)(11). Slower transfer rates of Fe from the transit to storage compartments of bone marrow (k 6,11) and soft tissues (k 6,13) were observed as a result of the HF diet consumption (P = 0·001; Fig. 6(v) and (z)).
Despite the recognised ability to clear erythrocytes from the blood by spleen macrophages(Reference Klei, Meinderts and van den Berg64), no differences between groups were observed regarding the Fe transfer rate between the spleen and bone marrow transit compartment in the present study (Fig. 6(w) and (y)). Conversely, the intercompartmental Fe flux between the bone marrow transit and liver storage compartments (k 6,14; k 14,6) was affected by the HF diet, so there was a hepatic accumulation of Fe from the erythrocyte destruction (P = 0·001; Fig. 6(t) and (u)). Under certain pathological conditions, the liver appears to play important roles in the rapid removal of stressed or damaged erythrocytes and in the recycling of Fe. Theurl et al.(Reference Theurl, Hilgendorf and Nairz65) showed in a mouse model that infused-stressed erythrocytes are predominantly cleared by the liver. The presence of stressed or damaged erythrocytes leads to a rapid recruitment of monocytes, and these cells give rise to transient macrophages, which are phagocytes that absorb erythrocytes and recycle Fe, in a way that, as suggested by the authors, adapts the body to fluctuations in the integrity of erythrocytes(Reference Theurl, Hilgendorf and Nairz65). In addition, erythrocyte isolates from HF diet-fed rabbits (steatohepatitis model) showed increased osmotic fragility and the externalisation of phosphatidylserine on the outer leaflet of the erythrocyte membrane, allowing for increased phagocytosis by macrophages that reside in hepatic sinusoids and increased liver Fe deposition(Reference Otogawa, Kinoshita and Fujii66).
Moreover, low-grade inflammation, hyperinsulinaemia and insulin resistance in obesity have been associated with changes in erythrocyte rheological parameters (adhesiveness, aggregation)(Reference Samocha-Bonet, Lichtenberg and Tomer67,Reference Solá, Vayá and Corella68) . The amount and type of fat in the diet also appear to affect Fe status by altering the oxidation of fatty acids in the erythrocyte membrane(Reference Miret, Sáiz and Mitjavila69). In addition, Unruh et al.(Reference Unruh, Srinivasan and Benson70) showed in C57BL/6 mice that HF diets rich in SFA promote early erythrocyte dysfunction through inflammatory interactions with macrophages and endothelial cells. These changes were associated with up to three times greater retention of Fe by the spleen. Other dietary inadequacies associated with an obesogenic diet profile (high-energy/micronutrient-restricted diets) can also lead to the impairment of erythrocyte integrity with impacts on Fe status. The consumption of an HF diet with a moderate Mg restriction by young Wistar rats has been associated with Fe redistribution and changes in the osmotic fragility of erythrocytes(Reference Teixeira71,Reference De Carli, Lobo and Sales72) . In the present study, although no significant effect of the HF diet on haematological parameters was observed, body adiposity was positively associated with reticulocyte count (r 0·43; P = 0·05), suggesting an adaptive body response to dietary fat overload.
Figure 7 depicts the predicted compartmental Fe pool masses (plasma, erythrocytes, liver (transit and storage) and spleen) resulting from an HF diet consumption for 300 d following the last day of the experiment (totalling 360 d). Dietary lipid overload resulted in a progressive increase in the erythrocytes, liver storage and spleen Fe pools (P < 0·01; Fig. 7(b), (e) and (f)). The increase in the Fe liver storage compartment was reflected as a significant difference from the total liver Fe only from 240 d (P < 0·01; Fig. 7(c)), considering that the tissue transit Fe pool compartment did not differ between groups throughout the simulated period (Fig. 7(d)). This projected scenario, which signifies a trend of tissue Fe accumulation in the absence of evident hyperferremia(Reference Jézéquel, Lainé and Laviolle7,Reference Fernández-Real and Manco8,Reference Dongiovanni, Lanti and Gatti52) , could suggest a pathological state resembling DIOS in older rats with a long-term HF diet consumption. Interestingly, changes in the IRP-IRE system and/or in the hepcidin-Fpn axis have been suggested as mechanistic events underpinning DIOS in previous studies with diet-induced obese animal models(Reference Meli, Raso and Irace50,Reference Dongiovanni, Lanti and Gatti52) . According to our results, the inferred increase in Fe transfer from bone marrow to the liver, paralleled by increased hepatic Fe and ferritin heavy-chain mRNA levels among HF diet-fed animals, suggest that under this feeding condition, liver siderosis occurred, at least in part, due to a favoured liver erythrocyte uptake.

Fig. 7. Predicted compartmental iron pool masses (plasma (a), erythrocytes (b), total liver (c), liver transit (d), liver storage (e) and spleen (f)) resulting from high-fat diet consumption for 300 d following the last day of the experiment (totalling 360 d). Values are means, and vertical lines indicate 95 % confidence intervals. Data were analysed using an unpaired t test. * Significant differences between the groups (P < 0·05). , High-fat group (n 10); , pair-feeding group (n 7).
Conclusion
Significant associations of body fat with the Fe pool in different tissues (compartments), and an increased hepatic Fe accumulation due to a possibly increased Fe transfer rate from erythrocytes to the liver, are indicative that the consumption of an HF diet induces Fe decompartmentalisation. If this feeding condition were to be prolonged, tissue Fe accumulation may occur, with features resembling DIOS as described in obese rodents and humans.
Acknowledgements
The authors thank Ms. Liliam Takayama for her technical assistance, and Fundação de Amparo à Pesquisa do Estado de São Paulo (research project 2010/05644-5) for supporting this research and the fellowships awarded to A. R. L. and E. H. S. G.. We also thank Álvaro Augusto F. Pereira and Dennys E. Cintra for reviewing the manuscript.
A. R. L. was involved in manuscript writing; study concept and design; acquisition, analysis and interpretation of data. E. H. S. G. contributed to study concept and design; acquisition, analysis and interpretation of data. C. H. M., E. C., P. D. S. T. and L. R. M. S. were in charge of data acquisition, analysis and interpretation. R. M. R. P. and P. B. acquired and analysed the data. C. C. contributed to study concept and design; acquisition, analysis and interpretation of data; obtained funding.
There are no financial, professional or personal conflicts of interests for any of the authors.
Supplementary material
For supplementary material/s referred to in this article, please visit https://doi.org/10.1017/S0007114519002320


