


Introduction
A key question in biology is how populations and communities of organisms are structured across space and time. This question is united in the theory of population genetics and community ecology via the theme of movement (Vellend, Reference Vellend2010), either gene flow via the movement of individuals (and associated alleles) between populations or the movement of species between communities. Holding all other processes constant, the frequency of movement produces results ranging from panmixia or community homogeneity to the complete fixation of alleles or of species. While organismal movement is challenging to measure directly at scale, researchers can rely on molecular genetic tools to infer the movement of individuals and alleles between populations. However, movements that do not lead to reproduction cannot be detected from such genetic data. A potential solution is to explore the population genetics of mutualistic or parasitic organisms to shed light on the total degree of connectedness of the host populations, including both reproductive and non-reproductive movements (Nieberding and Olivieri, Reference Nieberding and Olivieri2007).
Successful examples showing that parasites can provide a refined understanding of host movement come from human ecology (Falush et al., Reference Falush, Wirth, Linz, Pritchard, Stephens, Kidd, Blaser, Graham, Vacher, Perez-Perez, Yamaoka, Mégraud, Otto, Reichard, Katzowitsch, Wang, Achtman and Suerbaum2003; Holmes, Reference Holmes2004) and notable wildlife studies (Nieberding et al., Reference Nieberding, Morand, Libois and Michaux2004; Biek et al., Reference Biek, Drummond and Poss2006; Criscione et al., Reference Criscione, Cooper and Blouin2006; Lee et al., Reference Lee, Ruell, Boydston, Lyren, Alonso, Troyer, Crooks and VandeWoude2012). While these examples have focused on subpopulation structure in individual host and parasite species, similar patterns might be observable at higher levels of ecological organization, such as the community structure of mutualistic and parasitic microbes (Mihaljevic, Reference Mihaljevic2012; Seabloom et al., Reference Seabloom, Borer, Gross, Kendig, Lacroix, Mitchell, Mordecai and Power2015). In this form of analysis, the agents under consideration are not alleles moving between populations but rather individuals of distinct species moving between infracommunities of microbes within hosts, potentially resulting in varying relative abundance of microbial species across host populations (Fig. 1). Whether assessing movement at the scale of microbe population genetics or community species composition, the ability to detect structure depends on the choice of appropriate molecular markers and the life history of the microbe (Jarne and Théron, Reference Jarne and Théron2001; Nieberding and Olivieri, Reference Nieberding and Olivieri2007). Microbes that rely on vertical transmission, or horizontal transmission without a free-living stage or alternative hosts, would be expected to be ideal proxies for associating population or community structure with host movement since the movement of such microbes is intimately tied to the behaviour of a single host species (Wirth et al., Reference Wirth, Meyer and Achtman2005; Nieberding and Olivieri, Reference Nieberding and Olivieri2007).

Figure 1. Conceptual diagram for microbial community dynamics among host populations. Microbe species (coloured dots) exist within hosts (dotted circles), which in turn, exist within host populations (dashed circles). Microbes are transmitted among hosts within a population (inset box). Over time, dispersal of infected host individuals (or vectors) between populations may alter the frequency of alleles or species within microbe communities. Sufficient dispersal between host populations may lead to homogeneous microbial communities.
In the case of microbes with multiple potential hosts, particularly vector-borne microparasites, any structure observed might be challenging to interpret. It has been hypothesized that the population structure of a multi-host parasite should reflect the movement patterns of its most vagile host, since any structure generated by another isolated host will be overwhelmed by frequent dispersal events facilitated by the vagile host (Jarne and Théron, Reference Jarne and Théron2001). Yet, this expectation might be complicated by the nested levels of dependence in vector-borne microparasite systems, wherein the microparasite is dependent on the vector for transmission between hosts, and the vector, being a parasite itself, is dependent on the host for completion of its own life cycle. Previous studies of host-restricted, ectoparasitic vectors and associated microparasites have shown that vectors can show less population structure than their hosts (van Schaik et al., Reference van Schaik, Dekeukeleire, Gazaryan, Natradze and Kerth2018), and either no genetic structure in the microparasites (Levin and Parker, Reference Levin and Parker2013) or poor correlation between the differentiation in microparasite subpopulations with the structure apparent in their hosts or vectors (Witsenburg et al., Reference Witsenburg, Clément, López-Baucells, Palmeirim, Pavlinić, Scaravelli, Ševčík, Dutoit, Salamin, Goudet and Christe2015). It is possible that the low genetic differentiation in vector-borne microparasites is due to the additive effect of host and vector movements (Witsenburg et al., Reference Witsenburg, Clément, López-Baucells, Palmeirim, Pavlinić, Scaravelli, Ševčík, Dutoit, Salamin, Goudet and Christe2015), facilitating high levels of gene flow in microparasite populations. Additional examinations of population and community structure in hosts, vectors and their associated mutualistic and parasitic microbes are needed to find general patterns across systems.
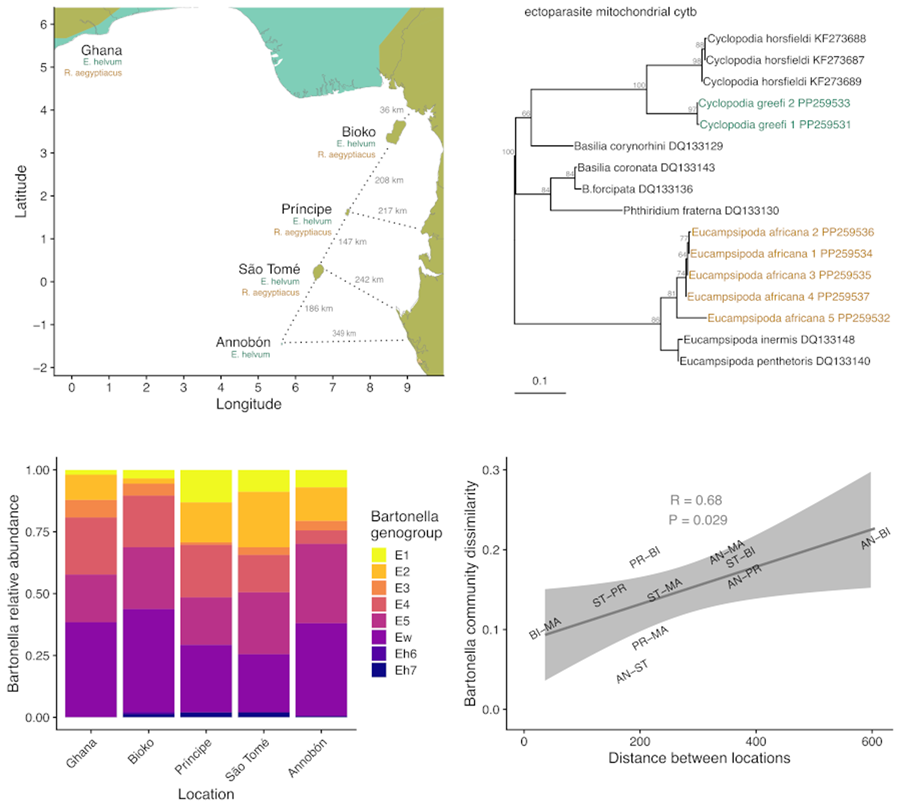
The system chosen for the current study is especially suitable for this type of investigation because of the contained nature of the focal host populations and the traits of the parasites. This study focuses on 2 species of fruit bat (Chiroptera: Pteropodidae), Eidolon helvum and Rousettus aegyptiacus; their ectoparasitic bat flies (Diptera: Nycteribiidae), Cyclopodia greefi and Eucampsipoda africana; and 2 taxa of bacteria, the genus Bartonella (Alphaproteobacteria: Hyphomicrobiales) and the order Enterobacterales (Gammaproteobacteria). The bat species are distributed across Africa and can be found on several isolated islands in the Gulf of Guinea (Fig. 2). Studies on both bat species have found that island populations are genetically distinct from each other and from mainland populations. Specifically, E. helvum from Annobón is a distinct subspecies (E. helvum annobonense) and individuals are significantly smaller than those present on the mainland and the other Gulf of Guinea islands (Juste et al., Reference Juste, Ibáñez and Machordom2000). Similarly, R. aegyptiacus from São Tomé and Príncipe are genetically and morphologically distinct from each other and from populations on Bioko and the mainland and are recognized as distinct subspecies (R. aegyptiacus princeps and R. aegyptiacus tomensis) (Juste and Ibáñez, Reference Juste and Ibáñez1993; Juste et al., Reference Juste, Machordom and Ibañez1996; Stribna et al., Reference Stribna, Romportl, Demjanovič, Vogeler, Tschapka, Benda, Horáček, Juste, Goodman and Hulva2019). Two bat fly species are obligate ectoparasites specific to their host species, C. greefi to E. helvum and E. africana to R. aegyptiacus (Theodor, Reference Theodor1955, Reference Theodor1957). These haematophagous flies spend almost their entire lives on their bat hosts, with gravid females only leaving to deposit a single third-instar larva on the roost substrate (Marshall, Reference Marshall1970; Dick and Patterson, Reference Dick, Patterson, Morand, Krasnov and Poulin2006; Dittmar et al., Reference Dittmar, Morse, Dick, Patterson, Morand, Krasnov and Littlewood2015). While both species of fly are wingless and rely on their hosts for long-distance dispersal, bat flies are agile walkers and could be capable of frequent movements between individual hosts within a roost (Dick and Patterson, Reference Dick, Patterson, Morand, Krasnov and Poulin2006; Dittmar et al., Reference Dittmar, Morse, Dick, Patterson, Morand, Krasnov and Littlewood2015). Both fly species have been documented across much of their respective hosts’ ranges (Theodor, Reference Theodor1957; Billeter et al., Reference Billeter, Hayman, Peel, Baker, Wood, Cunningham, Suu-Ire, Dittmar and Kosoy2012; Qiu et al., Reference Qiu, Kajihara, Nakao, Mulenga, Harima, Hang'ombe, Eto, Changula, Mwizabi, Sawa, Higashi, Mweene, Takada, Simuunza and Sugimoto2020; Reeves et al., Reference Reeves, Laverty, Gratton, Mushabati and Eiseb2020; Atobatele et al., Reference Atobatele, Olatubi, Oyeku, Ayokunle, Oladosu and Ogunnaike2023), but no studies have evaluated their potential genetic differentiation by geography. Only a few population genetic studies have been performed on nycteribiid bat flies generally (Olival et al., Reference Olival, Dick, Simmons, Morales, Melnick, Dittmar, Perkins, Daszak and DeSalle2013; van Schaik et al., Reference van Schaik, Dekeukeleire and Kerth2015, Reference van Schaik, Dekeukeleire, Gazaryan, Natradze and Kerth2018; Witsenburg et al., Reference Witsenburg, Clément, López-Baucells, Palmeirim, Pavlinić, Scaravelli, Ševčík, Dutoit, Salamin, Goudet and Christe2015; Speer et al., Reference Speer, Luetke, Bush, Sheth, Gerace, Quicksall, Miyamoto, Dick, Dittmar, Albury and Reed2019; Verrett et al., Reference Verrett, Webala, Patterson and Dick2022).

Figure 2. Map of study area in West Africa (A), islands in the Gulf of Guinea (B). Axis values are in degrees latitude and longitude. Segments for estimating the shortest distance between islands and the mainland are shown as dotted lines. Bat geographic ranges were retrieved from the IUCN Red List website (https://www.iucnredlist.org/), with modifications to display the occurrence of species on the Gulf of Guinea islands.
The 2 taxa of bacteria frequently associated with bat flies, Bartonella and Enterobacterales, provide an interesting contrast in their relationships with their bat and bat fly hosts. Bartonellae are associated with both bats (host) and bat flies (vector), while Enterobacterales symbionts are only associated with bat flies and are not hosted by bats (Dick and Dittmar, Reference Dick, Dittmar, Klimpel and Mehlhorn2014; Zhu et al., Reference Zhu, Kosoy, Olival and Dittmar2014; Dittmar et al., Reference Dittmar, Morse, Dick, Patterson, Morand, Krasnov and Littlewood2015; Wilkinson et al., Reference Wilkinson, Duron, Cordonin, Gomard, Ramasindrazana, Mavingui, Goodman and Tortosa2016). Bartonellae are facultative intracellular microparasites that produce long-lasting infection in host erythrocytes and are horizontally transmitted among hosts by haematophagous arthropod ectoparasites (Harms and Dehio, Reference Harms and Dehio2012). Bartonella isolates have been characterized from both E. helvum and R. aegyptiacus and similar sequences have been found in C. greefi and E. africana bat flies (Kosoy et al., Reference Kosoy, Bai, Lynch, Kuzmin, Niezgoda, Franka, Agwanda, Breiman and Rupprecht2010; Billeter et al., Reference Billeter, Hayman, Peel, Baker, Wood, Cunningham, Suu-Ire, Dittmar and Kosoy2012; Kamani et al., Reference Kamani, Baneth, Mitchell, Mumcuoglu, Gutiérrez and Harrus2014; Bai et al., Reference Bai, Hayman, McKee and Kosoy2015, Reference Bai, Osinubi, Osikowicz, McKee, Vora, Rizzo, Recuenco, Davis, Niezgoda, Ehimiyein, Kia, Oyemakinde, Adeniyi, Gbadegesin, Saliman, Ogunniyi, Ogunkoya and Kosoy2018; Qiu et al., Reference Qiu, Kajihara, Nakao, Mulenga, Harima, Hang'ombe, Eto, Changula, Mwizabi, Sawa, Higashi, Mweene, Takada, Simuunza and Sugimoto2020; Szentiványi et al., Reference Szentiványi, Heintz, Markotter, Wassef, Christe and Glaizot2023; Špitalská et al., Reference Špitalská, Ševčík, Peresh and Benda2024), suggesting that bat flies are vectors of these bacteria. The diversity of bartonellae infecting E. helvum is especially high, including at least 6 genogroups that meet criteria for recognition as distinct species (Bai et al., Reference Bai, Hayman, McKee and Kosoy2015). This diversity facilitates not only the potential identification of population structure in separate Bartonella genogroups, but also community structure in terms of the relative abundances of different Bartonella genogroups (Fig. 1). In comparison with Bartonella, the order Enterobacterales (including the genera Arsenophonus and Aschnera) are obligate endosymbionts of bat flies and other arthropods (Duron et al., Reference Duron, Bouchon, Boutin, Bellamy, Zhou, Engelstädter and Hurst2008, Reference Duron, Schneppat, Berthomieu, Goodman, Droz, Paupy, Obame Nkoghe, Rahola and Tortosa2014; Nováková et al., Reference Nováková, Hypša and Moran2009; Morse et al., Reference Morse, Dick, Patterson and Dittmar2012, Reference Morse, Bush, Patterson, Dick, Gruwell and Dittmar2013; Wilkinson et al., Reference Wilkinson, Duron, Cordonin, Gomard, Ramasindrazana, Mavingui, Goodman and Tortosa2016). They are thought to be vertically transmitted from mother to offspring via bacteriocytes in the milk glands of nycteribiids and may have mutualistic relationships with bat flies (Hosokawa et al., Reference Hosokawa, Nikoh, Koga, Satô, Tanahashi, Meng and Fukatsu2012; Dittmar et al., Reference Dittmar, Morse, Dick, Patterson, Morand, Krasnov and Littlewood2015). Other studies have reported these endosymbionts in E. africana and other Eucampsipoda species (Morse et al., Reference Morse, Bush, Patterson, Dick, Gruwell and Dittmar2013), and in Cyclopodia dubia, a congener of C. greefi parasitizing Eidolon dupreanum in Madagascar (Wilkinson et al., Reference Wilkinson, Duron, Cordonin, Gomard, Ramasindrazana, Mavingui, Goodman and Tortosa2016). However, these studies have been limited in their geographic extent and have not attempted to identify signals of population structure in these symbionts that may reflect restrictions of bat fly dispersal.
Using this complex system involving bacteria that range from mutualistic to parasitic within their hosts, we tested the effects of geographic restrictions in host bat dispersal on microbial population or community structure across trophic levels. We hypothesize that the genetic structure of bat flies will reflect that of their specific bat hosts, with distinct haplotypes associated with mainland and island populations. Since Enterobacterales are obligate endosymbionts relying entirely on nycteribiid hosts for survival, we predict that these bacteria will mirror the phylogenetic separation in their bat fly host species. Similar to other vector-borne microparasite systems (Levin and Parker, Reference Levin and Parker2013; Witsenburg et al., Reference Witsenburg, Clément, López-Baucells, Palmeirim, Pavlinić, Scaravelli, Ševčík, Dutoit, Salamin, Goudet and Christe2015), we expect to see no population genetic structure in the separate Bartonella genogroups found in flies. However, it is possible that the relative abundances of Bartonella genogroups detected in bat fly species will differ across sampled host populations due to host movement patterns (Fig. 1). Results from this investigation could identify evidence for the dispersal of bat flies and their symbionts through cryptic, non-reproductive movements of bats that are not captured in their genetic population structure. In addition to evaluating the differentiation of symbiont populations and communities, we assessed patterns in the prevalence of Bartonella bacteria across locations – particularly the influence of bat age structure and bat fly density – to better understand how these bacteria are maintained in host populations. Knowledge of bat movements across isolated islands and mainland Africa will shed light on their phylogeography, population status and conservation, and their potential to transmit other infectious agents. The results of this study will also increase our understanding of the ecological processes affecting community diversity in vector-borne parasite systems.
Materials and methods
Specimen collection
Bat flies were collected opportunistically during the course of a long-term research programme on the demographics, genetic population structure and viral transmission dynamics of E. helvum across Africa and the Gulf of Guinea islands from 2009 to 2016 (Peel et al., Reference Peel, Sargan, Baker, Hayman, Barr, Crameri, Suu-Ire, Broder, Lembo, Wang, Fooks, Rossiter, Wood and Cunningham2013, Reference Peel, Baker, Hayman, Suu-Ire, Breed, Gembu, Lembo, Fernández-Loras, Sargan, Fooks, Cunningham and Wood2016, Reference Peel, Wood, Baker, Breed, de Carvalho, Fernández-Loras, Gabrieli, Gembu, Kakengi, Kaliba, Kityo, Lembo, Mba, Ramos, Rodriguez-Prieto, Suu-Ire, Cunningham and Hayman2017; Baker et al., Reference Baker, Suu-Ire, Barr, Hayman, Broder, Horton, Durrant, Murcia, Cunningham and Wood2014). This sampling occasionally captured other fruit bat species as by-catch, including R. aegyptiacus on São Tomé and Príncipe. While R. aegyptiacus is present on Bioko (Juste and Ibáñez, Reference Juste and Ibáñez1993; Kwiecinski and Griffiths, Reference Kwiecinski and Griffiths1999; Stribna et al., Reference Stribna, Romportl, Demjanovič, Vogeler, Tschapka, Benda, Horáček, Juste, Goodman and Hulva2019), this species was not sampled from this island as part of this study. Additional bat capture and bat fly sampling targeting R. aegyptiacus in central Ghana was performed in 2012 and 2016. Permits for bat capture and sampling were granted by national and local authorities and under ethics approval from the Zoological Society of London Ethics Committee (WLE/0489 and WLE/0467); field protocols followed the American Society of Mammalogists guidelines (Sikes et al., Reference Sikes and Gannon2011). Fruit bats were captured using mist nets (6–18 m; 38 mm) as bats departed roost sites at dusk or were returning at dawn. Bats were held in individual cloth bags until processing, wherein bat flies were removed from the pelage of all captured bat species while under manual restraint. Flies obtained from both species were stored in 1.2 mL microcentrifuge tubes pooled by individual bat. A minority of flies from Ghana (n = 18) were collected from the clothes of researchers while processing bats or on the ground under roosts (presumably groomed off and returning to the roost). The flies collected under roosts or from clothes were attributed to E. helvum based on the bats being sampled at the time or the predominant species in the roost and were pooled in 1.2 mL microcentrifuge tubes by date and researcher name. Pooled flies were stored either without media in a cool box before freezing or in ethanol, and then stored at 4 or −20°C until shipment. Flies were initially shipped on dry ice to the Zoological Society of London, then to the Centers for Disease Control and Prevention Division of Vector-Borne Diseases, where flies were stored at −80°C until processing. Distances between islands in the Gulf of Guinea and the mainland (considering Ghana as representative of the mainland population) were measured on Google Earth (http://earth.google.com). Age distributions of E. helvum populations from sampling locations were taken from Peel et al. (Reference Peel, Wood, Baker, Breed, de Carvalho, Fernández-Loras, Gabrieli, Gembu, Kakengi, Kaliba, Kityo, Lembo, Mba, Ramos, Rodriguez-Prieto, Suu-Ire, Cunningham and Hayman2017). Genetic data from E. helvum, specifically pairwise distances between populations from mitochondrial DNA (mtDNA) sequences [cytochrome b (cytb)] and microsatellite loci, were taken from Peel et al. (Reference Peel, Sargan, Baker, Hayman, Barr, Crameri, Suu-Ire, Broder, Lembo, Wang, Fooks, Rossiter, Wood and Cunningham2013).
Laboratory methods
Bat flies were initially identified to species based on host associations and morphological traits (Theodor, Reference Theodor1955, Reference Theodor1957, Reference Theodor1967). Whole bat flies were surface sterilized following published procedures (Billeter et al., Reference Billeter, Hayman, Peel, Baker, Wood, Cunningham, Suu-Ire, Dittmar and Kosoy2012) and then homogenized in Navy Eppendorf bead tubes (Next Advance, Averill Park, NY, USA) containing 400 μL of brain heart infusion (CDC, Atlanta, GA, USA) using a Bullet Blender Gold (Next Advance) until no visible appendages remained. Tubes were briefly centrifuged and a 200 μL aliquot of homogenate was taken for DNA extraction. DNA was extracted from homogenates using the KingFisher Flex Purification System and associated MagMAX Pathogen RNA/DNA Kit (ThermoFisher, Waltham, MA, USA) following manufacturer protocols and then stored at 4°C during the molecular haplotyping process.
A subset of flies was haplotyped through polymerase chain reaction (PCR) amplification and sequencing of 2 mtDNA genes, 16S ribosomal RNA (rRNA) and cytb. These markers have previously been used for identification of species and detection of intraspecific diversity in bat flies (Dittmar et al., Reference Dittmar, Porter, Murray and Whiting2006; Hosokawa et al., Reference Hosokawa, Nikoh, Koga, Satô, Tanahashi, Meng and Fukatsu2012; Olival et al., Reference Olival, Dick, Simmons, Morales, Melnick, Dittmar, Perkins, Daszak and DeSalle2013; Bai et al., Reference Bai, Osinubi, Osikowicz, McKee, Vora, Rizzo, Recuenco, Davis, Niezgoda, Ehimiyein, Kia, Oyemakinde, Adeniyi, Gbadegesin, Saliman, Ogunniyi, Ogunkoya and Kosoy2018). Enterobacterales symbionts of bat flies were detected by amplification of the 16S rRNA gene (Duron et al., Reference Duron, Bouchon, Boutin, Bellamy, Zhou, Engelstädter and Hurst2008). Bartonella DNA was amplified and sequenced at 3 markers commonly used for detection and characterization of bartonellae (La Scola et al., Reference La Scola, Zeaiter, Khamis and Raoult2003; Gutiérrez et al., Reference Gutiérrez, Vayssier-Taussat, Buffet and Harrus2017; Kosoy et al., Reference Kosoy, McKee, Albayrak and Fofanov2018): 16S–23S rRNA intergenic spacer region (ITS), citrate synthase gene (gltA) and cell division protein gene (ftsZ). These 3 genes are among the most frequently used markers for Bartonella detection and genotyping, facilitating phylogenetic comparisons with other sequences, and are able to detect low quantities of DNA in environmental samples, especially in their nested forms (Bai et al., Reference Bai, Gilbert, Fox, Osikowicz and Kosoy2016; Kosoy et al., Reference Kosoy, McKee, Albayrak and Fofanov2018).
All PCR primers and protocols are listed with their associated references in Tables S1–S2. Preparation of PCR reagents was performed in a separate room from amplification to prevent cross-contamination. Extraction and negative (nuclease-free water) controls were used in all reactions to detect contamination of reagents. Bartonella doshiae was used as a positive control in all reactions for Bartonella detection to identify appropriately sized products. No positive controls were used for the mtDNA and Enterobacterales symbionts, but a DNA ladder was used to identify amplicons of approximately correct size: ~400 bp for mitochondrial 16S rRNA, ~380 bp of cytb and ~570 bp for bacterial 16S rRNA. Amplification products were visualized by gel electrophoresis using 1.5% agar and GelGreen stain (Biotium, Hayward, CA, USA) and then purified using a QIAquick PCR Purification Kit (QIAGEN, Valencia, CA, USA) following manufacturer's instructions. Purified products were prepared for sequencing using Big Dye terminator mix (Applied Biosystems, Inc., Foster City, CA, USA) and the same primers as PCR (the second-round primers in the case of nested ftsZ and gltA protocols) and then sequenced in both directions on an ABI 3130 Genetic Analyser (Applied Biosystems). Sequence reads were assembled with the SeqMan Pro program in Lasergene v14 (DNASTAR, Madison, WI, USA) and manually checked for ambiguous bases before phylogenetic analysis. Sequences were validated as the correct gene and target organism using the Basic Local Alignment Search Tool (BLAST; https://blast.ncbi.nlm.nih.gov/Blast.cgi).
Due to the potential amplification biases of each primer set towards different Bartonella genogroups in a sample, the sequences obtained from the 3 targeted genes were considered as independent measurements of the community of Bartonella genogroups in a sample. The presence of coexisting genogroups was confirmed in many samples through observation of multiple peaks in the electropherograms, which were separated into distinct sequences by comparison with previously obtained Bartonella sequences from the target bat and bat fly species (Kosoy et al., Reference Kosoy, Bai, Lynch, Kuzmin, Niezgoda, Franka, Agwanda, Breiman and Rupprecht2010; Billeter et al., Reference Billeter, Hayman, Peel, Baker, Wood, Cunningham, Suu-Ire, Dittmar and Kosoy2012; Bai et al., Reference Bai, Hayman, McKee and Kosoy2015, Reference Bai, Osinubi, Osikowicz, McKee, Vora, Rizzo, Recuenco, Davis, Niezgoda, Ehimiyein, Kia, Oyemakinde, Adeniyi, Gbadegesin, Saliman, Ogunniyi, Ogunkoya and Kosoy2018; McKee et al., Reference McKee, Webb, Kosoy, Bai, Osikowicz, Suu-Ire, Ntiamoa-Baidu, Cunningham, Wood and Hayman2021). Presence/absence of Bartonella genogroups in each bat fly was then summarized as total counts across sampling locations.
Phylogenetic analysis
Sequences from each locus were aligned with closely matching references from GenBank using the local, iterative method L-INS-i in MAFFT v7.187 (Katoh and Standley, Reference Katoh and Standley2013) and trimmed to equal length with Gblocks v0.91b (Castresana, Reference Castresana2000). Evolutionary model selection and maximum likelihood phylogeny reconstruction for Bartonella sequences, haplotyped mitochondrial loci and Enterobacterales symbiont sequences were performed using IQ-Tree v2.1.1 (Nguyen et al., Reference Nguyen, Schmidt, von Haeseler and Minh2015; Minh et al., Reference Minh, Schmidt, Chernomor, Schrempf, Woodhams, von Haeseler and Lanfear2020). The top-ranking models for each set of sequences according to the Bayesian information criterion (BIC) were used for phylogenetic analysis (Schwarz, Reference Schwarz1978; Kalyaanamoorthy et al., Reference Kalyaanamoorthy, Minh, Wong, von Haeseler and Jermiin2017). Branch support was estimated using 1000 ultrafast bootstrap replicates (Hoang et al., Reference Hoang, Chernomor, von Haeseler, Minh and Vinh2018). Distinct haplotypes of mitochondrial loci and Enterobacterales symbionts were delineated by single nucleotide changes and the observed counts of haplotypes were assessed across sampling locations. Bartonella sequences were assigned into separate genogroups based on phylogenetic clustering into well-supported (>70% bootstrap support) monophyletic clades with closely matching reference sequences in the maximum likelihood trees, separately for each of the 3 gene targets (ftsZ, gltA and ITS). To display how Bartonella genogroups are arranged within the broader phylogeny of the genus, we generated a consensus tree from concatenated ftsZ and gltA sequences. Sequences from named Bartonella species (including Bartonella rousetti; Kosoy et al., Reference Kosoy, Bai, Lynch, Kuzmin, Niezgoda, Franka, Agwanda, Breiman and Rupprecht2010), representative strains of genogroups E1–E5 and Ew (Bai et al., Reference Bai, Hayman, McKee and Kosoy2015), and sequences representing genogroups Eh6 and Eh7 from a longitudinal study on Bartonella in a captive colony of E. helvum in Ghana (McKee et al., Reference McKee, Webb, Kosoy, Bai, Osikowicz, Suu-Ire, Ntiamoa-Baidu, Cunningham, Wood and Hayman2021) were aligned for each gene, trimmed to equal length and concatenated before model selection and maximum likelihood analysis using IQ-Tree.
Statistical analysis
Bartonella diversity in bat flies sampled from each location was calculated as richness, the Shannon number (the exponentiated form of Shannon entropy) and the inverse Simpson index in the R package ‘vegan’ (Oksanen et al., Reference Oksanen, Kindt, Legendre, O'Hara, Simpson, Solymos, Stevens and Wagner2007; R Core Team, 2023). Confidence intervals for bat fly prevalence on bats, Bartonella prevalence in bat flies and Enterobacterales symbiont prevalence in bat flies were estimated using Wilson score intervals (Wilson, Reference Wilson1927). Complete metadata on bat captures was not available for all locations, so bat fly prevalence was only calculated for E. helvum from the Gulf of Guinea islands. The presence of Enterobacterales symbionts was only tested in a subset of bat flies due to inadequate sample volume following repeat testing. Since samples from each location were subdivided onto different plates for extraction, the proportion of original samples that were tested for symbionts varied across locations: 44% from Ghana, 78% from Bioko, 91% from Príncipe, 82% from São Tomé and 73% from Annobón. Two-sided χ 2 tests of proportions and binomial regression models were used to test differences in bat fly prevalence across Gulf of Guinea islands, bat age class and bat sex, as well as differences in Bartonella prevalence across sampling locations, bat age classes and bat sex. Additional χ 2 tests and binomial regression models were run on Bartonella prevalence across sampling years to test whether detectability of these bacteria was lower in older samples. Kruskal–Wallis rank-sum tests and Poisson regression models were used to test differences in bat fly counts on E. helvum across sampling locations, bat age classes and bat sex. P values for post-hoc comparisons from regression models were adjusted for multiple tests using the Tukey method (Tukey, Reference Tukey1949).
Bartonella community dissimilarity was calculated as 1 minus the Spearman rank correlation among Bartonella genogroup counts across loci between locations, aggregated across all tested bat flies. Isolation by distance patterns between islands and the mainland, as well as between each island, was explored using matrices of Bartonella community dissimilarity, physical distance between locations and genetic distances between bat populations (mtDNA and microsatellites) taken from Peel et al. (Reference Peel, Wood, Baker, Breed, de Carvalho, Fernández-Loras, Gabrieli, Gembu, Kakengi, Kaliba, Kityo, Lembo, Mba, Ramos, Rodriguez-Prieto, Suu-Ire, Cunningham and Hayman2017) using Mantel tests based on Pearson's correlation (Mantel, Reference Mantel1967). Additional tests were performed on Bartonella community composition across locations, using Bartonella genogroup counts within individual bat flies to calculate a Euclidean distance matrix for relative abundance. We performed univariate permutational multivariate analysis of variance (PERMANOVA) across sampling locations with 999 permutations using the adonis2 function in ‘vegan’ (Oksanen et al., Reference Oksanen, Kindt, Legendre, O'Hara, Simpson, Solymos, Stevens and Wagner2007). Homogeneity of dispersion for Bartonella communities across locations was tested using the betadisper function and permuted 999 times with permutest (Oksanen et al., Reference Oksanen, Kindt, Legendre, O'Hara, Simpson, Solymos, Stevens and Wagner2007). Non-metric multidimensional scaling (NMDS) ordination was used to visualize differences in Bartonella communities between locations using the metaMDS function with 3 dimensions and 250 random starts to find a stable solution (Oksanen et al., Reference Oksanen, Kindt, Legendre, O'Hara, Simpson, Solymos, Stevens and Wagner2007).
Results
Collection and identification of bat flies
Bat flies were obtained from E. helvum from Ghana, Bioko, Príncipe, São Tomé and Annobón, while flies from R. aegyptiacus were obtained only from Ghana, Príncipe and São Tomé (Table 1). A total of 767 flies were initially identified by morphology using available keys and known host distributions (Theodor, Reference Theodor1955, Reference Theodor1957, Reference Theodor1967). For a subset of 401 flies, sequences were successfully obtained from 1 or both 16S rRNA or cytb loci. All flies from E. helvum were identified as C. greefi Karsch, 1884, while flies from R. aegyptiacus were E. africana Theodor, Reference Theodor1955 except for a single Dipseliopoda biannulata Oldroyd, 1953 from Ghana (Table 2; Table S3). All 3 species are part of the Old World family Nycteribiidae, subfamily Cyclopodiinae (Maa, Reference Maa1965).
Table 1. Sampling sites and dates for bat flies from Ghana and Gulf of Guinea islands

Table 2. Molecular haplotyping and Bartonella infection prevalence in bat flies

Samples were considered successfully haplotyped if 1 or both mitochondrial loci were successfully sequenced. Samples were considered positive for Bartonella bacteria if 1 or more genetic markers produced a sequence confirmed as Bartonella. Binomial 95% confidence intervals for prevalence were estimated using Wilson score intervals.
The 2 mitochondrial loci revealed varying numbers of haplotypes across bat fly species (Fig. 3A–D). Only one 16S rRNA haplotype was found in C. greefi from all locations (Fig. 3A, B) while 2 cytb haplotypes were found in this species: haplotype 1 in all locations and haplotype 2 only on Annobón (Fig. 3C, D). Three individuals from Annobón were confirmed as cytb haplotype 1 through repeated sequencing. Two 16S rRNA haplotypes were found in E. africana (Fig. 3A, B). Haplotype 1 was found in Ghana and was identical to sequences from E. africana on GenBank (accession numbers MH138030, MH138031, MH138033–MH138037) from a previous study in Nigeria (Bai et al., Reference Bai, Osinubi, Osikowicz, McKee, Vora, Rizzo, Recuenco, Davis, Niezgoda, Ehimiyein, Kia, Oyemakinde, Adeniyi, Gbadegesin, Saliman, Ogunniyi, Ogunkoya and Kosoy2018). Haplotype 2 was found in specimens from both Príncipe and São Tomé. Five cytb haplotypes were found in E. africana (Fig. 3C, D): haplotypes 1–4 were from Ghana and haplotype 5 from Príncipe and São Tomé.

Figure 3. Haplotyping of bat fly species and Enterobacterales symbionts. Bat fly species were identified by sequencing 375 bp of mitochondrial 16S rRNA (A) and 387 bp of cytb (C) while bacterial symbionts of flies were identified by sequencing 575 bp of bacterial 16S rRNA (E). Maximum likelihood trees were generated in IQ-Tree using the appropriate substitution models based on BIC (TIM2 + F + G4 for ectoparasite mitochondrial 16S rRNA, TIM + F + G4 for cytb, K2P + R2 for bacterial symbiont 16S rRNA). Nodal support (shown in grey next to branches) was estimated from 1000 bootstrap iterations. GenBank accession numbers are given next to published reference sequences. Observed counts of haplotypes across locations (B, D and F) are shown based on the total number of specimens haplotyped at each marker. In all panels, the colours indicate separate bat fly species and symbionts: Cyclopodia greefi (green), Eucampsipoda africana (orange) and Dipseliopoda biannulata (pink).
Nycteribiid prevalence and the number of flies per bat varied across the different Gulf of Guinea islands and other demographic groups (Table 3). Nycteribiid prevalence differed significantly across islands (χ 2 = 35, d.f. = 3, P < 0.001). Prevalence values on Príncipe (60%) and São Tomé (73%) were significantly lower (P < 0.01) than both Annobón (92%) and Bioko (91%), but differences between Príncipe and São Tomé were not significant (P > 0.05). Nycteribiid prevalence also differed significantly across E. helvum age groups (χ 2 = 9.6, d.f. = 3, P = 0.02). Prevalence decreased across older age groups of bats: 93% in neonates, 80% in juveniles, 81% in sexually immature adults and 75% in adults. Differences in prevalence were significant only for neonates vs adults (P = 0.02) and were not significant for comparisons among other age groups. There was no significant difference in nycteribiid prevalence between sexes: 78% in female E. helvum vs 83% in males (χ 2 = 0.9, d.f. = 1, P = 0.33). According to Kruskal–Wallis tests, Nycteribiid counts on infested bats did not differ significantly across locations (χ 2 = 2.7, d.f. = 3, P = 0.45) or sexes (χ 2 = 0.8, d.f. = 1, P = 0.36), and there were no significant post-hoc comparisons of nycteribiid counts between islands. However, Poisson regression identified significantly higher mean nycteribiid counts on males vs females (P = 0.024). Nycteribiid counts did differ across bat age classes (Kruskal–Wallis χ 2 = 7.6, d.f. = 3, P = 0.047), averaging 3.0 (IQR 2–4) flies per bat on adults, 2.3 (IQR 1–3) on sexually immature adults, 2.5 (IQR 1–3) on juveniles and 2.3 (IQR 1–3) on neonates (Table 3). Post-hoc comparisons between age groups were not significant, though comparisons between adults vs sexually immature adults (P = 0.082) and between adults and neonates (P = 0.063) were borderline significant.
Table 3. Patterns of nycteribiid bat fly infestation prevalence on E. helvum sampled from the Gulf of Guinea islands

Nycteribiid prevalence was calculated based on the number of bats with nycteribiids present out of the total bats captured at the location. Binomial 95% confidence intervals for prevalence were estimated using Wilson score intervals. Nycteribiid count data are displayed as the mean count on bats with nycteribiids present (excluding zeroes); the range next to the mean is the interquartile range (IQR).
Patterns of Bartonella prevalence and diversity
Bartonella DNA was present in bat flies collected from both E. helvum and R. aegyptiacus (Table 2). On average, Bartonella prevalence was higher in flies collected from E. helvum (80%) than in flies collected from R. aegyptiacus (42%; χ 2 = 41, d.f. = 1, P < 0.001). Prevalence differed across locations for C. greefi collected from E. helvum (χ 2 = 42.2, d.f. = 4, P < 0.001), and Bioko island had significantly lower prevalence (P < 0.03) vs all other locations (Table 2). Bartonella prevalence did not differ across locations for E. africana collected from R. aegyptiacus (χ 2 = 1.4, d.f. = 2, P = 0.5). We also examined differences in Bartonella prevalence across sampling years (Table S4). There were no significant differences in prevalence over sampling years for C. greefi (χ 2 = 1.5, d.f. = 4, P = 0.68) or E. africana (χ 2 = 1.9, d.f. = 2, P = 0.38). Likewise, there was no significant linear trend in prevalence over time for either species (C. greefi: b = 0.05, z = 1.04, P = 0.3; E. africana: b = 0.1, z = 0.89, P = 0.37). These findings indicate that time since sampling does not appear to be a substantial confounding factor in observed patterns of prevalence across locations.
Eight Bartonella genogroups were detected in C. greefi: E1–E5, Ew, Eh6 and Eh7 (Figs S1–S7; Fig. 4A). Genogroups E1–E5 and Ew have been detected previously in C. greefi and E. helvum from other locations and characterized at multiple genetic markers to verify their status as distinct species (Kosoy et al., Reference Kosoy, Bai, Lynch, Kuzmin, Niezgoda, Franka, Agwanda, Breiman and Rupprecht2010; Billeter et al., Reference Billeter, Hayman, Peel, Baker, Wood, Cunningham, Suu-Ire, Dittmar and Kosoy2012; Kamani et al., Reference Kamani, Baneth, Mitchell, Mumcuoglu, Gutiérrez and Harrus2014; Bai et al., Reference Bai, Hayman, McKee and Kosoy2015; McKee et al., Reference McKee, Webb, Kosoy, Bai, Osikowicz, Suu-Ire, Ntiamoa-Baidu, Cunningham, Wood and Hayman2021). In contrast, only 1 genogroup was found in E. africana flies from R. aegyptiacus (Figs S1–S7; Table S5). This genogroup, identified from cultured isolates as B. rousetti, has been found in R. aegyptiacus sampled to date from Kenya, Nigeria, Zambia, South Africa and several countries in the Middle East (Kosoy et al., Reference Kosoy, Bai, Lynch, Kuzmin, Niezgoda, Franka, Agwanda, Breiman and Rupprecht2010; Bai et al., Reference Bai, Osinubi, Osikowicz, McKee, Vora, Rizzo, Recuenco, Davis, Niezgoda, Ehimiyein, Kia, Oyemakinde, Adeniyi, Gbadegesin, Saliman, Ogunniyi, Ogunkoya and Kosoy2018; Qiu et al., Reference Qiu, Kajihara, Nakao, Mulenga, Harima, Hang'ombe, Eto, Changula, Mwizabi, Sawa, Higashi, Mweene, Takada, Simuunza and Sugimoto2020; Szentiványi et al., Reference Szentiványi, Heintz, Markotter, Wassef, Christe and Glaizot2023; Špitalská et al., Reference Špitalská, Ševčík, Peresh and Benda2024). To test whether genogroups Eh6 and Eh7 likely represent distinct Bartonella species according to the criteria established by La Scola et al. (Reference La Scola, Zeaiter, Khamis and Raoult2003), we compared sequences from these genogroups to the other Bartonella genogroups in E. helvum and C. greefi or other named Bartonella species. The closest match for ftsZ from Eh6 (MN250783) was 87% sequence identity with Bartonella koehlerae while the closest match for ftsZ from Eh7 (MN250763), Bartonella birtlesii, shared 88% identity. For gltA sequences, the closest matches were B. koehlerae (87%) for Eh6 (MN250780) and E4 (89%) or Bartonella alsatica (88%) for Eh7 (MN250763). These shared identities are below median sequence identity values for closely related Bartonella species (94.4% for ftsZ and 93.6% for gltA) (La Scola et al., Reference La Scola, Zeaiter, Khamis and Raoult2003), suggesting that genogroups Eh6 and Eh7 are distinct species.

Figure 4. Patterns of Bartonella diversity in C. greefi bat flies collected from E. helvum. (A) Relative abundance of 8 Bartonella genogroups across sampling locations. (B) Bartonella genogroup alpha diversity across locations according to richness, Shannon number and inverse Simpson index.
Unlike the situation in bat flies collected from R. aegyptiacus, Bartonella diversity varied across locations for flies collected from E. helvum (Table S5). Bartonella genogroups E1–E5 and Ew were found in C. greefi from Ghana and all islands whereas the rare genogroups Eh6 and Eh7 were detected inconsistently (Fig. 4A). The highest Bartonella richness in C. greefi was from Bioko whereas the highest evenness (Shannon number and inverse Simpson index) was in flies from Príncipe and São Tomé (Fig. 4B). No clear evidence of population structure was found in Bartonella genogroups at any of the sequenced markers (ITS, ftsZ, gltA). Identical sequences within each genogroup could be found broadly across sampling locations, including on isolated islands (Figs S1–S6).
We found that variation in Bartonella prevalence in C. greefi populations from different locations can be explained by demographic covariates (Fig. 5). Bartonella prevalence in C. greefi differed significantly across age groups of E. helvum that flies were collected from (χ 2 = 36, d.f. = 3, P < 0.001). Prevalence values were significantly lower (P < 0.01) in neonates (58%) compared to all other age groups: juveniles (82%), sexually immature adults (84%) and adults (85%). None of the post-hoc comparisons between older age groups were significant. Bartonella prevalence in bat flies did not differ significantly by bat sex (77% in females vs 81% in males; χ 2 = 0.9, d.f. = 1, P = 0.33; Fig. 5C). Age distributions in censused E. helvum populations varied widely across locations at the time of sampling (Peel et al., Reference Peel, Wood, Baker, Breed, de Carvalho, Fernández-Loras, Gabrieli, Gembu, Kakengi, Kaliba, Kityo, Lembo, Mba, Ramos, Rodriguez-Prieto, Suu-Ire, Cunningham and Hayman2017; Table S6) and this was partly reflected in the representation of bat age classes among the bats with nycteribiids that were tested as part of this study (Fig. 5D). In particular, the individuals sampled on Bioko island consisted almost entirely of bats that were less than 2 months old [free-flying dependent young; termed neonates by Peel et al. (Reference Peel, Wood, Baker, Breed, de Carvalho, Fernández-Loras, Gabrieli, Gembu, Kakengi, Kaliba, Kityo, Lembo, Mba, Ramos, Rodriguez-Prieto, Suu-Ire, Cunningham and Hayman2017)]. This was due to inadvertent selection of a sampling site near a nursery roost and the night-time capture of bats during a time when mothers were leaving their offspring in a creche overnight (Peel et al., Reference Peel, Wood, Baker, Breed, de Carvalho, Fernández-Loras, Gabrieli, Gembu, Kakengi, Kaliba, Kityo, Lembo, Mba, Ramos, Rodriguez-Prieto, Suu-Ire, Cunningham and Hayman2017). Bartonella prevalence was lowest in flies from Bioko (Table 2; Fig. 5A). After removing Bioko, the only location with flies sampled from neonate bats, the differences in Bartonella prevalence across juveniles, sexually immature adults and adults were not statistically significant (χ 2 = 0.4, d.f. = 2, P = 0.8) and Bartonella prevalence no longer varied significantly across the remaining locations (χ 2 = 6.7, d.f. = 3, P = 0.084).

Figure 5. Demographic correlates of Bartonella detection in C. greefi bat flies collected from E. helvum. Bartonella detection prevalence in bat flies was calculated by (A) location, (B) bat age class and (C) bat sex and was based on the total positive bat flies collected from all bats. Binomial 95% confidence intervals for prevalence were estimated using Wilson score intervals. (D) Age distribution of E. helvum censused and sampled with flies from each location (and flies were tested for Bartonella). Note that many individuals captured on Bioko island in May 2010 were free-flying dependent young that were less than 2 months old (below the age cut-off for juveniles), so are thus lumped with other neonates.
To investigate the dissimilarity in Bartonella communities in C. greefi between locations, we considered the Ghanaian population to be representative of the African mainland (Peel et al., Reference Peel, Sargan, Baker, Hayman, Barr, Crameri, Suu-Ire, Broder, Lembo, Wang, Fooks, Rossiter, Wood and Cunningham2013) and we assessed the correlation between Bartonella community dissimilarity (based on Spearman rank correlation of aggregate Bartonella genogroup counts) and distance between each island and the mainland, and between each island (Figs 2B, 6). We found a positive signal of isolation by distance in Bartonella community dissimilarity (Mantel test R = 0.68, P = 0.025). Based on data from Peel et al. (Reference Peel, Sargan, Baker, Hayman, Barr, Crameri, Suu-Ire, Broder, Lembo, Wang, Fooks, Rossiter, Wood and Cunningham2013), similar isolation by distance patterns was observed for E. helvum according to ϕST [ϕST/(1–ϕST)] for cytb sequences (Mantel test R = 0.56, P = 0.058) and F ST [F ST/(1–F ST)] for microsatellites (Mantel test R = 0.74, P = 0.033), though no significant associations (Mantel P > 0.05) were observed between either measure of bat genetic distance and Bartonella community dissimilarity (Fig. S9). Additional tests of Bartonella community composition were performed on a Euclidean distance matrix of Bartonella genogroup counts within individual flies. According to PERMANOVA, Bartonella community composition was structured by sampling location (R = 0.2, F = 5.7, d.f. = 4, P = 0.001). However, we note that these data violate PERMANOVA's assumption of homoscedasticity (F = 3.9, d.f. = 4, P = 0.004). NMDS ordination showed substantial overlap in Bartonella community composition (Fig. S8), though Annobón diverged from the other locations, particularly in lower abundance of genogroup E4. There was also a statistically significant association between Bartonella community dissimilarity and physical distances between sampling locations (Mantel test R = 0.02, P = 0.004).

Figure 6. Correlation between Bartonella community dissimilarity in C. greefi and physical distance between locations. Mantel tests based on Pearson's correlation were performed with 119 permutations (the complete set for the 5 × 5 matrices). Physical distances match segments in Fig. 2B, considering Ghana as a representative mainland population. Community dissimilarity was calculated as 1 minus the Spearman rank correlation between Bartonella genogroup counts across locations. Locations are abbreviated as AN, Annobón; BI, Bioko; MA, mainland (Ghana); PR, Príncipe; ST, São Tomé.
Detection and identification of bat fly symbionts
Enterobacterales symbionts (Gammaproteobacteria) were successfully detected in bat flies from mainland and island populations (Table S8). Symbionts were challenging to detect with the 16S rRNA PCR protocol, with 4% (21/512) of C. greefi and 63% (15/24) of E. africana producing positive Enterobacterales results in the subset of samples that were tested. The bacteria detected in C. greefi were most closely related to endosymbionts from the congener C. dubia collected from E. dupreanum from Madagascar (Wilkinson et al., Reference Wilkinson, Duron, Cordonin, Gomard, Ramasindrazana, Mavingui, Goodman and Tortosa2016). The phylogenetic group that contains the symbionts from Cyclopodia is distinct from other known genera of bat fly symbionts, including Arsenophonus, Arsenophonus-like organisms and Aschnera (Wilkinson et al., Reference Wilkinson, Duron, Cordonin, Gomard, Ramasindrazana, Mavingui, Goodman and Tortosa2016). Only 1 haplotype of the C. greefi symbiont was obtained from flies collected from Ghana, Príncipe, São Tomé and Annobón (Fig. 3E, F; Table S3). The bacteria from E. africana were most closely related to endosymbionts detected in Eucampsipoda, Leptocyclopodia and Dipseliopoda spp. bat flies from bats in Kenya, China, Philippines, Madagascar and Comoros; this phylogenetic group is considered part of the genus Arsenophonus (Morse et al., Reference Morse, Bush, Patterson, Dick, Gruwell and Dittmar2013; Wilkinson et al., Reference Wilkinson, Duron, Cordonin, Gomard, Ramasindrazana, Mavingui, Goodman and Tortosa2016). Two haplotypes of E. africana symbionts were obtained from the samples (Fig. 3E, F; Table S3). Haplotype 1 was found in flies collected from Ghana and was most closely related to a symbiont previously detected in E. africana from Kenya (Morse et al., Reference Morse, Bush, Patterson, Dick, Gruwell and Dittmar2013). Haplotype 2 was found in flies collected from Príncipe and São Tomé and formed a separate branch from symbionts in E. africana from the mainland and E. theodori from Comoros (Wilkinson et al., Reference Wilkinson, Duron, Cordonin, Gomard, Ramasindrazana, Mavingui, Goodman and Tortosa2016).
Discussion
Host–vector–microbe systems are ubiquitous, but our knowledge of the effects of host movement on the population genetics and community assembly of ectoparasites and microbes is still incomplete. Through joint analysis of ectoparasitic vectors and bacterial microparasites and symbionts, this study aimed to infer patterns of host movement beyond those reflected in population genetic analysis of hosts alone. This study contributes to our understanding of the phylogeography of African bats and nycteribiid bat flies and supports general expectations of limited genetic differentiation in vector-borne microparasites.
Sequencing mitochondrial loci from C. greefi and E. africana bat flies revealed limited population structure in both species compared with their bat hosts. A unique haplotype of C. greefi was found only on Annobón, which corresponds with the presence of a genetically distinct subspecies of E. helvum on this island (Juste et al., Reference Juste, Ibáñez and Machordom2000; Peel et al., Reference Peel, Sargan, Baker, Hayman, Barr, Crameri, Suu-Ire, Broder, Lembo, Wang, Fooks, Rossiter, Wood and Cunningham2013). The remaining C. greefi specimens from Ghana, Bioko, Príncipe and São Tomé are a single haplotype, failing to capture the genetic differentiation between Príncipe and São Tomé or the distinction of these island populations from the mainland and Bioko as seen in E. helvum (Peel et al., Reference Peel, Sargan, Baker, Hayman, Barr, Crameri, Suu-Ire, Broder, Lembo, Wang, Fooks, Rossiter, Wood and Cunningham2013). Three individuals from Annobón had this widespread haplotype, suggesting that they represent recent immigrants to Annobón. Such distant dispersal events have been reported in E. helvum, including 1 individual recorded from the Cape Verde islands 570 km from the African mainland (Jiménez and Hazevoet, Reference Jiménez and Hazevoet2010) and another recorded travelling 370 km from its roost in Zambia in 1 night during migration (Richter and Cumming, Reference Richter and Cumming2008). The population structure of E. africana also partially mirrored that of its host, R. aegyptiacus. The single haplotype from Príncipe and São Tomé was distinct from the other haplotypes found on the mainland. This reflects the distinctiveness of the R. aegyptiacus populations from these islands compared to the mainland, but fails to distinguish the island populations from one another (Juste and Ibáñez, Reference Juste and Ibáñez1993; Stribna et al., Reference Stribna, Romportl, Demjanovič, Vogeler, Tschapka, Benda, Horáček, Juste, Goodman and Hulva2019). These results agree with past studies that have shown less structure in bat flies compared to their hosts due to recent or ongoing gene flow (Witsenburg et al., Reference Witsenburg, Clément, López-Baucells, Palmeirim, Pavlinić, Scaravelli, Ševčík, Dutoit, Salamin, Goudet and Christe2015; van Schaik et al., Reference van Schaik, Dekeukeleire, Gazaryan, Natradze and Kerth2018). We conclude that occasional, non-reproductive movements of E. helvum and R. aegyptiacus between islands and the mainland may contribute to the dispersal of their ectoparasitic bat flies.
A limitation of this study is that the amount of population structure seen in the flies is sensitive to the choice of genetic marker used for haplotyping. In both fly species, mitochondrial cytb was able to find more distinct haplotypes with greater pairwise distances than 16S rRNA. Previous studies on E. helvum and R. aegyptiacus used cytb to identify population structure. Peel et al. (Reference Peel, Sargan, Baker, Hayman, Barr, Crameri, Suu-Ire, Broder, Lembo, Wang, Fooks, Rossiter, Wood and Cunningham2013) were able to detect differentiation in E. helvum populations on São Tomé and Príncipe from one another using cytb but not with microsatellites and Stribna et al. (Reference Stribna, Romportl, Demjanovič, Vogeler, Tschapka, Benda, Horáček, Juste, Goodman and Hulva2019) were able to distinguish São Tomé and Príncipe populations with both cytb and microsatellites. The 16S rRNA gene may be too conserved for this type of analysis. We suggest using other mitochondrial or nuclear loci for genotyping nycteribiid flies and ideally matching markers between hosts and ectoparasites so that mutation rates and inheritance patterns are similar.
Other factors may have affected the amount of genetic population structure observed in bat flies compared to bats, including differences in generation length, effective population size and selection pressure. Reproduction in E. helvum and R. aegyptiacus is seasonal and females give birth to 1–2 pups per year after reaching sexual maturity after 1 year in R. aegyptiacus (Mutere, Reference Mutere1968; Nkoana et al., Reference Nkoana, Kearney and Markotter2023) and 2 years in E. helvum (Peel et al., Reference Peel, Baker, Hayman, Suu-Ire, Breed, Gembu, Lembo, Fernández-Loras, Sargan, Fooks, Cunningham and Wood2016). Maximum lifespans of E. helvum have been recorded up to 15 years in the wild (Hayman et al., Reference Hayman, McCrea, Restif, Suu-Ire, Fooks, Wood, Cunningham and Rowcliffe2012; Peel et al., Reference Peel, Baker, Hayman, Suu-Ire, Breed, Gembu, Lembo, Fernández-Loras, Sargan, Fooks, Cunningham and Wood2016) and 21 years in captivity (DeFrees and Wilson, Reference DeFrees and Wilson1988), while the maximum age for captive R. aegyptiacus is reported as 25 years (Kwiecinski and Griffiths, Reference Kwiecinski and Griffiths1999). Although specific data on C. greefi and E. africana reproduction are not available, studies of other species living in tropical areas indicate that nycteribiid lifespans are on the order of several hundred days (Marshall, Reference Marshall1970, Reference Marshall1971). Given that development for pupal stage to adult takes about 3 weeks, this means that 70–80% of their lifespan is spent as a reproductively mature adult (Marshall, Reference Marshall1970, Reference Marshall1971). These data suggest that multiple generations of nycteribiids may be produced each year, which may have consequences for mutational fixation rates in bats vs bat flies. Eidolon helvum and R. aegyptiacus are abundant across their ranges, with some colonies numbering in the thousands to millions of individuals (Kwiecinski and Griffiths, Reference Kwiecinski and Griffiths1999; Peel et al., Reference Peel, Wood, Baker, Breed, de Carvalho, Fernández-Loras, Gabrieli, Gembu, Kakengi, Kaliba, Kityo, Lembo, Mba, Ramos, Rodriguez-Prieto, Suu-Ire, Cunningham and Hayman2017; Hurme et al., Reference Hurme, Fahr, Network, Eric-Moise, Hash, O'Mara, Richter, Tanshi, Webala, Weber, Wikelski and Dechmann2022). While our data (Table 3) and other published work (Atobatele et al., Reference Atobatele, Olatubi, Oyeku, Ayokunle, Oladosu and Ogunnaike2023) suggest that nycteribiid prevalence on E. helvum is high across sampled populations, most bats only carry 1–3 bat flies, suggesting that population sizes of nycteribiids are not orders of magnitude higher than that of bat hosts. Published data on Rousettus bats and Eucampsipoda bat flies indicate similar patterns (Rajemison et al., Reference Rajemison, Noroalintseheno and Goodman2017; Pawęska et al., Reference Pawęska, Jansen van Vuren, Storm, Markotter and Kemp2021). It is also possible that bat flies may be experiencing weaker selection pressure than bats because the environment they experience as parasites is relatively stable compared to the environment that bats experience. However, since nycteribiids live in the pelage of bats and must leave their hosts to pupate onto a substrate, they would experience seasonal changes in temperature, humidity and precipitation and other environmental factors that may affect their survival and reproduction. Bat flies also experience predation by their bat hosts (Overal, Reference Overal1980; Ramanantsalama et al., Reference Ramanantsalama, Andrianarimisa, Raselimanana and Goodman2018). Thus, while the selective pressures on bat flies may differ from host bats, these differences may not be as substantial as those experienced by endoparasites or microparasites, whose environment is inside the host's body.
The low genetic diversity observed in bat flies could also be linked to the presence of Enterobacterales symbionts. Previous studies have attributed the lack of population differentiation in mtDNA to selective sweeps caused by reproductive manipulation in those flies not carrying the bacterial symbiont (Hurst and Jiggins, Reference Hurst and Jiggins2005; Lack et al., Reference Lack, Nichols, Wilson and Van Den Bussche2011; Speer et al., Reference Speer, Luetke, Bush, Sheth, Gerace, Quicksall, Miyamoto, Dick, Dittmar, Albury and Reed2019). This selection may include killing of male embryos, changing embryos from male to female or sterilization of uninfected females by infected males, all of which can decrease mtDNA diversity while selecting for mtDNA haplotypes associated with the originally infected females. While reproductive manipulation is well-documented for Wolbachia symbionts of insects (Cariou et al., Reference Cariou, Duret and Charlat2017), it is unknown to what degree, if any, this features in the relationships between Arsenophonus bacteria or other Enterobacterales symbionts and bat flies (Duron et al., Reference Duron, Bouchon, Boutin, Bellamy, Zhou, Engelstädter and Hurst2008; Lack et al., Reference Lack, Nichols, Wilson and Van Den Bussche2011). Sequencing of these fly populations at nuclear loci could identify additional population structure in these species and more accurately estimate the amount of gene flow occurring due to bat dispersal. Such data could also clarify the effect that Enterobacterales symbionts have on mitochondrial diversity.
Despite the possible interaction between bacterial symbionts and mtDNA, the population structure of Enterobacterales symbionts reflected the inferred dispersal patterns of their host bat flies. This fits well with expectations that vertically transmitted parasites are good proxies for inferring movement of their hosts (Nieberding and Olivieri, Reference Nieberding and Olivieri2007). The unique phylogenetic group of Enterobacterales symbionts of C. greefi was genetically homogeneous across Ghana, Príncipe, São Tomé and Annobón. The presence of only 1 haplotype may reflect the occasional, indirect dispersal (via bat hosts) of bat flies carrying these bacteria between islands. The Arsenophonus symbionts of E. africana were split into 2 haplotypes that corresponded to the geographic distribution of the hosts, with 1 haplotype from Príncipe and São Tomé and the other from Ghana. As with haplotyping bat flies, bacterial 16S rRNA may be too conserved to successfully identify phylogenetically distinct haplotypes of Enterobacterales symbionts, and additional genes should be sequenced. These data would be useful in comparing with the diversity at nuclear loci in bat flies to better detect signatures of selective sweeps in mtDNA due to reproductive manipulation.
The patterns observed in Bartonella bacteria reflect their lifestyle as horizontally transmitted, vector-borne microparasites. As expected, no population genetic structure was seen in the separate Bartonella genogroups from C. greefi and E. africana. A previous study using multi-locus sequence typing to characterize Bartonella cultures from genogroups E1–E5 and Ew from E. helvum from African populations also found identical multi-locus sequence types that were found in geographically distant locations on the continent and from Annobón (Bai et al., Reference Bai, Hayman, McKee and Kosoy2015). These results are similar to previous studies that have found little correlation between the genetic structure observed in vector-borne microparasites compared to their hosts or vectors (Levin and Parker, Reference Levin and Parker2013; Witsenburg et al., Reference Witsenburg, Clément, López-Baucells, Palmeirim, Pavlinić, Scaravelli, Ševčík, Dutoit, Salamin, Goudet and Christe2015) and lend support to the hypothesis that host and vector movement have additive effects on gene flow in associated microparasites (Witsenburg et al., Reference Witsenburg, Clément, López-Baucells, Palmeirim, Pavlinić, Scaravelli, Ševčík, Dutoit, Salamin, Goudet and Christe2015). While the markers used for Bartonella detection are sufficiently diverse to identify different Bartonella genogroups and species (La Scola et al., Reference La Scola, Zeaiter, Khamis and Raoult2003; Kosoy et al., Reference Kosoy, McKee, Albayrak and Fofanov2018), their substitution rates may still be too low to detect microevolutionary patterns. Additional studies using culturing and more extensive methods for haplotyping, such as amplified fragment-length polymorphisms or whole genome sequencing, could find additional structure. Nevertheless, by analysing the relative abundance of the diverse Bartonella genogroups found in C. greefi from E. helvum, a significant pattern of isolation by distance was observed, with locations nearer to each other having more similar rank abundances of genogroups, such as Ghana and Bioko or Príncipe and São Tomé. A similar pattern of isolation by distance was seen in E. helvum using mtDNA and microsatellites, but there was no correlation between these genetic distances and Bartonella community structure. Thus, it is likely that movement of bats (with their bat flies) is restricted by the distances between islands, and this results in changes in transmission patterns that affect Bartonella communities. We encourage future studies to consider analysing microparasite and symbiont communities as we have done, since they may help to further clarify patterns of host movements that are uncorrelated with reproduction but lead to dispersal of ectoparasites and microbes.
Bartonella diversity in C. greefi did not vary much, with the same common genogroups occurring across locations and only differing in their relative abundances (Fig. 4). This is counterintuitive given expectations of island biogeography, which would predict a lower diversity of bacterial communities on the smallest and most isolated islands. This might be explained by chronic or recurrent latent infections, continuous transmission of Bartonella in bats within a population, and possible transmission events between populations through occasionally dispersing bats (and bat flies). These factors could sustain populations of bartonellae and prevent the local extinctions that are a fundamental to island biogeography theory.
The Bartonella prevalence in both bat fly species was comparable to previous studies using similar molecular detection methods (Table 2). Billeter et al. (Reference Billeter, Hayman, Peel, Baker, Wood, Cunningham, Suu-Ire, Dittmar and Kosoy2012) reported Bartonella prevalence of 57% (26/46), 72% (23/31) and 71% (42/59) in C. greefi flies collected from E. helvum from Ghana, Annobón and Bioko, respectively. Bai et al. (Reference Bai, Osinubi, Osikowicz, McKee, Vora, Rizzo, Recuenco, Davis, Niezgoda, Ehimiyein, Kia, Oyemakinde, Adeniyi, Gbadegesin, Saliman, Ogunniyi, Ogunkoya and Kosoy2018) reported Bartonella prevalence of 42% (21/50) in E. africana flies from R. aegyptiacus from Nigeria. Qiu et al. (Reference Qiu, Kajihara, Nakao, Mulenga, Harima, Hang'ombe, Eto, Changula, Mwizabi, Sawa, Higashi, Mweene, Takada, Simuunza and Sugimoto2020) reported prevalence of 47% (9/19) in E. africana flies collected in Zambia. There was no overlap in the genogroups of Bartonella found in C. greefi and E. africana, which reflects the specificity of these bacteria to their bat hosts (Kosoy et al., Reference Kosoy, Bai, Lynch, Kuzmin, Niezgoda, Franka, Agwanda, Breiman and Rupprecht2010; Bai et al., Reference Bai, Hayman, McKee and Kosoy2015; Qiu et al., Reference Qiu, Kajihara, Nakao, Mulenga, Harima, Hang'ombe, Eto, Changula, Mwizabi, Sawa, Higashi, Mweene, Takada, Simuunza and Sugimoto2020). This is reinforced by the ecological separation of the 2 hosts and bat fly vectors. While these bat species may interact occasionally at feeding sites, they exhibit different roosting behaviour, with E. helvum roosting predominantly in trees and R. aegyptiacus in caves. While C. greefi has been occasionally collected from R. aegyptiacus and E. africana from E. helvum (Theodor, Reference Theodor1955; Atama, Reference Atama2015; Nartey, Reference Nartey2015), these infrequent exchanges of flies do not appear to lead to Bartonella transmission from bat flies to an atypical host.
A secondary goal of this study was to find population-level predictors of Bartonella prevalence across sampled populations. Bartonella prevalence in bat flies was related to the age of bats, but this was only observed due to inadvertent sampling of very young bats on Bioko. This agrees with results from a captive colony of E. helvum in Ghana, wherein neonate bats were found to be initially uninfected with Bartonella and became infected when bat flies were present (McKee et al., Reference McKee, Webb, Kosoy, Bai, Osikowicz, Suu-Ire, Ntiamoa-Baidu, Cunningham, Wood and Hayman2021). It is important to note that sampling periods from this study were not all contemporaneous and density of flies in a population can also vary seasonally (Atobatele et al., Reference Atobatele, Olatubi, Oyeku, Ayokunle, Oladosu and Ogunnaike2023) and potentially interannually, which can have implications for Bartonella transmission. A longitudinal study of Bartonella infection in bats and bat flies from Bangladesh found that Bartonella prevalence in bats increased over the 9-month study period, which coincided with the rainy season, an influx of juvenile bats into the population, and an increase in the prevalence of bat flies (Fagre et al., Reference Fagre, Islam, Reeves, Kading, Plowright, Gurley and McKee2023). The study by Fagre et al. (Reference Fagre, Islam, Reeves, Kading, Plowright, Gurley and McKee2023) provides support for the hypothesis that bats become exposed to Bartonella relatively early in life following colonization by bat flies. We suggest that more longitudinal studies of Bartonella infection in bats and bat flies be performed to understand how Bartonella and bat fly prevalence vary seasonally and over a bat's lifespan to further understand the transmission dynamics of this microparasite.
In summary, the joint analysis of parasites and symbionts from African fruit bats has demonstrated that these organisms can reveal movement patterns and interactions among bat populations that are not apparent from analysis of host bats alone. Such movements could contribute to the maintenance of other infectious agents in these bats, including viruses (Peel et al., Reference Peel, Baker, Crameri, Barr, Hayman, Wright, Broder, Fernández-Loras, Fooks, Wang, Cunningham and Wood2012; Glennon et al., Reference Glennon, Becker, Peel, Garnier, Suu-Ire, Gibson, Hayman, Wood, Cunningham, Plowright and Restif2019). While direct interactions with bats are generally uncommon, close contact can occur in some subpopulations that participate in bat hunting and the consumption of bat meat (Mickleburgh et al., Reference Mickleburgh, Waylen and Racey2009; Kamins et al., Reference Kamins, Restif, Ntiamoa-Baidu, Suu-Ire, Hayman, Cunningham, Wood and Rowcliffe2011; Peel et al., Reference Peel, Wood, Baker, Breed, de Carvalho, Fernández-Loras, Gabrieli, Gembu, Kakengi, Kaliba, Kityo, Lembo, Mba, Ramos, Rodriguez-Prieto, Suu-Ire, Cunningham and Hayman2017; Baudel et al., Reference Baudel, De Nys, Mpoudi Ngole, Peeters and Desclaux2019) or tourism and other cultural practices in bat caves (Fujita et al., Reference Fujita, Miller, Miller, Gershman, Gallagher, Marano, Hale and Jentes2009; Timen et al., Reference Timen, Koopmans, Vossen, van Doornum, Günther, van den Berkmortel, Verduin, Dittrich, Emmerich, Osterhaus, van Dissel and Coutinho2009; Ohemeng et al., Reference Ohemeng, Lawson, Ayivor, Leach, Waldman and Ntiamoa-Baidu2017; Vora et al., Reference Vora, Osinubi, Davis, Abdurrahman, Adedire, Akpan, Aman-Oloniyo, Audu, Blau, Dankoli, Ehimiyein, Ellison, Gbadegesin, Greenberg, Haberling, Hutson, Idris, Kia, Lawal, Matthias, Mshelbwala, Niezgoda, Ogunkoya, Ogunniyi, Okara, Olugasa, Ossai, Oyemakinde, Person, Rupprecht, Saliman, Sani, Sanni-Adeniyi, Satheshkumar, Smith, Soleye, Wallace, Yennan and Recuenco2020). An understanding of the infection cycles of viruses and other bat-borne pathogens is critical for assessing the risk of spillover into human populations through various exposure routes (Pernet et al., Reference Pernet, Schneider, Beaty, LeBreton, Yun, Park, Zachariah, Bowden, Hitchens, Ramirez, Daszak, Mazet, Freiberg, Wolfe and Lee2014; Mannerings et al., Reference Mannerings, Osikowicz, Restif, Nyarko, Suu-Ire, Cunningham, Wood and Kosoy2016; Bai et al., Reference Bai, Osinubi, Osikowicz, McKee, Vora, Rizzo, Recuenco, Davis, Niezgoda, Ehimiyein, Kia, Oyemakinde, Adeniyi, Gbadegesin, Saliman, Ogunniyi, Ogunkoya and Kosoy2018; Mbu'u et al., Reference Mbu'u, Mbacham, Gontao, Sado Kamdem, Nlôga, Groschup, Wade, Fischer and Balkema-Buschmann2019; Vora et al., Reference Vora, Osinubi, Davis, Abdurrahman, Adedire, Akpan, Aman-Oloniyo, Audu, Blau, Dankoli, Ehimiyein, Ellison, Gbadegesin, Greenberg, Haberling, Hutson, Idris, Kia, Lawal, Matthias, Mshelbwala, Niezgoda, Ogunkoya, Ogunniyi, Okara, Olugasa, Ossai, Oyemakinde, Person, Rupprecht, Saliman, Sani, Sanni-Adeniyi, Satheshkumar, Smith, Soleye, Wallace, Yennan and Recuenco2020). On a broader level, this study increases our knowledge of the complex ecology and population genetics of host–microbe systems that are widespread in nature.
Supplementary material
The supplementary material for this article can be found at https://doi.org/10.1017/S0031182024000660.
Data availability statement
The data that support the findings of this study are available in the supplementary material of this article. Representative sequences for bat fly mitochondrial haplotypes and Enterobacterales symbiont haplotypes are available on GenBank (OQ381235–OQ381238, PP259531–PP259537 and PP259995–PP259997). Phylogenetic trees, R code and additional data sheets are available on GitHub (https://github.com/clifmckee/GoG_bats_bat_flies).
Acknowledgements
The authors thank Romain Garnier for contributing bat fly samples and Lynn Osikowicz, Paul Lazarus and Jacqueline Smith for assistance with laboratory analyses. The authors also thank current and former members of the Webb Lab and Chris Funk for their comments on early versions of the manuscript. The authors thank the governments of Ghana, Tanzania, Malawi, Zambia, Uganda, Equatorial Guinea and São Tomé and Príncipe for facilitating this research. For their invaluable support in planning and implementing the fieldwork, the authors also thank the Equatorial Guinea Ministerio de Agricultura y Bosques; Equatorial Guinea Instituto del Desarrollo Forestal y Gestión de las Áreas Protegidas; Universidad Nacional de Guinea Ecuatorial; São Tomé and Príncipe Ministério de Agricultura, Desenvolivimento Rural e Pesca; Ecosystémes Forestiers d'Afrique Centrale; Associacão Monte Pico, São Tomé and Príncipe; Lucrecia Bilé Osa Ahara; Iñaki Rodriguez Prieto; Andrés Fernandez Loras; Heidi Ruffler; Ricardo Castro Cesar de Sa; Ricardo Faustino de Lima; and Mariana Carvalho.
Author contributions
A. J. P., D. T. S. H., A. A. C. and J. L. N. W. designed research; C. D. M., A. J. P. and D. T. S. H. performed research; C. D. M. analysed data; C. D. M. and C. T. W. wrote the paper; all authors contributed to and approved the final version of the paper.
Financial support
A. J. P. received funding from the Charles Slater Fund, Zebra Foundation for Veterinary Zoological Education and Isaac Newton Trust for field studies. A. A. C. was supported by Research England and a Royal Society Wolfson Research Merit Award. J. L. N. W. is supported by the Alborada Trust. D. T. S. H. received funding from the Wellcome Trust, the Royal Society Te Apārangi (MAU1701) and the Massey Foundation Percival Carmine Chair in Epidemiology and Public Health.
Competing interests
None.
Ethical standards
Permits for bat capture and sampling were granted by national and local authorities and under ethics approval from the Zoological Society of London Ethics Committee (WLE/0489 and WLE/0467). Field protocols for handling and collecting samples from bats followed guidelines from the American Society of Mammalogists.


 Open access