


Several recent reviews concluded that the consumption of fish decreases the risk of CHD and coronary heart mortality(Reference Konig, Bouzan, Cohen, Connor, Kris-Etherton, Gray, Lawrence, Savitz and Teutsch1–Reference Psota, Gebauer and Kris-Etherton4). Intervention studies found that fatty fish intake influences several important risk factors for CVD such as blood pressure, TAG, HDL and inflammation(Reference Undeland, Ellegard and Sandberg2). These beneficial effects of fatty fish are mainly ascribed to the marine n-3 PUFA EPA and DHA, whose effects were demonstrated in numerous studies on fish-oil intake(Reference Hooper, Thompson and Harrison5). But fish also contain other important nutritional components that may influence the total health-beneficial outcome. To begin with, fish tissue is rich in endogenous antioxidants. Intake of such antioxidants in a fish meal could theoretically help prevent oxidative stress in the body, caused by the easily oxidised n-3 PUFA. The liquid fraction (press juice) from herring was found to prevent oxidation in a food system(Reference Undeland, Hultin and Richards6) and to have antioxidative effects in a human monocyte model system(Reference Gunnarsson, Undeland, Sannaveerappa, Sandberg, Lindgard, Mattsson-Hulten and Soussi7). Second, fish contains high concentrations of Se, which has been related to a reduced risk of CVD(Reference Rayman8, Reference Luong and Nguyen9). The selenoprotein glutathione peroxidase may reduce accumulation of oxidised LDL in the artery wall(Reference Rayman8). Fatty fish is also rich in vitamin D3, a key regulator in Ca homeostasis and bone turnover. Some epidemiological data indicate that osteoporosis is associated with obesity and CVD(Reference Richart, Li and Staessen10). Recent studies also suggest that vitamin D is associated with low blood pressure(Reference Forman, Bischoff-Ferrari, Willett, Stampfer and Curhan11) and influences the LDL:HDL ratio beneficially in combination with Ca(Reference Major, Alarie, Dore, Phouttama and Tremblay12). Further, fish (cod) proteins have been found to have positive effects on blood pressure, lipoproteins and TAG and to prevent insulin resistance in animal studies(Reference Ait-Yahia, Madani, Savelli, Prost, Bouchenak and Belleville13–Reference Tremblay, Lavigne, Jacques and Marette19). Fish (salmon) intake has been reported to be much more efficient in increasing serum EPA and DHA than cod liver-oil supplementation, which suggests that EPA and DHA are more easily absorbed when consumed in a fish matrix(Reference Elvevoll, Barstad, Breimo, Brox, Eilertsen, Lund, Olsen and Osterud20). Harries et al. reported that EPA may be more bioavailable in the short-term from fish than from fish oil capsules, but no difference in EPA and DHA content in erythrocytes or plasma phospholipids was shown after 4 months(Reference Harris, Pottala, Sands and Jones21). Although the endogenous levels of the compounds described above differ between fish species, few studies on the intake of a single fish species have been reported.
The composition of the control and background diets and compliance are important issues in dietary intervention studies. Various plant oils are usually used as a control for fish oil, but in fish dietary studies, the control diet is commonly the subject's habitual diet without an intervention meal added. A cross-over design is preferable to avoid inter-individual variation and to minimise differences between background diets, but few such studies on fish intake have been reported, and the study participants in these studies prepared the intervention dishes on their own(Reference Beauchesne-Rondeau, Gascon, Bergeron, Jacques, Noreau and Moorjani22–Reference Flynn, Heine, Nolph, Naumann, Parisi, Ball, Krause, Ellersieck and Ward24). Food preparation and choice of side dishes could vary between fish and meat meals and influence outcome, but this is seldom considered in fish dietary studies(Reference Larsen, Stormo, Dragnes and Elvevoll25).
The present study evaluates the effects of a diet rich in specified, pre-made herring meals on CVD risk factors in healthy, overweight men. The study was designed to minimise influences of differences in background diets, choice of side dishes, and cooking procedure.
Subjects and methods
Subjects
Forty overweight (BMI>25 kg/m2) men (mean age 48 years, range 35–60 years) from Volvo Car Corporation (Torslanda, Sweden) volunteered for the study. Table 1 lists their baseline characteristics. None smoked or had high alcohol consumption (>ten units/week). Subjects were considered eligible if they were healthy, had no chronic or serious disease, and were willing to eat herring once per d, 5 d/week, for 6 weeks. They were considered ineligible if they took blood lipid-lowering or anti-inflammatory drugs. None normally ate fish more than three times per week, and they ate no functional food products or other foods with high amounts of long-chain n-3 PUFA.
Table 1 Baseline characteristics for the thirty-five subjects
(Mean values, standard deviations and ranges)
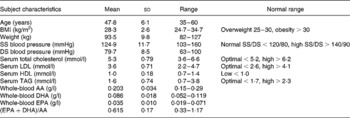
SS, systolic; DS, diastolic; AA, arachidonic acid.
Thirty-five subjects completed the study. Four of these thirty-five subjects' data were excluded in the TAG analyses due to having breakfast before sampling. For C-reactive protein analyses, eleven subjects were excluded because they suffered from a cold or due to temporary use of anti-inflammatory drugs (ibuprofen). The study was approved by the ethical committee of Sahlgrenska University Hospital (Göteborg, Sweden).
Experimental design
The study was a randomised, cross-over, intervention study (2 × 6 weeks), with herring meals for 6 weeks, chicken or lean pork meals for 6 weeks, and a 12-week washout period between the two interventions. The subjects were given ten meals every 2 weeks and instructed to eat one of these meals at lunch or dinner every day, 5 d per week, and preferably on weekdays. From 2 weeks before the study until the end of the study, the subjects were instructed to follow their normal diet, to exclude functional foods from their diet, to eat a maximum of two fish meals per week (outside of the study meals with herring), and to consume a maximum of two alcohol units/week. They were also asked to maintain their weight during this 25-week period, if possible. Body weight was checked at each sampling. The first 6-week study period took place in the spring of 2005 and the second in the autumn. Fasting blood samples were collected before and after each period.
Food preparation
The herring was caught on two occasions, at the end of February 2005 (North Kattegat sea) and at the beginning of September (South Skagerrak sea; used only for the first half of intervention period 2). Fresh butterfly fillets of herring were delivered from Paul Mattson AB (Ellös, Sweden) the morning after they had been filleted, which was 1–2 d after the catch. The dorsal fins were removed, and the herring fillets were vacuum-packed flat in plastic bags and frozen with a blast freezer (from about 8°C to − 20°C in about 30 min). Fresh pork fillets were obtained about 3 d after slaughter (Dalsjöfors or Dalberg slaughterhouses, Sweden) and fresh chicken fillets about 1 d after slaughter (Mowits Chicken, Trollhättan, Sweden). Both fillet types were delivered from Johan i Hallen (Göteborg, Sweden). Before freezing, the chicken fillets were sliced and the pork fillets were sliced and browned (to prevent the meat from getting dry during subsequent cooking). Herring, chicken, and pork fillets were kept at − 40°C until the food was prepared.
The dishes were prepared on four occasions at Micvac AB (Mölndal, Sweden) with the patented ‘MicVac method’. Vacuum-packed meat and herring were thawed in a cold water-bath and, together with the other meal constituents (about 430 g/portion in total), were weighed and placed on a tray. The filled tray was sealed with a film equipped with a purpose-designed valve. The tray was then transported through a microwave tunnel where the product was cooked. Air and steam produced by the cooking ingredients escaped through the valve; after cooking, when the tray had cooled down, the valve closed. The remaining steam condensed and created an under pressure in the package, which resulted in the final product: a cooked, pasteurised, and vacuum-packed dish.
After cooking, the dishes were further chilled to 2–4°C within about 1 h using a fan cooler. The vacuum-packed food was kept at 4°C, transported to Volvo Cars Corporation in Torslanda, and then kept in refrigerators at 4°C. The study participants picked up the meals and kept them until consumption in their own refrigerators (at work or at home) at 4–8°C. Before eating, they heated the vacuum-packed dish in the microwave oven on full power. A beep from the valve indicated when the food was ready to eat (after 2–4 min).
Dietary intervention
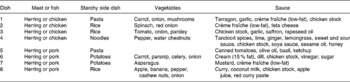
The dishes contained exactly 150 g raw herring or 150 g raw chicken or 130 g browned pork fillets (weight loss during browning was about 20 g). The protein source in the reference meals was chosen to provide as neutral animal protein source as possible. Lean meat was chosen to avoid a higher intake of SFA in the reference diet than in the herring diet. Table 2 describes the eight dishes with herring or chicken/pork fillets that the study participants received. The side dishes were varied as much as possible to avoid monotony and to provide a nutritious diet. A fat mixture was added to the reference meals (chicken and pork) to compensate for their lower fat content compared with the herring meals. The fat mixture contained 30 % rapeseed oil, 30 % sunflower-seed oil and 40 % margarine. It constituted about 25 % saturated, 38 % monounsaturated and 30 % polyunsaturated fat, which is a mixture of SFA, MUFA and PUFA similar to that found in herring. However, the individual fatty acids in the various groups differed.
Table 2 The eight different intervention dishes
Average EPA and DHA intake was about 1·2 g/d during the herring diet, while the reference diet provided insignificant amounts (0·04 g/d). Each of the intervention meals provided about 28 % energy from proteins, 33 % energy from fat and 39 % energy from carbohydrates (about 2100 kJ/d). Apart from the intervention diet, the subjects consumed their normal diet. Compliance was checked by 24 h dietary recalls and analyses of fatty acid concentrations in whole blood.
Compositional analysis of the food
Raw herring, pork and chicken were analysed for total lipids and fatty acid composition. Total lipids were extracted with chloroform and methanol according to Lee's procedure(Reference Lee, Trevino and Chaiyawat26). Then 2 g homogeneous and pooled samples were taken from the herring, chicken, and pork minces.
Fatty acid composition was determined in the extracted lipids by converting the fatty acids to methyl esters according to a modification of the method of Lepage & Roy(Reference Lepage and Roy27, Reference de Ruiz, de Renobales, del Cerro, de Fernandes, Amiano and Dorronsoro28). The extracted lipids were dissolved in toluene, and 2 ml of this extract was transferred to tubes with fluoropolymer-lined caps. Acetyl chloride, 2 ml (10 %), dissolved in methanol was added to the lipid samples. Methylation occurred in tightly closed tubes that were placed in a 70°C water-bath for 2 h and shaken every 30 min. After cooling, 1 ml Milli-Q water and 1 ml petroleum ether were added, and the tubes were shaken and centrifuged mildly (2500 rpm) for 5 min at room temperature. Then 2 ml of the upper petroleum ether phase was withdrawn and evaporated at 40°C under a stream of N2, and the fatty acid residue was redissolved in 400 μl isooctane. Fatty acid methyl esters (FAME) were analysed on a Hewlett–Packard 5890 capillary gas chromatograph (Waldbronn, Germany) equipped with a Hewlett–Packard auto-injector 7673 (Waldbronn, Germany) and concentrations determined with a flame ionisation detector. An SPB-5 column (30 m × 0·25 mm, 0·25 μm) from Supelco (Bellefonte, PA, USA) was used to separate FAME with H2 as the carrier gas. The initial temperature was 180°C, and it was elevated by 5°C/min until 250°C. The injection temperature was 300°C and the detection temperature 325°C. Borwin (Le Fontanil, France) evaluation chromatography software was used to evaluate the FAME.
Dry weight was calculated by drying 5 g muscle samples at 105°C until a constant weight was obtained. Protein content was estimated as the difference between wet weight, dry weight and fat content.
Nutritional values of the meals and of the whole diet (from 24 h recalls) were calculated using a software package (Dietist®; Aivo, Bromma, Sweden) based on data from the Swedish National Food Administration. The nutritional composition of herring with respect to total fat, protein, water, vitamins E, A, D and B12 and Se was adjusted after analysing samples from the herring provided in the study, since herring composition varies over the year. The analyses of vitamins A, D and B12 and Se were performed at the accredited laboratory Analycen (Lidköping, Sweden). Vitamin E was analysed in our laboratory with an HPLC method described in the paper of Sannaveerappa et al. (Reference Sannaveerappa, Sandberg and Undeland29).
Blood analysis and bleeding time
Plasma cholesterol and plasma TAG concentrations were determined using fully enzymic techniques. Plasma HDL was determined after precipitation of p-apolipoprotein apo B-containing lipoproteins. Precipitation with dextran sulfate was done to separate plasma HDL2 and HDL3 subfractions(Reference Gidez and Miller30), and plasma LDL-cholesterol was calculated as described by Friedewald et al. (Reference Friedewald and Lecy31). These analyses were performed on a Konelab 20 autoanalyser (Thermo Clinical Labsystems, Espoo, Finland). Plasma C-reactive protein was measured by an ultra-sensitive method (Orion Diagnostica, Espoo, Finland). Whole-blood fatty acid composition was determined as FAME by direct methylation of 100 μl blood without prior fat extraction. FAME were determined as described above.
Serum concentrations of IL-6 were measured with a high-sensitive ELISA, and intercellular adhesion molecule-1 (ICAM-1) concentrations were determined with commercially available ELISA (R&D Systems Inc., Minneapolis, MN, USA). Oxidised LDL was measured with a sandwich ELISA (Mercodia AB, Uppsala, Sweden) and serum IL-18 with an ELISA method (Medical & Biological Laboratories Co., Ltd, Nagoya, Japan). Between-assay variation was below 10 % for all assays.
Antioxidative capacity, i.e. hydrophilic antioxidants, in serum was measured with the oxygen radical absorbance capacity (ORAC) assay(Reference Davalos, Gomez-Cordoves and Bartolome32, Reference Ou, Hampsch-Woodill and Prior33) in non-protein serum fractions. Serum samples were treated with 0·5 m-perchloric acid (PCA) and centrifuged at 14 000 g for 10 min at 4°C to remove proteins(Reference Ou, Hampsch-Woodill and Prior33). The supernatant fraction was diluted with 75 mm-phosphate buffer (pH 7·4). The procedure then followed the method described by Davalos et al. (Reference Davalos, Gomez-Cordoves and Bartolome32). Fluorescence was measured every 30 s for 2 h in a microplate reader (Safire-II-basic; Tecan, Grödig, Austria). Bleeding time was determined with a Simplate IIR device (Organon Technica, Västra Frölunda, Sweden) according to Mielke(Reference Mielke34).
All analyses were done at the Wallenberg Laboratory (Sahlgrenska University Hospital, Göteborg, Sweden) except for analyses of food composition and blood fatty acids and the ORACPCA assay, which were done at the Division of Food Science (Department of Chemical and Biological Engineering, Chalmers University of Technology, Göteborg, Sweden).
Statistical methods
All statistical calculations are comparisons between the two intervention diets made with the paired Student's t test and presented as mean values and standard deviations, with significance set at P < 0·05. Microsoft® Office Excel, 2003, SP2 (Microsoft Corp., Redmond, WA, USA) was used for t test and descriptive statistics. The Statistical Package for the Social Sciences (SPSS, version 14.0 for Windows; SPSS Inc., Chicago, IL, USA) was used for box plots and for testing with the Wilcoxon signed rank test, when a non-normal distribution was expected.
Results
Diet intake and compliance with dietary instructions
Table 3 describes the composition of raw herring, chicken and pork. Based on average values, the reference meats (chicken and pork) and the herring had similar contents of fat, protein and water. To compensate for the small difference in total fat content between the reference meals and the herring meals, extra fat was added to the chicken meals. Table 3 also illustrates the high EPA and DHA fatty acid content of the herring compared with the chicken and pork.
Table 3 Composition of the raw herring, chicken and pork meat used in the study

* Values are averages.
Results of the 24 h recalls indicated that the participants followed the dietary instructions. The recalls also indicated lower energy intake during the reference period compared with the herring period, especially on days when a reference meal was eaten. Energy percentages of fat (about 31 %), protein (about 19 %) and carbohydrates (about 50 %) were similar during both dietary periods and in the background diet. When no study meals were eaten on weekends, energy intake among the participants varied widely. Compliance in the last weeks of the second study period was somewhat lower and most participants had between one and three dishes left out of thirty of the provided meals when the study ended.
Although the herring was lean (5·7 % fat) it contained (per 100 g) 8·5 μg vitamin D, 1·04 μg vitamin E, 12 μg B12 and 38 μg Se. The content of vitamin A was below 21 μg/100 g. The total reported intake of Ca, vitamins D and B12 and Se was higher after the herring period than after the reference period based on intake reported at the 24 h recalls. Differences in other minerals and vitamins after the two test periods were non-significant. The 24 h recalls from the days on herring and background diet (days when no intervention meal was eaten, i.e. days during weekends) showed that these diets provided enough Ca according to the recommended daily intake (RDI)(35), but the reference diet only provided about half of this (490 mg Ca/d). Vitamin D (2·8 μg/d) and Se (35 μg) contents in the reference diet were lower than the RDI (5 v. 50 μg/d), but the herring diet provided sufficient amounts; 15·8 μg vitamin D/d and 83 μg Se/d. The herring diet also provided 21·2 μg vitamin B12/d in comparison with the reference diet that just provided about the RDI of vitamin B12; 2·4 μg/d. Both intervention diets provided more Fe and tocopherol than the background diet.
Measurements of whole-blood fatty acids
The whole-blood (EPA+DHA):arachidonic acid (AA) ratio was measured in each participant, from the start to the end of the herring intervention, and the increase found confirmed that the participants ate the provided food. The increase in (EPA+DHA):AA after the herring diet was independent of whether the herring diet was the first or the second intervention diet. At the start of the study, (EPA+DHA):AA varied between 0·32 and 1·17 % of whole-blood fatty acids, which reflects normal fish consumption and individual variation in whole-blood fatty acids. After the herring intervention, mean (EPA+DHA):AA (range 0·34–1·29 %) was significantly higher compared with after the reference diet (range 0·28–0·89 %). EPA and DHA percentages were also measured in those individuals with a small increase in (EPA+DHA):AA to ensure that these fatty acids increased after herring intake. Table 3 shows AA, EPA and DHA concentrations in whole blood at baseline and at the end of each dietary period. At the start of both intervention periods, a similar fatty acid ratio was found. EPA and DHA tended to be lower and AA higher after the reference diet. After the herring intervention, EPA and DHA were significantly higher (P < 0·00001).
Influence of the herring intervention on risk factors or biomarkers for CVD
The dietary interventions did not influence body weight. HDL and HDL2 were higher after the herring intervention compared with the reference intervention (Table 4). TAG was reduced in both intervention diets compared with start values (Table 4). None of the other biomarkers were significantly changed, although the oxidised LDL:LDL ratio tended to be lower after the herring period compared with after the reference period.
Table 4 Biomarkers and risk factors for CVD
(Mean values and standard deviations for thirty-five men)
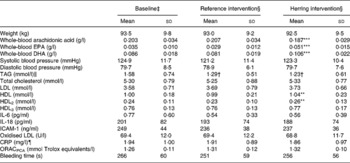
ICAM-1, intercellular adhesion molecule-1; CRP, C-reactive protein; ORACPCA, oxygen radical absorbance capacity using perchloric acid.
Mean value was significantly different from that for the reference intervention: **P < 0·01, ***P < 0·00001.
† Mean value was significantly different from that at baseline (P < 0·05).
‡ Baseline values were obtained at the start of the study.
§ Intervention values were obtained after 6 weeks of intervention.
∥ n 31 (Excluding subjects reporting breakfast before sampling).
¶ n 24 (After excluding values >20, reported cold or reported intake of acetylsalicylic acid).
Discussion
In the present controlled, cross-over intervention, thirty-five overweight men were provided with and ate herring dishes 5 d/week for 6 weeks. During the 6-week control period, the men ate the same dishes but with chicken or lean pork. The herring diet improved HDL compared with the reference diet, but no other changes in blood lipids were found. The EPA- and DHA-rich herring diet did not result in increased oxidised LDL or decreased antioxidative capacity, which could be due to potent antioxidants from the fish muscle.
Higher HDL after the herring intervention compared with the reference intervention
The increase in HDL due to herring intake suggests that herring may have important health benefits since low HDL is a well-known risk factor for CVD(Reference Gordon and Castelli36, Reference Miller and Miller37). Average HDL was 0·99 mmol/l after the reference diet and 1·04 mmol/l after the herring diet. In a pilot study where obese subjects (women and men) were given herring and reference meals similar to the ones used in the present study, HDL was higher after the herring dietary period(Reference Lindqvist, Langkilde, Undeland, Radendal and Sandberg38). The larger and less atherogenic HDL2-cholesterol was also higher after the herring intervention in the present study. Dietary n-3 PUFA were also found to increase HDL2 in previous studies(Reference Schmidt, Skou, Christensen and Dyerberg39, Reference Tholstrup, Hellgren, Petersen, Basu, Straarup, Schnohr and Sandstrom40). Mori et al. compared additions of fish or fish oil to a high-fat (40 % energy from fat) and a low-fat diet (30 % energy from fat) and demonstrated that HDL and HDL2 were higher when fish fatty acids were added. Interestingly, the low-fat diet decreased HDL, but the reduction was counteracted by addition of fish oil(Reference Mori, Vandongen, Beilin, Burke, Morris and Ritchie41). This effect might explain why some studies on fish and fish-oil intake show no effect on HDL. Because HDL generally is lower in overweight and obese individuals(Reference Howard, Ruotolo and Robbins42–Reference Angelopoulos, Moffatt and Stamford44), which we also found in our two studies, fish consumption may be beneficial for these individuals, especially for maintaining high HDL during weight reduction.
Both intervention diets lowered TAG significantly. This could be due to the high content of protein and fat and low content of carbohydrates (31 % of energy) in both intervention meals(Reference Hilpert, Griel, Psota, Gebauer, Coa, Kris-Etherton, Moffatt and Stamford45). The difference in TAG decrease between the diets was non-significant. Thus, the proportions of carbohydrates, proteins and fat in a diet may be more efficient in lowering TAG than an increase in fish intake. Here, choice of control diet is important.
However, numerous studies have found that marine n-3 PUFA lowers TAG. The minimum intake considered necessary to lower TAG – about 1 g long-chain n-3 PUFA/d – was the amount provided by the herring diet in the present study. Hence, the n-3 PUFA in the present study were at the lower limit for expecting a reduction in TAG since the herring was quite lean (5·7 % fat). Seierstad et al. (Reference Seierstad, Seljeflot, Johansen, Hansen, Haugen, Rosenlund, Froyland and Arnesen46) found that TAG was significantly lower after a salmon diet providing EPA and DHA at 2·9 g/d but not after a salmon diet providing only 1·5 g/d. Studies on fish-oil intake concluded that the TAG-lowering effect is not only dose- but also time-dependent(Reference Milte, Coates, Buckley, Hill and Howe47). A diet that is rich in fatty herring and provides sufficient EPA and DHA for extended periods might be beneficial in maintaining low TAG, but the present study found that the total composition of the diet had a larger impact on TAG.
Blood pressure and bleeding time
In observational studies, habitual dietary fish intake has been associated with low blood pressure, but few such intervention studies have been published. In the present study, blood pressure was not lower after the herring diet period compared with after the reference period. Bao et al. (Reference Bao, Mori, Burke, Puddey and Beilin48) reported a decrease in blood pressure, while von Houwelingen et al. (Reference von Houwelingen, Nordøy, van der Beek, Houtsmuller, de Metz and Hornstra49) observed no such effect. The diets in both studies contained about 4 g EPA and DHA per d.
Studies have reported increases in bleeding time with fatty fish intake(Reference von Houwelingen, Nordøy, van der Beek, Houtsmuller, de Metz and Hornstra49, Reference Thorngren50). Other studies have not observed this effect with fish or fish-oil intake(Reference Blonk, Bilo, Nauta, Popp-Snijders, Mulder and Donker51). We saw no effect on bleeding time, although whole-blood EPA and DHA were significantly higher after the herring than after the reference diet intervention. Von Houwelingen et al. (Reference von Houwelingen, Nordøy, van der Beek, Houtsmuller, de Metz and Hornstra49) found that bleeding time was significantly longer after 6 weeks – but not after 3 weeks – on a fish diet compared with a control diet. Thus, the effects of long-chain n-3 PUFA observed in prolonged bleeding time could depend on very high doses and on long treatment periods.
Inflammatory markers and antioxidative capacity
EPA and DHA have several potent mechanisms for reducing inflammation: increased generation of less inflammatory EPA-derived eicosanoids and decreased generation of AA-derived eicosanoids, of inflammatory cytokines such as IL-6 and IL-18, and of adhesion molecules such as ICAM-1(Reference Calder52). Thus, a herring-rich diet could theoretically decrease IL-6, IL-18 and ICAM-1. However, none of these markers was lower after herring intake in the present study. Seierstad et al. (Reference Seierstad, Seljeflot, Johansen, Hansen, Haugen, Rosenlund, Froyland and Arnesen46) found lower vascular cell adhesion molecule-1 and IL-6 in patients with CHD after 6 weeks' consumption of tailor-made salmon fed with fish oil (providing 2·9 g EPA and DHA per d) compared with tailor-made salmon fed with fish oil and rapeseed oil (providing 1·5 g EPA and DHA per d). ICAM-1 was unaffected. That the subjects in the present study were healthy, although overweight, could explain the lack of effect on inflammatory markers. Studies of fish-oil intake have also reported disparate results concerning vascular adhesion molecules and inflammatory cytokines, which Eschen et al. (Reference Eschen, Christensen, De Caterina and Schmidt53) proposed might be because the effects are sex-, time- and dose-dependent.
Fish oil contains highly unsaturated fatty acids that are easily oxidised. Thus, intake of fish oil could theoretically increase oxidation in the body. However, previous studies have reported diverse results in this field(Reference de Ruiz, de Renobales, del Cerro, de Fernandes, Amiano and Dorronsoro28, Reference Wolmarans, Labadarios, Benade, Kotze and Luow54, Reference Anttolainen, Valsta, Alfthan, Kleemola, Salminen and Tamminen55). Serum antioxidative capacity according to the ORACPCA assay was not lower after herring intake compared with after the reference diet in the present study. Differences in oxidised LDL between the intervention groups were non-significant. The oxidised LDL:LDL ratio was slightly, but not significantly, lower after the herring diet compared with the reference diet. Studies on n-3 PUFA intake have reported varied results on LDL susceptibility to oxidation (oxidation of isolated LDL); some observed no changes, some decreases, and some increases(Reference Lapointe, Couillard and Lemieux56). It has also been shown that HDL can protect LDL against oxidation(Reference Kontush, de Faria, Chantepie and Chapman57). Seierstad et al. (Reference Seierstad, Seljeflot, Johansen, Hansen, Haugen, Rosenlund, Froyland and Arnesen46) observed (1) no effect on circulating oxidised LDL after a salmon diet with 2·9 g EPA and DHA per d and (2) a small increase in circulating oxidised LDL after a salmon diet with only 1·5 g/d. These and our own results indicate that fish muscle antioxidants may play an important role in preventing in vivo oxidation.
Intervention meals
Most study participants ate the study meals at lunch, usually in a lunch restaurant. The portions in the study were small, about 2100 kJ, and energy recommendations for a lunch for men aged 30–60 years are about 3000–4000 kJ. Our choice of a lower-energy meal was to ensure that the participants finished the entire meal. After the first few weeks, when we received a few complaints about portion size, the participants seemed to adapt to the smaller portions or got used to including bread or salad with the meal.
The herring used in the diet provided high amounts of important nutrients such as vitamins D and B12 and Se in addition to EPA and DHA. Vitamin D insufficiency is not uncommon during winter in Nordic countries since it has to be provided through the diet. The content of vitamin D is negligible in most food, with fatty fish as one exception. The herring diet provided about three times the RDI of vitamin D in comparison with the reference diet that did not even provide the RDI. Since the study was preformed during the summer months this did not cause a vitamin D insufficiency among the study participants. Vitamin D insufficiency has been related to CVD and type 2 diabetes mellitus(Reference Zittermann58) and an inverse relationship between vitamin D and the extent of vascular calcification have been found in observational studies in populations with a moderate to high risk for CHD(Reference Watson, Abrolat, Malone, Hoeg, Doherty, Detrano and Demer59, Reference Pittas, Lau, Hu and Dawson-Hughes60). Also Se and vitamin B12 have been linked to CVD. Vitamin B12 intake decreases homocysteine. High homocysteine is related to CVD, but studies have so far have failed to show that lowering homocysteine decreases the risk for CVD(Reference Wierzbicki61, Reference Clarke, Lewington, Sherliker and Armitage62). Se is an essential trace mineral and is a component in glutathione peroxidases. Glutathione peroxidase has been found to reduce hydroperoxides of phospholipids and cholesteryl esters associated with lipoproteins, and could possibly prevent the oxidation of LDL. Prospective epidemiological studies on Se status and CVD have mixed findings(Reference Rayman8). Thus, including herring in the diet has several possible beneficial effects on cardiovascular health.
Conclusion
Healthy overweight men had higher HDL, but not lower TAG, when they ate herring dishes for 6 weeks compared with when they ate matched dishes of chicken and lean pork. That TAG was unaffected was probably due to the lower doses of EPA and DHA in the present study compared with many fish-oil studies. Also, addition of herring to the diet, compared with chicken and lean pork, did not influence blood pressure, bleeding time or inflammatory markers. No adverse effects on in vivo oxidation or serum antioxidant status after herring intake were observed. Thus, herring is a good dietary source of EPA and DHA, but also of other important nutrients such as antioxidants, vitamins D and B12 and Se. Especially overweight or obese subjects, with a low HDL, could benefit from a higher intake of herring.
Acknowledgements
The present study was supported by Region Västra Götaland, National Board of Fisheries (Dr 223-2451-01), Sweden (European Union Structural Funds) and The Swedish Research Council for Environment, Agricultural Sciences and Spatial Planning (FORMAS) (grant no. 2001-1246).
All authors designed the study. H. M. L. was responsible for planning the diet, meal production, volunteer recruitment, food and plasma analyses, statistical analyses, and in general, the practical realisation of the intervention study. A. M. L. had medical responsibility. H. M. L. interpreted the data and, in collaboration with A.-S. S. and I. U., wrote the manuscript. A. M. L. contributed to the writing of the manuscript. None of the authors has any conflicts of interest.
We would like to thank: Paul Mattsson AB (Ellös, Sweden) which supported and provided the herring fillets; Micvac AB (Göteborg, Sweden) for the use of their test kitchen and production line; Feelgood AB, for lending us examination rooms; and Amica AB, for help with administrating the food dishes. We also thank Volvo Personvagnar, Torslanda, Sweden, for letting us recruit volunteers among their employees; special thanks to the volunteers. We are grateful to chef Leif Mannerström, who helped us compose tasty recipes, and to Annette Almgren and Britt Holmberg, who were in charge of blood sampling.


